BB: Is at the PCZ of a Bullish Gartley and a Bullish Deep CrabBlackBerry is attempting a spring-and-back-test-of-spring at the bottom of the range that it's been trading within since 2012, and the level happens to align with the PCZ of a huge Bullish Deep on the left, to which it has reacted once before, and on its way to testing the zone a second time and back testing the spring. It's also formed a smaller, more localized Bullish Deep Gartley with some hidden Bullish Divergence on the MACD. If it manages to get back above $5 and stay above $5 in the active session, we would then have room to see it pump all the way up to $24.89 really fast as that is the next major level above and near the 200-Month SMA, but if things really want to get serious, we could see BB complete a Full Measured move of this range which would take it all the way up to the 50% retrace up at around $45.39
Hidden Bullish RSI Divergence

JAI CORP rsi daily showing bullish convergencejai corp after good down trend ready to take another bullish run .
the first resistance can be near recent tops and a breakout can lead to further upside of 330.

RAILTEL very bullish price gave positive moment.RAILTEL recently gave very good returns and took a small break from bullish view.
I think the first down leg is over and new leg is going to take place .
the present target will be the recent high as resistance.
stop loss at 209

Month on Month US Inflation Harmonically Set to Rise to 1.94%This is a followup to this year-on-year inflation chart idea posted back in June 2022:
The YoY US Inflation rate has been on a trend of going down since it tested the 1.414 PCZ of the Bearish Butterfly above, but recently we have seen the MoM rate slow its descent and form a bottoming pattern with MACD Hidden Bullish Divergence at the 200-Month SMA and now we can see that the MACD has crossed positively as the inflation rate has broken out of its recent range. This harmonically puts it into position where we will likely see it at least hit the 0.886 retrace to complete a small bat pattern, but it could go out of control and go as high as the 1.618 Fibonacci Extension area all the way at about 1.94%.
One reason I suspect for the sudden stop of the inflationary decline is due to the Fed not raising rates high enough, fast enough, and then keeping them the same for the last few months. It would also seem that the year-on-year inflation rate is setting up for a similar rise, showing Hidden Bullish Divergence at the Moving Averages and likely one that will result in it going to test higher highs to around its 1.414-1.618 PCZ once area once more before ultimately crashing back down from these highs once the Fed starts to go heavy on rate hikes again. Though the timeframe may be shorter than how it is presented on the chart, I do still suspect we will have action resembling what is projected on the chart below until the Fed starts rising rates aggressively again:
This does not mean I think stocks will go up, that the dominance of the dollar will go down, or even that I think the consumer credit situation will improve. Instead, I think the rise in inflation will be fueled by energy, import, and export costs, and that this will be very bad for: Stocks, Consumers, REITs, and Banks overall, and that the Bond Yields will continue to rise at an accelerated rate.

SQQQ: Bullish Butterfly with PPO Circle and MACD DivergenceThe SQQQ has given us PPO Confirmation at a potential 1.414 Bullish Butterfly PCZ and has topped it off with MACD Hidden Bullish Divergence. If we are to see the QQQ pull back 50-65% then the SQQQ should go up about 100-200% from here, though I may end up just targeting $32 depending on how fast it goes.

USDPLN: Hidden Bullish Divergence at Channel Demand LineUSDPLN on the Higher timeframes has generated some PPO arrows and Hidden Bullish Divergence at the Demand line of an Upwards Slopping Channel, which also happens to align with the 200 SMA. If it can hang on from here, I think it will make a run back up towards the top of the channel.

Hidden Diveregence : Bitcoin still got the strength to go North.Hey guys, How are you doing? I hope the market is treating you well and the hype is on the verge to explode like it always did in the previous pre-bull run scenarios.
In today's insight I just want to remind you that a hidden bullish divergence is on the build up on the 4H time frame which can be considered as one more confluence and validation for the continuation trend.
Divergences not only signal a potential trend reversal but can also be used as a possible sign for a trend continuation (price continues to move in its current direction).
Always remember, the trend is your friend, so whenever you can get a signal that the trend will continue, then good for you!
Hidden bullish divergence happens when the price is making a higher low (HL), but the oscillator is showing a lower low (LL).
This can be seen when the pair is in an UPTREND.
Once price makes a higher low (HL), look and see if the oscillator does the same.
If it doesn’t and makes a lower low (LL), then we’ve got some hidden divergence in our hands by which we are seeing the scenario on Bitcoin's 4H timeframe chart.
I will be updating more on the overall market trend and will give a weekly analysis on the end of the weekend. For now stay safe on your trades and keep learning.
Wishing you a best weekend to have and stay blessed too.

Home Depot: 3 Rising Valleys Support w/Hidden Bullish DivergenceHome Depot has formed 3 Rising Valleys at a Support Level with the Confluence of the 200 Week SMA and Hidden Bullish Divergence. I think it could eventually break through the trend line and go up to $400

EverQuote: Hidden Divergence Partial Decline Near Bat PCZThere is Hidden Bullish Divergence as we are Potentially putting in a Higher Low Partial Decline within a Right-Angled and Descending Broadening Formation just below the PCZ of a Bullish Bat and if we breakout then the move should take us up at least about 200% from the current price level.

CFXUSD: Inverted Head and Shoulders Trading Above Old ResistanceCFX seems to be showing some bullish price action above the old resistance of $0.2488 all while forming an Inverted Head and Shoulders, confirming Hidden Bullish Divergence and holding above the moving averages on significant timeframes. The Bullish targets would probably be $0.60 then $1.64

Bearish BAMM on the 3x Bearish Return IWM Bearish ETFThe 3x Bearish Return ETF for the IWM is currently showing Hidden Bearish Divergence on the weekly at the 55-week EMA, and it looks like if this Hidden Bearish Divergence plays out we will see the ETF fall below the B point and begin to accelerate its Bearish Wave Structure which would complete between the 1.272 and 1.618 Fibonacci extensions.
This would mean that the IWM (The Russel 2000) itself would be rising.
As a result of what I see here on the chart, I may consider buying puts on this ETF, Buying IWM Calls, or just overall getting more exposure to small caps and just taking this as an overall Macro Bullish Indicator.

📊 3 Types Of DivergenceRSI (Relative Strength Index) is a commonly used technical indicator in trading that helps identify overbought and oversold conditions in the market. It measures the strength and speed of price movements and provides traders with valuable insights into potential trend reversals. When analyzing RSI, three types of divergences can be observed: regular, hidden, and exaggerated divergences.
📍Regular Divergence: Regular divergence occurs when the price and the RSI indicator move in opposite directions. There are two types of regular divergences: bullish and bearish.
📍Hidden Divergence: Hidden divergence refers to a situation where the price and the RSI move in the same direction, but the RSI signals a potential trend continuation rather than a reversal.
📍Exaggerated Divergence: Exaggerated divergence is a type of divergence where the RSI signal extends beyond the typical overbought or oversold levels. It suggests that the price is showing extreme momentum and could potentially experience a significant reversal.
In summary, regular, hidden, and exaggerated divergences in RSI analysis provide traders with valuable insights into potential trend reversals and continuations. By understanding these divergences, traders can make more informed decisions regarding their trading strategies and positions in the market.
👤 @AlgoBuddy
📅 Daily Ideas about market update, psychology & indicators
❤️ If you appreciate our work, please like, comment and follow ❤️

SOFI Hidden Bullish Divergence I think SOFI has the hidden bullish divergence on daily, it pull back fill gap and then continues go up

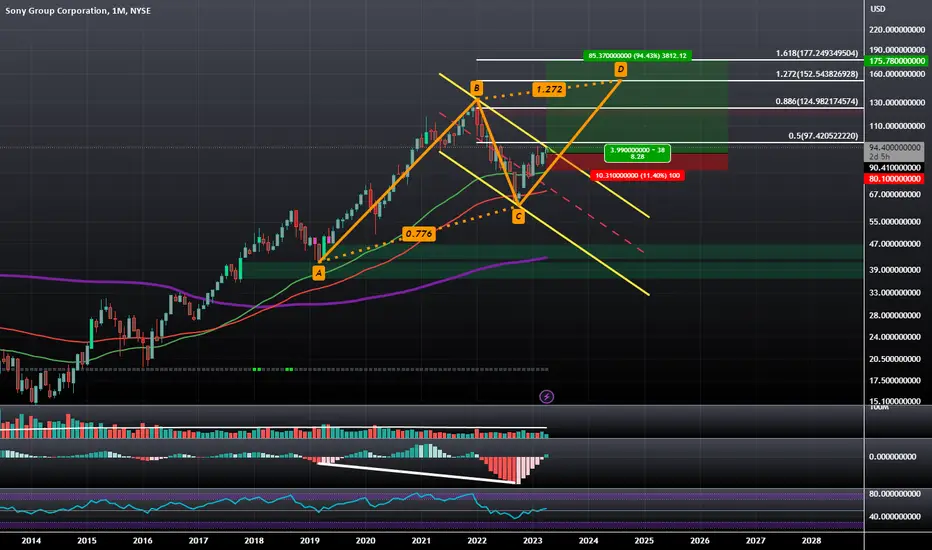
$SONY: Monthly Hidden Bullish Divergence and Channel Breakout NYSE:SONY on the Monthly Timeframe is breaking out of a Descending Channel while confirming Hidden Bullish Divergence and Bullishly Crossing over on the MACD and the RSI enters the Bullish Control Zone; the next obvious target would be between 150 and 177 Dollars as that would be the completion of an AB=CD Harmonic Pattern. One last thing to note on the side is that the NASDAQ:MSFT acquisition of NASDAQ:ATVI has recently hit a brick wall with regulators and this is likely to spur some optimism in the NYSE:SONY camp who has opposed this acquisition in fears that Microsoft would eventually make games like Call of Duty, Xbox Exclusive.
NZDUSD: Pullback Looking for Continued Hidden Bullish DivergenceThe NZD has pulled back to the POC and the 100 SMA after a previous rise that confirmed Hidden Bullish Divergence, if the NZD can continue to hold above the current level we will continue the Hidden Bullish Divergence and likely go for a Bullish BAMM type of Movement to the 0.886 or Higher

4013: Sulaiman Al-Habib (Rising Wedge Breakout and Retest)Continuously in Uptrend within Ascending Wedge
Completing several triangle targets
Recently, Breakout of Rising Wedge Top (Trendline) and Retest observed
Hidden Bullish Divergences are observed on Daily and Hourly TF
Entry at CMP with specified SL (aggressive entry)
Wait for another green candle for entry (conservative entry)
Targets are specified, ride the trend with trailing SL.

Adobe (ADBE) - Hidden bullish divergence On the chart, we can see a hidden bullish divergence. This means that the price will probably increase in the next coming period. Also, the gap needs to be filled and the earning announcement looks positive, these suggestions are in line with the hidden bullish divergence.
So an entry can be taken when the price breaks to the upside. Take your profits at the targets. All further details are shown on the chart.
Goodluck!

LKQ - Hidden Divergence - BullishOn the chart of LKQ, we can see a forming ascending triangle and we can see hidden bullish divergence on daily timeframe.
An ascending triangle is a bullish formation. The pattern gets validated when the price breaks out of the upside of the pattern.
By using the Relative Strength Index we can hidden bullish divergence.
A long position can be taken when the resistance of the triangle turns into a support.
See all further details on the chart.
Goodluck!

BATA INDIAHello and welcome to this analysis
Stock has made a bullish Harmonic Gartley and in this process has also made a double positive regular RSI divergence.
After such a sharp downfall stock has done a couple of candles in a consolidation zone and now could rally till 1600 with a smallish block near 1525, as long as it does not breach below 1380.
Good risk reward scenario at this juncture
Good luck with your investing

25K then big drop?Hidden bullish divergence is forming, with a ascending broading wadge also forming.

Hidden bullish divergence on #BTCin 2019 we had a similar situation unfold out of the bear market lows
are we repeating a similar situation
#RSI is showing lower lows along with a higher low on price
Interesting how history rhymes :)

BTC bull continuation scenario 25th of February 2023Hello my friends,
We now have a potential bullish divergence forming on the weekly chart. In order for this to be valid RSI needs to move lower and make a LL while at the same time price needs to hold a HL.
This can only be confirmed by next week's price action so no FOMO at this levels.
Happy hunting !

DYDXUSD: Diamond Consolidation with 27% Upside PotentialDYDX has shown Hidden Bullish Divergence as it consolidates in a Diamond Structure, if it plays out we may come up near $4
