Bullish Gartley at 200SMA with Hidden Bullish Divergence on 4HRWe got Hidden Bullish Divergence on the RSI at the PCZ around the 200 SMA on the 4 Hour Timeframe
Hidden Bullish RSI Divergence

TOTAL M.CAP SOON READY TO BOUNCE! MASSIVE HIDDEN BULLISH DIV. !!Hello everyone, if you like the idea, do not forget to support with a like and follow.
Welcome to this Total market cap update. Total M.cap is moving inside a channel. Looks like soon we reached the bottom and the market will start pumping.
Also, we have seen a hidden bullish divergence in the weekly time frame. That's a really massive bullish signal.
Although, we might see the last drop or some wicks below so do not get trapped. Hold your BTC and also accumulate some good Altcoins on spot.
Invalidation level:- If Total M.cap breaks below the channel then this chart becomes invalid.
If you like this idea then do show your support and hit the like button.
Also, share your views in the comment section.
Thank You!

Bitcoin's Stock to flow and Log Growth Curve suggest upside 30xBitcoin has been boring the last couple of months and has roughly gone sideways in a rather long range for the last year. The price action has been sideways some of the longer term indicators have been priming and suggest that the next move is to the upside.
The stock to flow model comes and goes in popularity with the volatility of bitcoin. When bitcoin is impulsing to the upside people pay a lot of attention to the indicator. Then there are times like we are in right now, when the stock to flow has moved but price action is still roughly sideways. I myself historically have always doubted the stock to flow but it is putting more history behind it and so it seems to be more reliable than I have previously thought.
There are several different versions of log growth curves and I find this one useful. It is subdivided into sectors and I have elected to simplify the curve by showing the top and bottom 14.59% as well as the middle portion of the band. For the last two pumps on the stock to flow bitcoin moved roughly sideways around one of the log growth bands for quite a while before pumping to target or beyond. For the last couple of months price has hopped on top of the lower band I defined and so far has done a good job of finding support.
The Log MACD histogram is beginning to approach zero and the Log MACD is turning up. The hidden bullish divergence increases the probability that we will see a sustained move to the upside. If the last two trend pumps of the stock to flow are suggestive of this next uptrend we will still have to be patience for this move to slowly pick up steam. Hopefully we will see that strength pick up over the next two-six weeks. If the stock to flow ends up being accurate will will have to get a new log growth curve.
First things first will be to see how this weekly pattern resolves. But I have seen plenty of TA around that so I won't replicate it here except to say a move to the top of the weekly keltner is likely, then retesting the horizontal level of the ascending triangle.

BTC to Russian Ruble Looking to Pump Over 40%We have an Ascending Triangle here on the weekly Timeframe and we are looking to target the 1.618 extension which would be the AB=CD BAMM Target from here upon breaking 500k. We are also showing Bullish Convergence on the MACD and Hidden Bullish Divergence on the RSI above the Breakout Point of the pattern.

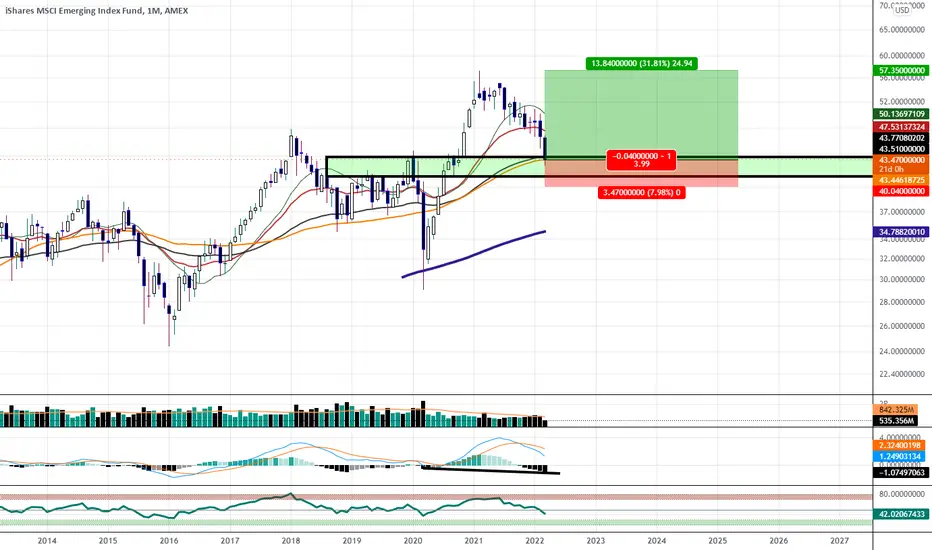
Emerging Markets ETF Showing Bullishness at SupportWe are at the 55 Month Moving Average and it happens to align with an old Monthly Resistance that we are now testing as Support; If at any point we start to rally we will have MACD Hidden Bullish Divergence Develop on the Monthly Timeframe.
DOT looking for a breakout on the weekly chart.DOT weekly chart, looking like a possible bullish
reversal. there is Hidden bullish Divergence
with the price having a higher low
and the RSI putting in a lower low.
price targets and support listed on the chart.
DeMark 9 Indicator is reading there is a 80%
probability the weekly candle has hit the bottom.

BTC daily chart still intactBTC daily chart.
As you can see, BTC is still following the Bullish
ascending channel for the last 281 days.
When the entire world keeps the narrative
that BTC has crashed to nothing, it continues to
do what the chart has been indicating...
Until BTC breaks the lower trendline, this chart
still stands very strong...BTC also continues
to show Hidden Bullish Divergence...that is where
there Price has a higher low, and the RSI has a
lower low...I believe MOST traders
and Technical Experts, continue to miss this very
important indication.
-Zoom in on the other
notes to see some of the fine analysis.

BTC 3 day chart continues to follow the bullish channel!BTC 3 day chart.
As you can see, BTC is still following the Bullish
ascending channel for the last 281 days.
When the entire world keeps the narrative
that BTC has crashed to nothing, it continues to
do what the chart has been indicating...
Until BTC breaks the lower trendline, this chart
still stands very strong...BTC also continues
to show Hidden Bullish Divergence...that is where
there Price has a higher low, and the RSI has a
lower low...I believe MOST traders
and Technical Experts, continue to miss this very
important indication.
-Zoom in on the other
notes to see some of the fine analysis.

BTC death cross technicals are playing out perfectlyBTC Daily chart
from this first Death Cross
to the bottom before bouncing
was 31 days, Now look at the second
Death Cross, the 31 days would sit on
Feb 14, 2022...thats almost perfect with
BTC trendline...lets see if History Repeats
itself. Zoom in on the chart for closer details

LINK 3 day chart looking solid!!!!CHAINLINK (LINK) 3 DAY CHART
The purple rectangle box is the
consolidation zone along with the support box.
LINK must break above the HULL SUITE Indicator
first, then move above the red line of the Bull Market
Support ribbon, to really make this chart shine to the upside.
This Chart is showing Hidden Bullish Divergence,
which means the price has a higher low, and the RSI has a lower low.
to hit those yellow dotted lines of price targets. If
it breaks those two ribbons and breaks above the white
trendline, we could have massive moves to $100-$150 this year.
Zoom in on the chart for more notes.

THETA TOKEN HAS HIDDEN BULLISH DIVERGENCETHETA TOKEN: HIDDEN BULLISH DIVERGENCE
IN THIS WEEKLY CHART. Theta has been super bullish for nearly 600 days, yes we
did see a long consolidation period, but its coming to a decision time on
the weekly chart. looking at the RSI, its about to break resistance and
remain bullish for a large move up. If history would repeat itself, look
at the projected numbers from a bars pattern perspective. Another note
is that THETA LABS is the only crypto that has the patents to expand
broadband internet. They have said to have nearly 100 patents in the
future. just looking at the chart and some fundamentals. not advice, just
charts here. If you look at what Solana has done, these #'s are possible.
look at the comments listed on the chart for more details.

Quick Update/Reminder: The Bullish USDCNH Trade is Still LiveWe are still at the PCZ of a Bullish Shark Visible on the Monthly with Hidden Bullish Divergence on the MACD; It's almost been a year since the original post and i just thought it'd be appropriate to call some attention back to this one.
If you want to see the original post it's in the related ideas section below.

Inverse Head & Shoulders on Nintendo: Hidden Bullish DivergenceNintendo is breaking through the Neckline of an Inverse Head and Shoulders pattern visible on the Daily timeframe and looks to be targeting the a Fibonacci Retrace to the upside. I will be targeting the .786 and the .886 for Profit Taking.

Bullish Divergence for BTCIt looks like BTCUSD is showing some signs of reversal from the current downward trend.
On the daily chart (left side), you can see that the price of bitcoin has migrated into a small downward channel that began at the beginning of December potentially forming a bull flag. This can further be seen as a bullish sign of reversal based on reversal bullish divergence showing on MACD (dotted yellow lines) as well as the fact that the price is approaching the 78.6% Fibonacci retracement line from the dip back in May (I generally consider the 78.6% Fibonacci level to be a "reversal level").
Furthermore, on the weekly chart (right side), the uptrend looks to still be in play, showing bullish continuation divergence on RSI (dotted yellow lines) as well as a potential ascending triangle forming if a bounce occurs here (dashed blue lines).
However, I must note that I am somewhat optimistic in this chart based on the fact that I started to draw out this channel and the trend about a month and a half ago after the recovery from the dip in early December and was a result of my noting how reminiscent this dip is of the previous dips we have seen in the upward trends from the past year. That being said, I have drawn two pitch forks on the daily chart showing that the price looks to be slightly outside of the upward trend right now and potentially could head into a downward trend. If that does occur, I caution everyone that the price could head into the downward channel back to near 27K and potentially to 16-22K afterward.
Either way, it looks to be like a key moment is approaching, with a short term potential to continue to dip near 36-37K, but a potential for some price positivity on the horizon soon.
That being said, as always, this is solely my opinion and not in any way meant as financial advice, but please like and comment if you agree or have any thoughts!

SHIBA Looking Pretty Bullish for Short to Mid termBelow are the Reasons for WHY i am Bullish on SHIBA :-
1) Massive Hidden Bullish Divergence :- As you can see in chart below, there is MASSIVE Divergence between Lowest low of Shiba to Current Recent Lows on Daily Timeframe.
2) Shiba sitting in Demand Zone & Consolidating :- Shiba is also holding its Support Zone very well and despite all ups and downs of Stock Market, it has held its' Recent Lows 10 Days ago very well.
3) Shiba Making a Falling Wedge :- Falling Wedge is a Sign of a Reversal in Trend and is a Bullish Pattern and It indicates that Shiba Might be experiencing Bullish price action for Short to Mid Term for foreseeable future.
4) Trend analysis of Shiba :- Shiba is making Lower lows and Lower Highs; but they are becoming smaller & smaller. Now Sitting on Major Support, Shiba might be making higher highs and lower lows for Short to Mid term soon enough.
5) BTC also Looking Bullish :-
Reasons for Failure of this Trade :-
1) MARKET CRASH COULD be Biggest Reason for this. :- If Russia starts fight with Ukraine then Technical Analysis won't matter and Market would straight up Dump.
There is already so much FUD in market because of FED and interest rates and 10YR Bond Yield Shooting Up.
But i do believe , they cannot afford another Market Crash and will do everything to avoid it.
If that happens and if BTC Breaks down 40k Support level then, INVALIDATION POINT/ Stop Loss and Target Price would be :-
This is not a financial advice. This is just my personal view because of which i am long.
Trade Safely Everyone.

Market Finally Making a Potential BottomThanks to FED & Jerome Powell for shaking market by its Roots and causing HAVOC in the market recently.
IF Stock Market doesn't stop here then we can well be in a RECESSION Territory after Breaking this Lower Low :-
Tightening Monetary Policy, Increasing Interest Rates, & Cutting off Asset purchases and clearing their sheet by selling Assets they are holding to increase their cash on hand.
They are pulling cash out of the system. All of this is WAY TOO AGRESSIVE approach, that market did not EXPECT from FED , for the MESS FED has created.
They just want to clean this MESS as soon as possible on cost of a Recession seems like it.
Rest, I have stated all the points in the chart.
Also, This is not a financial advice at all. In this idea, i am just sharing my view with the community.
Trade safely and watch out for next FED meeting or Jerome Powell interview.

Bitcoin : Buy the Fear & Sell The GreedBitcoin lately has been testing Patience of many traders and making holding longs way more fearful for many Traders.
I would like to Represent "The CONTRARIAN VIEW" for BTC in this Analysis.
--------------------- TWO BASIC GOLDEN MANTRA's in TRADING ---------------------
Before starting anything, I would like to discuss Two Concepts in Trading that are like Golden Mantra's or Golden Rules of Success in Trading. Those are :-
>>>>>> Buy Low, Sell High <<<<<<
OR
>>>>>> Sell High, Buy Low <<<<<<
Although, These concepts seem very simple & easy to interpret; But, These "BASIC" concepts are "EXTREMELY" hard to execute.
Some call them luck, Some call them Skill.
Some call them... Probabilities .
------------------ Social Sentiment & "BUY THE FEAR" View Explained ---------------
1) If we look at Social Sentiment & Market Sentiment, it has been bearish for last 3-4 weeks now.
From last few days, Majority of the Retailers have turned "BEARISH". & They are looking forward to sell the Rallies at this point.
2) Please Ask yourself a Question, Would whales short at this point ?
Probability is very Less that at Such good Support Level Whales would Sell their BTC and SHORT BTC.
3) Using Fear & Greed index, It can be observed that We are currently Sitting on EXTREME FEAR in Crypto Market.
So, IS IT "NOT" Supporting One of the CONCEPT GOLDEN MANTRA OF TRADING, Buy Low & Sell High ?
Also, Isn't it very LOW RISK at this level to go Long ?
---------------- My Reasons to be Bullish on BTC & Crypto Market for Short to Mid Term ------------------
1) Double Bottom :
2) 2-Day Timeframe Bullish Divergence :
3) 4-Hour Timeframe Bullish Divergence :
4) Not so Good looking Falling Wedge :-
5) Hourly Timeframe Demand Zone Retesting :
6) 8-Hour Timeframe Look on BTC :
Considering all of these Abovementioned Reasons, I, personally, am long on BTC & Crypto for SHORT-to-MID-Term.
However, if i am wrong, and then for me, Invalidation Point is 39.5-40k :
This by no means is a financial advice. This is just my personal view and despite i am right or wrong, Trading is a game of Possibilities and Probabilities.
Thus, my view is Bullish for BTC for now and for upcoming few weeks.
Market likes to teach us a new Lesson everyday. So, i am happy to be wrong if that is the case.
Rest, enjoy everyone & Trade Safely.

Hidden Bullish Divergence on USDCHF H4 TimeframeFollowing the recent strong bearish movement USDCHF have formed a hidden bullish divergence on the H4 and H1 TF. This might indicate bullish run will soon start. For now, price is testing the recent swing low (HL). If this level should hold, then we expect a break above 0.91221 which will further confirm the bullish run. Our SL is tight, placed at the recent low (0.91492) while our TP is placed around the next resistance (0.92610) giving it a 1:3.8 RR

Bullish Gartley with Bullish Divergence Visible on the WeeklyWe have Classic Divergence on the MACD and Hidden Bullish Divergence on the RSI visible on the Weekly chart at the PCZ of a Bullish Gartley.
Hidden Bullish Divergence? [SHORTTERM]Bitcoin is maybe forming a Hidden Bullish Divergence on the 4 Hourly Chart. For the Divergence to "confirm" the Price needs to stabilize on the Levels it is by now.
A further breakdown could also lead to an Exaggerated Divergence. For this to happen, the Price of Bitcoin would need to dip to 48'025$ but not below and the RSI should still move downwards. A break below 48'025$ would invalidate the Divergences.
If you like my Content, hit the 👍 and make sure to follow.
This Analysis is not intended to be investment advice. Always DYOR.

Corn: Early C Entry on Bullish ABCD BAMM to the 1.13 ExtensionCorn seems to be Breaking Out Bullishly from a Descending Channel and the Projected AB=CD move would take us to the 1.13 Retracement. We may be able to take advantage of this Projected move by Entering now on the Breakout and an attempt to capture the CD leg's Projected Move Up.
We also have a bit of RSI Hidden Bullish Divergence to back up this Potential Early C Entry.

BTC 83k in Q1 2022Bitcoin looks like it is about to enter a 3 months of bull-run. Wave theory and hidden bullish divergence on rsi with a positive overall sentiment around the world after the omicron panic indicates that bitcoin is going to have a really good quarter. My personal price estimation is close to 83k.
