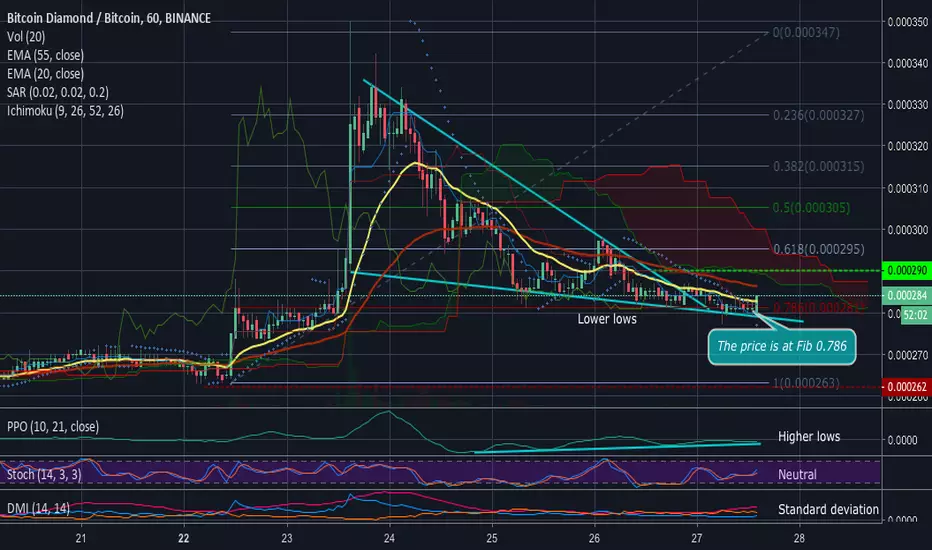
BCDBTC hidden bullish divergenceBitcoin Diamond is one of the BTC forks which can demonstrate periodical pumps and downs. Currently we see that from the previous pump the price was in corrective downtrend till the end of the triangle where it bounced and started sideways trend. The price is now at the Fib 0.786 support level and seems to be ready for another run. We see a hidden bullish divergence as PPO has higher lows while price chart has lower lows. Combining it with the triangle breakthrough, Fib retracement levels and growing volatility according to DMI we can conclude that there should be gradual or sharp rise soon
Hiddendivergence
Hidden Bearish DivergenceMomentum of 300 periods hit a trendline, exposing hidden bearish divergence. Price should be pushed down.

New Feature: Automatic divergence detection in BullFilter v1.3!With the upcoming imminent release of BullFilter 1.3 to our subscribers I wanted to highlight the new features in a series of ideas.
In trading, divergence is a concept that forms on your chart and results from the price action of a security moving in opposite direction to the indicator value.
What you need to know is that positive (bullish) divergence happens only when the securities price shifts lower while the indicator starts to rise. This indicates a weakness in the downtrend.
On the other hand, negative (bearish) divergence occurs when the securities price rises to a new high while the indicator fails to achieve the same momentum. This indicates a weakness in the uptrend.
Now since this is an automated detection, it may not signal the divergence for its entire length. You can also spot/chart divergences manually by drawing trend lines on price action and bullfillter values.
Then comparing the bullfilter value trend lines against the price trend lines to see if they diverge. An example of that is shown here
These divergences also go hand in hand with our other premier indicator . They can be used to filter out a potential long entry. I.e. do not long if a bearish divergence is present, and vice versa do not short if a bullish divergence is present.
To use this in your trading strategy, a short when bearish divergence begins/long when bullish divergence begins. The second divergence in a row is usually more accurate for a larger move. If entering a trade off the first divergence its recommended to exit it quickly and take profit.
The higher the timeframe you are on the more weight the divergence has. On sub 30m timeframes they are not particularly useful, and may signal too often or without effect.

Gold - Massive Hidden Bullish Divergence !Dear Traders,
Gold is about to make a nice move in the next month or so.
Gold's price hit an oversold point 1 week ago and the price immediately reacted with a nice bounce off creating a hidden divergence, which is very bullish.
I can say with certainty that the gold's price will go higher in the upcoming days, weeks.

NZDCHF Double ScenarioH4 - Price has reached the trend line, hidden divergence.
If we didn't get a valid breakout here, we may then expect the price to respect this trend line and move higher.
We may then start looking for buys with bullish evidences.
H1 - If we get a trend line breakout with momentum, then look for corrections and then start looking for sells with bearish evidences.

Hidden Bearish DivergenceThe RSI appears to be showing hidden bearish divergence on the hourly time-frame in comparison to the price with Lower Highs on the price (LH) and Higher Lows on the RSI (HL), which is a bearish continuation pattern. For MACD to match RSI and further confirm the divergence, I suspect we'll see one more push to the mid 20's and then a drop to either 195 or 175.
This is not investment advice. This is for educational purposes and my own edification.

CHJPY continuation of uptrend. JPY is still weak. Both week and day timeframe for CHFJPY is turned up.
Price retraced to a previous high acting as support.
We can see a bullish hidden divergence from MACD-histogram.
This trade is also traded in copy robots along with other JPY trades.

GBPCAD Sell IdeaD1 - Price is at the top of the bearish channel, hidden bearish divergence.
H1 - Bearish divergence. If the price breaks and holds below the uptrend line, we may consider this as an evidence of bearish pressure and then we may start looking for the sells.
Invalidation – If the price moves higher, breaks and holds above the previous high, then this setup will be invalidated.

BATBTC XABCD and bullish divergenceWe tracked BAT for a long time and the current moment seems to be the best to enter this position. Hidden bullish divergence is revealed due to higher lows at oscillator chart and lower lows at the price chart.
Indicators are bullish: Stoch RSI is in the oversold state, DMI shows possibility of sharp rise. Fundamentals are also great. The price is going to enter Ichimoku clouds and the pattern will be finished. Then it should reconsolidate via ladder pattern thus provide us opportunity to swing trade and rebuy lower and then it will hit the rest targets.
Free target is on the chart. Stay tuned!

Hidden Divergencepaper Trade
Hidden divergence took place, price in retracement to where hidden divergence took place, and at a flat top resistance.

GOLD OPPORTUNITIES IN THIS WEEKGold closed at $ 1204.90/oz and traded with a fairly positive price movement on trading last week, where the lowest price was still in the weekly pivot area and the highest price was in the first weekly resistance area (R1), seen also experiencing a significant price spike in Friday (8/24). The price is very strong also still maintains price movements above the pivot by closing above the weekly pivot for this week.
But there is one interesting thing here, if the gold price is unable to move up further beyond the first weekly resistance at $ 1214/oz then a hidden divergence will occur between price movements and RSI indicator. We can use Hidden divergence as a sign that the trend has not changed yet or continuation trend. Coupled with the position of the RSI indicator which is nearing the overbought area, there is little room to push the gold price further up. If the gold price does not immediately move up above the weekly resistance for this week and forms a higher high above $ 1217.20/oz then it is very likely that gold will continue go down, and break past the previous swing low at $ 1183/oz.

BTC 4HR - BEARISH HIDDEN DIVERGENCE (BEAR HOPIUM)Price makes a lower high
+
Indicator (RSI) makes a higher high
=
Hidden bearish divergence
It's some hopium for the bears after that big green candle today. Wouldn't put too much weight on it. But there it is for whatever it's worth!
Bulls aren't completely out of the woods yet.

Bitcoin Rising Wedge - Bearish Breakout soon?The bear market isn't over for me yet.
Price has formed a wising wedge in leading into an area of resistance.
The rising wedge is supported by RSI.
We also have some hidden divergence, suggesting a continuation to the downside.

short- & longterm long for XLM Stellar LumensStellar Lumens BITTREX:XLMUSD finds itself sitting in a symmetrical triangle since its alltime high on january 3rd and its pattern low on march 18th.
Let's conclude, for a valid symmetrical triangle pattern, we need to meet the following criteria:
An established trend: In our case this one is bullish
At least two lower highs and two higher lows, in order to draw trend lines which create the symmetrical triangle
Volume diminishes as the apex gets closer, on breakup we need high volume though
Pattern duration should be a few weeks to many month: This one lasts for over half a year now
The ideal breakout point occurs 1/2 to 3/4 of the way through the pattern's development or time-span: We are currently in the second half of the pattern
IF, XLM can break up of the triangle, the price target is about the size of the pattern itself from the breakout point, which leads me to the target projection at around .82 $ per XLM.
P.S.: looking at the short term 4hr chart, we can see a hidden bullish divergence on the RSI, which should at least lead us to the upper trendline of the triangle :)

AUDCHF Buy IdeaH4 - Price broke above the trend line, we may now look for pullbacks and buys.
If the price creates a hidden divergence then it would be an ideal scenario and extra confirmation.


EURCHF Sell IdeaH4 - Price is nearing the downtrend line, we also have hidden bearish divergence already forming.
H1 - We have two potential zones for reversal and continuation lower.
Invalidation: If we get a valid breakout above the H4 downtrend line, then this setup will be invalidated (false breaks can be neglected).

Looming 5K Bearish Target for BTCEver wondered why BitMEX CEO Arthur Hayes called a 5K bottom before we go moon?
Here's a reason why he could be right. A Hidden Bearish RSI Divergence just showed up which could drive $BTC further down to $5,367 before it finally moves up. Sell short after btc breaks below the resistance turned support (the thick white dotted line).
Note: Hidden bearish sign gets invalidated only if BTC price goes above 10K
Goodluck! Not a financial advise.

Stubborn Bitcoin Bear In Denial or Reading The Market Correctly?While everyone is fomoing into this bull run my broad view on the market remains bearish.
I'll break down the reasoning behind my outlook with a couple of facts.
To establish a bull market, Bitcoin needs to start making higher lows and higher highs. This is the most simple way to break down the complex price action.
So far we have seen the high at 20k, low at 6k, lower high at 12k, higher low at 6.5k, lower high at 10k, and lower low at 5.75k. Bitcoin needs to get above 10k in this bull run to change the trend of lower highs and lower lows. Anything under 10k is just another lower high and changes absolutely nothing.
Another huge red flag for the bullish outlook is the strong hidden bearish divergence. Price continues to make lower highs while the RSI is making higher highs.
I will change my outlook if the 10k level is broken with strong volume and we establish a higher low above 5.75k. Until that happens the bear market is still alive and well.

Bearish Hidden Divergence, Strong Resistance , 50 ema, 200emaSHORT after retest on top previous Resistance. Short signal supported by Bearish Hidden Divergence, Strong Resistance , 50 ema retest and below 200 ema! What Else can you ask for? lol. but remember it still a risk!!

HIdden Bearish DivergenceBe carefull out there. Im seeing a whole load of hidden bearisch divergence in the daily graph.
In my last idea I told that we could see some green movement to at least one of the trendlines formed by the triangle, but seeing this HBD makes me think that the uptrend could be over already.

Edicational Hidden Bearish DivergenceIf the indicator is higher than the previous high and the price is lower than the previous low, this is called hidden bearish divergence.

