AUD/USD LONG - HIGH PROBABILITY SETUPAUD/USD is at a monthly demand zone, there are numerous traps enticing retail traders to short. E.g. bouncing off the weekly trend line, and a so called area of resistance on the daily.
COT data also shows banks are becoming slightly bullish and reducing short positions.
A-la-la-la-le-LONG,
ah-long-long-le-long-long-LONG!
Don't short basically.
Ps. Trade prediction is not an entry yet, certain requirements still need to be met.
High

ADSK Compression at New HighADSK had a breakout last week to move above its previous all time high. ADSK is now in a compression mode, which tends to precede breakouts.

GBPCAD Short position in the making Context:
The GBPCAD dropped more than 10% from May 2019 till August 2019.
The pair then recovered almost all its losses, just over 9% from September 2019 to 1st week in December 2019.
Price:
The price is now at an historic monthly resistance level and is also struggling to totally break free out of the uptrend resistance trend line which started from a high that was formed in July of 2019.
Politics:
Price behavior imply that the pair is oversold, and a lot of weakness has already set in. Meaning, the professionals are busy building short positions at the historic resistance support line and monthly resistance level. Brexit vote today might just be the tipping point to assist the professionals with their already prepared short positions to come alive.
Action to consider:
Short positions with the necessary money management rules in place is likely to yield good results.

LTCUSD - Bounce or BustPinning the highs on a straight line against the lows oscillating around it produced this lovely, and very scary map.
What do you think? Will LTCUSD and the Altcoin market with it embrace disaster, or defy some Sine Law for a Christmas present?
I may be releasing my indicator at some point, but for now it's in beta going through some strategy testing and fine tuning.
TradingView rocks with webhooks -- if the fundamentals are there.

FMC Compression Pattern at New All-Time HighFMC is in a tight sideways formation at its new All Time High. The compression of this pattern often precedes a sudden breakout.

EURNZD Buy IdeaD1 - Price reached the important support zone. Until this support zone holds my view remains bullish.
H4 - Price respected the alternative trend line and is moving higher.
H1 - Bullish divergence, if the price moves higher and breaks above the previous swing high at 1.70421, we may then look for pullbacks and buys with bullish evidences.

LULU in Speculative Run at New HighLULU has been trending upward and gaining momentum as it enters a new all time high price level.

IDXX Breaks to the DownsideIDXX stepped down after reaching a new all time high. The stock is under moderately heavy Dark Pool Quiet Rotation™ at this time. The bottom red line indicates the top completion level support.

CHTR at New All-Time HighCHTR has moved with momentum to a new all time high. The stock is experiencing some profit-taking by Professional Traders at this time.


S&P 500, looks extended but it's about to break outThe market broke through the last high but lots of bullish volume leaders in the stock market have yet to move up from their pullbacks. Large companies like Apple and Tesla took market cap but the smaller stocks that yield higher gains haven't moved. If you look at the RSI on this trend you can see that it hasn't gone up nearly what you'd expect it to for the prolonged rise in the market. I think it's going to keep rising and it's going to close the gap on the 30 week moving average sideways instead of dropping on it. Go ahead and look at the SPGI, it has not broken through it's previous high yet and it's indicators are bullish. The global market will contribute on the rise of the S&P 500.

XAUUSD - GOLD - AIMING DOWN AFTER SH Gold is heading down after retracing from those previous highs, after grabbing orders up.

NVDA Challenging Previous HighNVDA is at a previous yearly high, with an attempt to break out and above that prior high. There has been heavy Dark Pool Quiet Rotation™, as well as Smaller Funds buying activity in recent months.

Goal and Predictions for November 2019I believe that DOGE has the potential to hit AT LEAST $0.0028 during the month of November, and I believe the low shouldn't go too far if any below $0.0024. I am looking for it to stay around $0.0026 between pops or drops. Overall, I am looking for DOGE to stay fairly bearish this month

Trading Journal on GBPJPY for intraday 29 Oct 2019Hi everyone,i try keep updating my journal analysis for better and better understanding in market behavior.
This is my analysis on Intraday for pair GBPJPY.
During Asia Session price try to test and take liquidity at highest yesterday price at 140.243 and go down for for almost 40 pips and failed to make new low which is indicate price want to retest latest high and yet failed to make new high and during London open market- seller enter market at high price and go down for 63.8 pips and reject at low monthly candle at 3 Dec 2018 at price level 139.495 and go up due to several low impact news.
Trading Conclusion
1)Price failed to make new high from previous high(140.259).
2)Price go down to take find high liquidity and reject at low monthly candle 3 Dec 2018.
3)Price will try to test new high for today at 140.300 and 140.500-140.600
4)or,Price fail to break today high and try to make new low 139.350 and 139.050
5)H4 chart shown that price failed to make new low and looking for uptrend for coming week.
Anyone feel free to comment and review my analysis for better understanding in market behavior.
Thanks for Like and comment.

JBHT Challenges Previous HighsJBHT recently formed a resting day consolidation pattern at a resistance high. The stock moved with Professional Traders momentum out of a minor correction.

SHI Long, Buy, HighMy new buy play with 1:5 R/R
This one can be one of those with huge growth potential, but...let see what next Q has to say. For now, my play will be with just 500 shr and 1:5 R/R


SWKS Developing Symmetrical TriangleSWKS shows an unusual Symmetrical Triangle formation ahead of Earnings Season. The triangle follows a failed attempt to break out above the previous all-time high.

BTC Flippening: Roadmap for 8K, 12K, and beyond.This sort of sums up all the targets being called out from on high, but in a way that combines fractal flipping, chart patterns, and waves. We were all expecting something big on September 11, but nothing happened. Or maybe BTC flipped again. The flip traces sort of a mirror image of previous prices.
Looking at a chart patterns site, it was intuitive to visualize how well the broadening bottom pattern would fit the BTC flip hypothesis. It would form a symmetrical fractal ending on December 24, repainting previous big moves in crypto. The points are not random. They fall on the Friday of each week. Why Friday? Because that's payday, when the weekend starts. Friday is the day stock options expire worthless for 90% of retail traders. It's a day when institutions have taken that money and moved markets many times before.
It seemed necessary to predict prices going low enough to take out stops, and then bouncing up for a bull trap before committing to larger down moves. Expect the unexpected in the short term. And then zoom out to see how it all fits.
Institutions and CFDs seem to enjoy painting obvious daily patterns like these on charts for their trading educators to stand on. They entice undisciplined speculators to open margin accounts for 100x wreckage on small moves. The tops and bottoms coincide with support and resistance levels extrapolated from previous price action and are not set in stone. But it would be interesting to see how many are hit.
And there is still plenty of room for doombear barts in the holiday aftermath with their jaunty 1-2K predictions.

30 Min Chart Swing Trade XBTUSDHey Peeps
I outlined the very recently formed support at around 8293-8226. We had two bounces off there. I don't see it dropping below this region and closing. The resistance is as outlined, 8429-8462. We need volume to break it. Volume is on its wayinvalidate the support/resistance. down as you can see. Play these zones with caution. Think about stop loss placement, if you place it to tight, you will be stopped out. Place it within parameters that would
I would also like to leave with a bit of advice I stumbled across. It has greatly impacted my style of trading. If you are planning to close a position because a trade isn't going your way, immediately open a trade in the opposite direction. This way, you will be able to catch market movements and be profitable. Also, you won't be too hasty to pre-emptivley close a winning position.
Note: this is the 30 min chart. You can dive further into a 15 min chart to seek more zones for scalping.
Let me know what your swing/pivot points are.


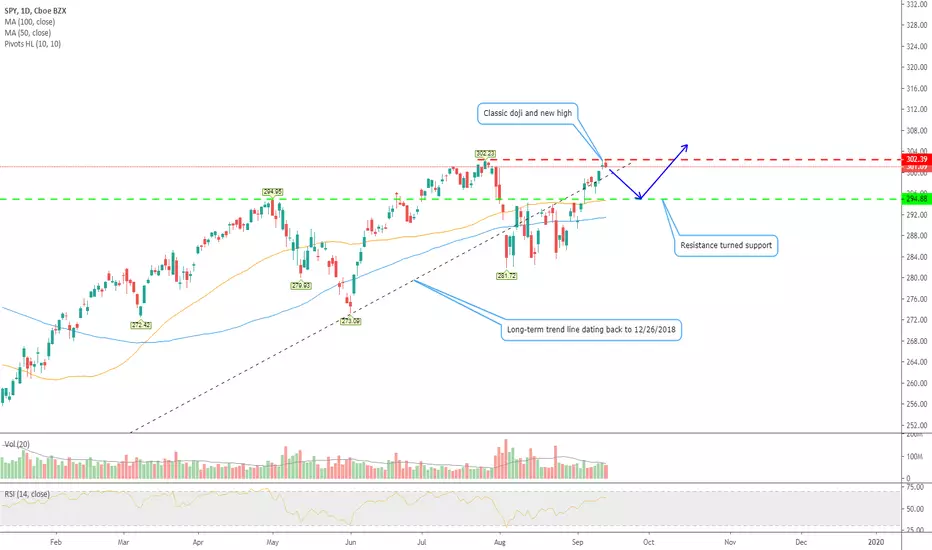
SPY - Daily - Bearish engulfing stick after dojiNotice the bearish engulfing candlestick today, after the doji yesterday? I believe that means we are going back down to retest the green line I drew in the 295 area. We just made new highs, but could not close above the highest close level set in July. I do not believe this sell-off will be anything more than simple profit taking after this nice rip up after breaking through consolidation. More or less, I think this will be just a breather ... UNLESS, negative trade war news comes out.
As always, the trade war is determining the technicals right now. If negative news comes out between now and the new round of talks in October, I think we will bust through that green line and make a move to test a double top pattern. If that happens, look out below!
I'm overall bullish based on technicals, but bearish to start next week. I positioned my account appropriately yesterday and today to survive the profit taking.