XZC/BTC FALLING WEDGE #XZC#XZC Falling wedge.
2 Patterns in play.
#Rebranding, #Lelantus, #DeFi
Pick your entry and enjoy the ride!
Higherhigh


XPTUSD Entry 937.512 Exit 1007.768 | PlatinumXPTUSD Entry 937.512 Exit 1007.768 (Parallel Channel) (Platinum)

market execution: EUR/AUD analysisAN intraday position to start the week, we can see the respective third bounce at our trendline which could be considered as price new higher low, we could now be gaging momentum for further new highs.
risk/reward ratio 1:5

BTCUSD : Higher HI - Lower LO repeating pattern ??Target somewhere around 2K? Ever around the US elections? Tell me. In my opinion, it looks real.

EURUSD Top Down analysisEurusd is in a strong uptrend on the Weekly and daily timeframes.
i am looking for a buy when price touches the weekly and daily timeframes.


NAS100USD 11568.0 + 0.73 % LONG IDEA * TREND CONTINUATIONGood Day Everyone
The Nasdaq 100 reached new heights yet again last week as stocks like Tesla , Apple and Amazon continued to build on recent gains. As a key member of the S&P 500 , Nasdaq 100 and Dow Jones, Apple is afforded considerable influence in the performance of the three major US indices and it has been soaring as of late – bolstering the otherwise lackadaisical US equity market.
*DAILY FX
www.dailyfx.com
Looking for continuation of the trend with the bulls as the INDEX is net BULLISH on higher timeframes still pushing to HH. Significant moves with the bears will change the whole trading plan.
lets see how it goes...
HAPPY TRADING EVERYONE
_________________________________________________________________________________________________________________________
ENTRY & SL - FOLLOW YOUR RULES
TP 1 - 11708.7
TP 2 - 11936.6
SL - 11390.4
RISK-MANAGEMENT
PERIOD - SWING TRADE
__________________________________________________________________________________________________________________________
If this idea helps with your trading plan kindly leave a like definitely appreciate it.

USDZAR 17.13930 - 0.69 % SHORT IDEA * TREND CONTINUATIONGood Day Everyone
A look at the DOLLAR / ZAR that has been trading in a descending channel hitting LH, LL looking for a continuation of the trend with the bears on the pair in the coming week looking for a break below support level 17.07766 trading below this level will trigger the trade and we'll be short on the pair.
we'll see how it goes...
HAPPY TRADING EVERYONE
_________________________________________________________________________________________________________________________
ENTRY & SL - FOLLOW YOUR RULES
TP 1 - 16.95705
TP 2 - 16.71227
SL - 17.34574
RISK-MANAGEMENT
PERIOD - SWING TRADE
__________________________________________________________________________________________________________________________
If this idea helps with your trading plan kindly leave a like definitely appreciate it.

Shardacrop chem forming Higher HighsShardacrop chem is continuing to make higher high and if closes above 325 level on daily basis it can rally upto 375-420 levels.

EURNZD1D is looking nice and clean ;)
4h
price action
support resistance
small short position here
what do we think?

FSLY- Down, but not out yet. UPDATELike I stated before, if price goes back above 90 and successfully retest the lvl, then bulls have the chance. If not, potential play is to build up shorts inside supply zones, then close the shorts and flip long once the price lvl is inside the buy zone.

GBPAUD Long - The Sterling is Bullish After a fake breakout of the 4hr trend line (manipulation?), I expect this pair to re-test line before continuing higher.
I would take this trade, via a buy limit order which would be placed in a confluence area with a 4hr trend line, market structure support and 50% fib level.

GBPCAD Falling Wedge Pattern indicates 17800After a fresh high price price now retracing for a higher low. Price creates a falling wedge pattern which indicates further bullish movement. Next resistance 1.7800

Is this the signal of Trend Reversal?It look like public Bank in the Reversal
From last Feb 2019, it start drop
And the downtrend is resisted by 50EMA (Expontetial Moving Avereage)
And last March 2020, it V-shape rebound and break above 50EMA
And create a "higher high" (2 times) & "higher low" (2 times).
if coming week, it trade high, not break down to the lower trendline (Blue) then, it confirm uptrend.
What is your take?

CADJPY Swing LongAfter a break and close below that was followed by a close back above and retest of lower part of consolidation channel, this pair has confirmed the fake breakout and is now well placed with an opportunity to ride the next swing leg and the creation of a higher high on the daily TF.
Target can be set at the 127.2% fib extension taken on the retracement. Entry can be taken on lower TFs

Inverse Head and Shoulder superimposed over an upward trend..Asymmetric inverse head and shoulder pattern: due to the pattern being super-imposed over a significantly upward moving baseline trend, propelled by inflation fueled by the global money printing?
Another point/consideration to add to the bullish narrative.
SEE ALSO:
BTC:USD -- Acceleration gaining, pulling up Momentum.
Determining if we are in a Bull/Bear market

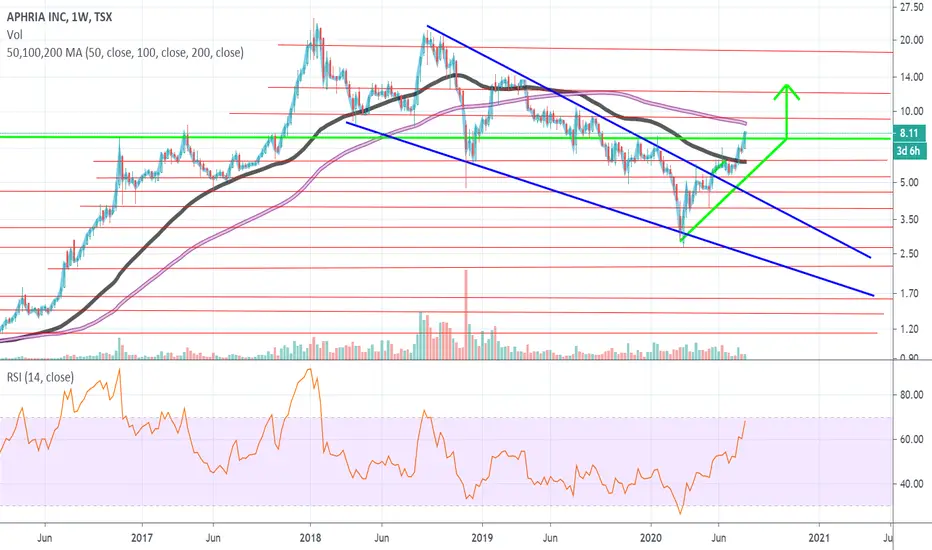
Falling Wedge breakout.APHA has broken the downward sloping resistance of the Falling Wedge pattern outlined in blue flush to the upside, and upon back testing the area of resistance it's now turned into support.
Notice the higher high creation for the first time since 2018 ATH's?
The Green pattern in this chart is an Ascending Triangle, and upon break out of this pattern APHA has created a Macro higher high.
Any pull back in APHA would need to hold either the top of the ascending triangle upon a back test, or the upward sloping green line of support if there's to be continued bullish price action.
Make It or Break it GBPJPY!!I have much fun analyzing & trading the Great Britain Pound. I'm expecting short term bullish action within the upcoming hours on GJ. Price has been moving back & forth between a 15min Uptrend Channel, while creating higher highs & higher lows during the process. I've identified a few higher lows on the chart. It's also is currently sitting above a 200 moving average after the crossover highlighted on the chart. If price break the 20 ma I set, I see it rising to the local resistance level. Nevertheless, bears could still possibly gain some momentum. I've marked my take profit area. Whats your thoughts on GJ? Love to hear your analysis & remarks!

LTCBTC Level Trade|Trend HH|S/R Flip Retest|Volume Influx|200 MAEvening Traders,
Today’s Analysis – LTCBTC breaking out of its 80 day consolidation, setting up a clear level trade.
Points to consider,
- Trend higher high
- S/R Flip Retest (Local Support)
- Immediate target (Weekly Resistance)
- Oscillators above 50
- Noticeable volume influx
LTCBTC has established a technical higher high, early signs of a trend change – this gives us an immediate bullish directional bias.
An S/R Flip retest will validate a long trade with the .618 Fibonacci as an overextension, this will solidify local support.
The Immediate target is weekly resistance, LTCBTC also has the daily 200 MA to clear, profit taking zone.
Both oscillators are above 50, not over-extended, this signals a probable further push in the market.
LTCBTC has had a strong volume influx, engulfing all previous nodes, follow through is needed for continuation.
Overall, in my opinion, LTCBTC has a valid long play. A retest of local support will allow for a defined R:R trade. Price action is to be used upon discretion.
What are your thoughts?
Thank you for following my work!
And remember,
To be a successful trader you need to trade without fear. When you use fear as a resource to limit yourself, you will create the very conditions you are trying to avoid. Or to say this in another way, you will experience your fears - Van K. Tharp

EUR/USD SHORTHello Traders !!!
I bring to you a second idea !
Take a look also on that idea posted earlier in this night that is on a small profit !
So EUR/USD hit a high from 2019 January, Risk on sentiment and economic news from Europe and USA are not good but somehow USA manage to be better than Europe.
To be honest, in those days you can buy GBP, it way more stronger than USD or EUR.
Also for those of you that have a risky appetite and make scalpping, take a short look at XAU/USD on 3 minutes TF, a nice pattern there !
For out SHORT on EURUSD, you have the TP and SL on the chart but please have patience, my POV and analyses are for a longer period of time but that get more succes ! could wait 2-3 hours until get the good part of the forex !
Please have in mind your money management system and ask for any question !
Take care and have a good day !


LINKed To The Herd Mentality?While Bitcoin and the well known alts continue to cure most trader's insomnia, Chain Link has taken the spot light. Once this alt broke out from it's previous resistance of around 5, it has been vertical. If you are new to trading, I would like to welcome you to another fine episode of the HERD mentality in action. Can this thing go to 10 over the next week? In this video I am going to provide technical levels to consider that are proportional to recent price history.
Fundamentals drive attention, that's about it. People want to hear a good story, one that is full of hope, promise and drama. The next Bitcoin! Or some other attention grabbing hype. Stories are part of human nature and are rooted in a form of logic, or cause and effect. What you may not yet realize is that timing markets has very little to do with "cause and effect" and everything to do with behavior.
Our strategy has only one objective and that is to capture short term gains that are a result of price momentum. In order to do this consistently, criteria has to be met otherwise it is outright gambling. Before we even think about assuming risk, we need to answer two questions: if we bought now, what is the probability that this momentum will continue enough to produce a positive outcome, and second, what is the reward/risk? For Chainlink, the 6.80 level is a price projection based on recent structure (emotions express themselves in patterns which can be measured). This means the probability of a retrace is greater than momentum continuing higher. Buying now is a low probability behavior which will not produce consistent returns in the long run. What about the reward/risk? At this point, the risk can be measured from the support around 5, which means you are risking about 2 to reasonably make 3, BUT since PROBABILITY does not favor the move, then WHY take any risk to begin with? The ideal situation within the rules of our strategy would be for price to retrace to the 4.80 area and present a setup. THAT is when probability AND reward/risk make a lot more sense. Will it retrace? We don't know, it is all a matter of being prepared IF such an opportunity presents itself. Consistent performance comes from following EFFECTIVE behaviors and good habits, NOT from reacting to or chasing action.
