A speculative path for BTC Price actionNot financial advice...sometimes it's fun to try to use mthe paint brush to paint a speculative path for where I think BTC price action is going just so later I can click play and see how close I was
Higherhigh

USDJPY - Trade in Trend Direction - Higher High expected Hi Traders!
The market is in an uptrend and
now it reached a strong resistance at 109.00.
It is ranging there since last week and we have to look for a breakout.
Our risk-to-reward ratio is 1 to 2.
We recommend to buy for being part of the next higher high!
Thanks and good luck :)!

AUDUSD potential for Long position(Intraday)As you can see from chart- price failed to make new Lower Low on 28 Oct 2019 and this could be starting of impulse wave for uptrend and since that price go up to make a new Higher High(HH) and Higher Low(HL) until today if u can see from H1 chart.Now price try to make new high from previous daily high on 22 Oct 2019(Box color-Turquoise).My prediction price will go up to find liquidity at high area and go down before buyer start to enter position at discount price area of 0.68600-0.68675.
As you can see from weekly trendline price will make rejection at upper trendline and need to wait for Price Action for breakout or go minor bearish trend.
This is from Daily chart and Daily chart.
Analysis:
1)based on key level from higher timeframe which is Monthly and Weekly
High on candle monthly August 2019-0.68680
Low on candle monthly May 2019-0.68649
if you can see price rejected that price and go up.
2)Based on trendline major high timeframe
3)supply and demand zone
4)High and low of major turning area.

validating the bullpennant here would give a 1day higher high!we need to break above 12.3k to confirm a higher high and ensure the bull market continues...if this is a symmetrical bull pennant we are in the breakout target is 12449! Just enough for a higher high!

AMD Forms Slip-Slide DowntrendOnce again, AMD has failed to break to a new higher high. Heavy Dark Pool Quiet Rotation™ is thwarting upside action at this time.


WMT Rises on Buybacks Despite Dark Pool SellingBuy Side Institutions using Dark Pools have been intermittently selling off blocks of WMT over the past year. Meanwhile, corporate Buybacks have buoyed price to maintain a higher high trend.

$FTM/BTC trading idea$FTM looking to retest 187 level
- 4H MACD turning bullish with a nice curve
- found strong support
- making HH,HL
- rsi is however turning overbought

BUY WTC On the Daily it looks like the the candle sticks has found new support level of $33.52, with a nice higher high action as well. The chart shows bullish trend on the daily and the weekly, with the Stoch also showing oversold.
Looking to buy above $36.

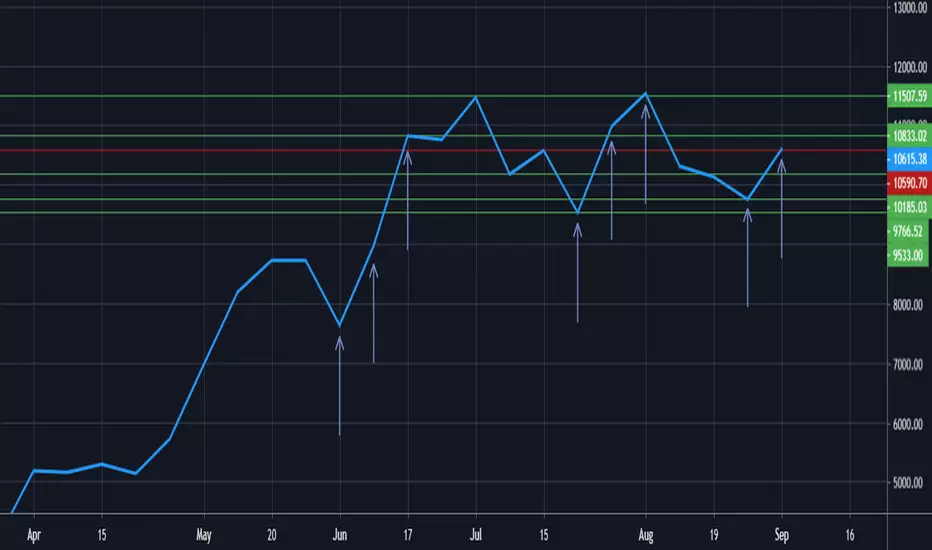
Higher Lows for Bitcoin, Can we Make Higher Highs? Good Evening Traders,
Bitcoin is looking very interesting on the weekly, just over a big resistance mark from July 15 of $10,590 at $10,615.38. Bitcoin has been following an interesting pattern in the last few months. We have seen two weeks of profit follow each low of the cycle, meaning we could see more profit in time to come. We would need to pass $11,507.59 for a higher high to follow the potential higher low at $9,766.52. I would definitely keep a tight eye on this weekly if I were looking to make any moves on Bitcoin. Feel free to compare this to a more zoomed in POV of Bitcoin on the hourly chart, along with some of my technical analysis here .
Disclaimer: This is NOT trading advice! These are merely my opinions that I have posted for you to use as one of hopefully many tools for making YOUR OWN decisions. I hope you all kill it, but I am not responsible for any financial losses. Thanks for reading!

XAUUSD educationHi Traders,
this post is an example how to trade a trending market and you can find the trend.
MA is Moving Average. I use MA8 blue, MA21 red, MA54 yellow.
Take a look of the bull flags, I have drawing this.
I wish you a sucessfull trading week.
Stefan Forex

GBJPY is aiming 135.200We have a 4H MACD divergence that formed Lower Low, and seems to be the end of that Bearish TL.
Now the price is forming Higher Lows, which can confirm that Bulls are stronger now.
I entered Bullish cause the price now is on a range above that key level, so now I'm aiming for 38.2% Fib Weekly Level.

BTC Update! Bulls give us our higher low and higher high!Love when charts go the way you anticipate or at least mostly. Last chart I mentioned I had scaled into about 80% of my position on the drop down and re-entered final 20% just over 10k on the first bounce up. Ideally I was seeking a lower high to set in around 10,500-10,900 as that would be a solid bounce and give plenty of breathing room for the bulls to then form a higher low.
Bulls finished just shy for the lower high, coming in at $10,445. Overall pretty decent tho so can't complain other than I missed my first sell to take some profit off the tabel by $30. Oh well.
From there we needed to see the bulls get their higher low compared to $9470 (our low of the pullback). They did this with a higher low at $9,740 last night. And from there we wanted to see the higher high come in compared to wherever the bulls set their lower high (as of yesterdays post we didn't have a lower high set yet as thats what I was hoping to see at 10.5-10.9k). So now that we did get the official level at $10,445. That was the lower high to beat so bulls could shift the trend back into higher lows and higher highs. The bulls did get us there today with a higher high thus far coming in at $10,539. So this isn't much of a higher high but technically is one. I'd like to see bulls give another leg up before coming back down for another higher low. This will give bulls back some control on 4 hour chart and also makes for much easier trading as traders just follow their stop losses up based on each new higher low being established.
Personally I remain in full position as I just missed my first sell yesterday (and would have then rebought on the consolidation seeking the first higher low) but since I missed it, I then raise my first sell level in anticipation of the eventual higher high (which I'm patiently waiting for another leg up to give this higher high a bit more momentum).
If bulls do trend back down that is fine and we just watch for our next higher low with $9740 being a key level to hold and $9470 being more critical level to hold. We must be cautious as 4 hour RSI has significantly cooled off now (remember the oversold 4 hour RSI is what had us begin scaling into positions initially). Also worth watching is our 4 hour EMAs I use (12 EMA currently serving as resistance and 26 EMA currently trying to give support). Overall trade is going nearly as well as one could hope for. A push for further momentum up tonight or tomorrow to really give this higher high some meaning would really help solidify the trade, allow for some profit taking to then have my personal stop loss area at about break even for the trade. Those are my favorite types of trades as they do allow for much more comfort knowing you won't lose money and it then turns into trying to maximize some profits.
Sorry for long write up. I am now out of town for the weekend so will check back in Monday or Tuesday!
Just My 2 Sats!

#bitcoin - To Be Or Not To Be?Bitcoin is trying hard to attack this higher-high resistance, it´s a fight worth some popcorn and beer ... or so. Don´t get too excited it´s NOT the time to buy right now, in case you are already long, watch your stop losses. I know some people say this was the last time we have seen $10k, I am not there yet.
Neru


EURUSD long reentryI got in this trade too early last week and NFP took me out. Original analysis is on my page but I will be looking to reenter this pair with DXY showing signs of weakness and EUR showing strength. Before entering this trade I need price to break and retest 1.1270 and the TL before looking to go long for 160 pips risking only 40. My analysis tells me price is going to create a new higher high at around 1.1450.

forexTrdr GBPAUD - MULTIPLE TAPS ON ASCENDING TRENDLINE HIGHERMorning traders
We have a clean simple trade setup on long British Pound versus Australian dollar with an ascending trendline holding after multiple taps since the start of July following a Bullish Engulfing line on the daily at end of month.
Additionally we have an ascending support on RSI and a crossover on Stochastics pointing to the support line once again holding and the pattern continuing towards high 1.80 area as the higher high and higher low pattern continues.
We are offering more 4 months free signals if you sign up via the details on our profile
Follow us on tradingview under forexTrdr to get our sample ideas free and immediately - its free to setup a profile and the charting tools and software is easier to use than Meta trader and most broker platforms.
Good luck trading
from the Team at forexTrdr

BTC Update! Bulls stay in control!
Not a ton to update here. We saw further continuation last night as we were hoping for to keep bulls happy. Ideally want to see bulls maintain 12 EMA support on daily and really even on 4 hour chart if possible. Bulls got above and stayed above 12 EMA yesterday on 4 hour chart with a test of support down at it today. Resistance from overnight is now up at $12,829 and $12,105 support on 4 hour chart. Daily chart has plenty of breathing room currently with low to hold still down at $10,761. Measured move on the sloppy inverse head and shoulders I had been watching a few days ago would give bulls a move up towards about $14,100. This would be ideal but definitely need to see more of a volume spike to start making that push.
Just My 2 Sats!

BTC Update! Bulls get their breakout! Can they follow through?Last chart I was watching the potential of an inverse head and shoulders on 4 hour chart and expecting a break by today if the bulls were going to make it happen. Pattern didn't play out perfectly as it drug out a bit sideways but the bulls finally got some volume and their next leg up. So checking back in on daily chart here, we have our higher low at $10,761 established and now a higher high compared to our high to beat which was $12,064. So bulls have regained short term control here and seeking further follow through. I remain comfortably in my latest positions and would consider scaling out a small portion if bulls give another leg up tonight or tomorrow but overall am happy with these buys and considering a longer term swing position for them. But lets be patient, see what this week brings and if bulls can get further follow through and start to push back up towards our high of 2019 and get us over $14k!
Congrats to the bulls as this pullback from the high certainly required some patience to re-establish trade positions but overall we got what we have been seeking the past several charts.
Just My 2 Sats!


APPS - DIgital Turbine -LongSmall shares d/t chopping market, will add if it goes up. Can use 5EMA for tighter stop.

BTC Update! Bulls show back up!Yesterdays chart I discussed multiple things of interest to me. Mainly we were watching the slow grind of bulls setting lower highs and lower lows on 4 hour to slowly drag price lower. As I was typing up yesterdays chart was when the bulls were showing some life and trying to shift that 4 hour trend back into the bulls favor. I discussed the low of $9651 we set which was a 30% pullback and loving if that would hold for the low and was seeking bulls to change the 4 hour chart to higher lows and higher highs to have me personally back interested in trades. Also was watching for 12 EMA on daily to see if it could now act as resistance. We saw the close of yesterdays daily candle get rejected at the 12 EMA but only for a brief period. Within 2 hours of this we saw a short 3% pullback and then the bulls were off again. Overall we now have seen a 30% pullback from $13868 high down to $9651 and then a 20% bounce back up to $11576. I have personally re-entered a partial position off two separate areas. Pullback on the rejection from 12 EMA on daily which unfortunately only filled one of my buys due to the small pullback. And my second entry this morning when we pullback to just under $11k. I have more cash aside to buy for a further pullback here if needed.
Ideal scenario from here since the bulls have set a higher high on 4 hour chart is a higher low to come in compared to $9651 and then higher high again for 4 hour. This would shift our trend back to fully favoring the bulls and can start the climb back towards $14k. US Holiday tomorrow so stock markets will be closed and shortened day today. Will see what that means for crypto market but I do expect us to trade within this range of $9651 and $13868 for multiple days now.
I do believe the bounce off $9651 was significant enough to say that is our bottom of this pullback but need a higher low and then higher high from 4 hour chart to confirm. Our bounce up to $11576 this morning would be perfectly fine to have that be our short term high of bounce and a healthy pullback just eyeballing the chart is anywhere from $10,500-11k in my opinion. Thus far we have dipped just under $11k but would be fine with a slightly lower pullback to fill last of my orders for this trade. Would also allow bulls to establish a nice healthy support level just below and above $10k. Sorry for long write up, fairly lengthy day trying to set up trade positions last night and early this morning.
Just My 2 Sats!
