NQ Power Range Report with FIB Ext - 12/20/2023 SessionCME_MINI:NQH2024
- PR High: 17034.25
- PR Low: 17020.00
- NZ Spread: 37.75
Key economic calendar events
10:00 | CB Consumer Confidence
Existing Home Sales
10:30 | Crude Oil Inventories
Continuing to lift supply
- Trading slightly above prev session high
Evening Stats (As of 12:25 AM)
- Weekend Gap: N/A
- Gap 10/30 +0.47% (open < 14272)
- Session Open ATR: 203.18
- Volume: 20K
- Open Int: 276K
- Trend Grade: Bull
- From ATH: -4.4% (Rounded)
Key Levels (Rounded - Think of these as ranges)
- Long: 17700
- Mid: 16391
- Short: 15819
Keep in mind this is not speculation or a prediction. Only a report of the Power Range with Fib extensions for target hunting. Do your DD! You determine your risk tolerance. You are fully capable of making your own decisions.
Higherhigh

USD/JPY - What would be the next direction for the pair We can observe that the USD/JPY pair has been on a bullish trend since January, reaching a retest of a 33-year high at 152.073 this month. There has been a moderate pullback to the supply zone, trendline and the EMA200. The current scenario presents possibilities for both a downside break and an upside push, with the potential to surpass the 152.073 level. The market is currently establishing higher highs, maintaining its overall bullish trajectory.

When Madras Fertilizer is set to be a quick Riser.Madras Fertilizers Limited is engaged in the manufacturing of Urea and Complex Fertilizers. It is also involved in manufacturing Bio-fertilizers and trading eco-friendly Agro Chemicals, Organic Manure, and City Compost under the brand name ‘Vijay’
The Co has proposed to set up a 20 MW gas-based power plant with Gas turbine along with Heat recovery by steam generation. It is expected to be funded through the sale of vacant Land in Guindy and Manali and the rest through internal accruals
The Co has changed feedstock from Naptha to RLNG which has resulted in reduction in the cost of production of urea.
The Co is concentrating on product diversification under which two new projects have emerged which are under the study of technical feasibility and financial viability.
Market Cap 1,216 Cr.
Stock P/E 6.56
Industry P/E 10.2
ROCE 26.8 %
EPS 11.5
EPS preceding year 10.1

📈 Analysis of AARTIPHARM: A Bullish Opportunity Awaits? 📈Hello, fellow traders! 👋
Today's spotlight is on AARTIPHARM . After closely observing its four-hour time frame, here's what caught my attention:
1️⃣ Major Trend: The stock is confidently striding in an upward direction. Each stride it takes, it glances back at its support, reassuring itself before surging upwards again.
2️⃣ Pattern Recognition: The recurring 'higher high' formation suggests a consistent bullish behavior.
3️⃣ Support Check: It's gearing up to greet its support level once again. A friendly wave or a hug? Let's find out!
4️⃣ Moving Average: The 200-day moving average is waving right at its entry price. A potential bullish beacon?
5️⃣ Upward Direction: This can be the wind beneath our trading wings, providing additional strength for our strategies.
🚀 Takeaway: All these factors hint towards a trade opportunity that we might not want to miss. But as always, tread with caution and ensure your research backs your moves.
❓ Your Thoughts: Have you been tracking AARTIPHARM? What's your take on its current position? Drop your insights below!
🔔 Stay Tuned: I'll be back with more insights and analyses. Don't forget to follow for timely updates.
Until the next trade, keep those charts ringing and strategies sharp! 📊
Warm regards,
Alpha Trading Station

CADCHF - Break of Structure 📉Hello Traders!
On The Daily Time Frame, The CADCHF Price Reached A Strong Resistance Level (0.68135 - 0.68320).
Currently, The Price Failed To Create a New Higher High.
The Last Higher High is Broken (Break of Structure).
The Support Line is Broken.
So, I Expect a Bearish Move📉.
i'm waiting for retest...
-----------
TARGET: 0.66300🎯
___________
if you agreed with this IDEA, please leave a LIKE, SUBSCRIBE or COMMENT!

AUDCHF - Break of Structure 📉Hello Traders!
On 29 Friday September, The AUDCHF Price Reached A Resistance Level (0.59166 - 0.59294).
Currently, The Price Failed To Create a New Higher High.
The Last Higher High is Broken (Break of Structure).
The Support Line is Broken.
So, I Expect a Bearish Move📉.
i'm waiting for retest...
-----------
TARGET: 0.56750🎯
___________
if you agreed with this IDEA, please leave a LIKE, SUBSCRIBE or COMMENT!

EURJPYSELL IDEANext trade where i will look for an opportunity for sell,we see a change in structure,making lh an a retest,waiting for a confirmation and break below 156.390
Happy trading everyone!

GBPJPY SHORT IDEASo this would be my next setup for this pair,going short if it breaks the low,chasing 650 pips profit,but take your own decision how long do u want to keep trade going because on daily we can spot a big rejection half move down,where price could possibly reverse,take partials or keep your sl above last hi.Happy trading everyone,september was extremly choppy,lets see how will october be.

EURUSD IDEAMy next trade will be eurusd,we see large bearish candles so sellers are in control,as pullback occurs it should show small bull candles,wait for a confirmation beafore entry.
We can se price before rejected the blue line,so bearish candles broke the lowest point.
Happy trading everyone! As always risk menagment is the key to sucess!

USDJPY IDEASo after a long time,i wanted to publish this trading idea,we see clear uptrend on a 1hr chart,but didnt manage to break hh,made hl,so now we wait for a break and retest,and of course a confirmation candle to enter a short position for around 100pips

NQ1! 100 E-mini Futures 1HNQ1! 100 E-mini Futures 1H
Signals:
1. Market structure : Higher High, Higher Low.
2. Mommentum channel PULLISH.
3. Indicator: RSI - hidden divergence RSI
4. Gap

📈 Exciting Trading Opportunity Alert! USDJPY: bull flag🚀✨Delving into the intricacies of USDJPY on the 4H TF
Take a step back and witness the grand narrative of the chart—an unwavering uptrend punctuated by calculated retracements.
Recently, a significant consolidation occurred at the pivotal 145.000 level, a strategic move accompanied by the emergence of a promising bull flag pattern. This pattern speaks volumes, reinforcing the notion of an ongoing trend.
But the real excitement? Brace yourself for the breakout! 🚀📈 The trajectory is set for a huge leg up, mirroring the upward momentum.
🌟 Now, aligning with the persistent bullish sentiment, I'm pinpointing two juicy targets: 148.000 and 150.000. 🎯
In this intriguing juncture, let's seize the opportunity to navigate the market waves, buoyed by the prevailing trend's tide.📈🌊

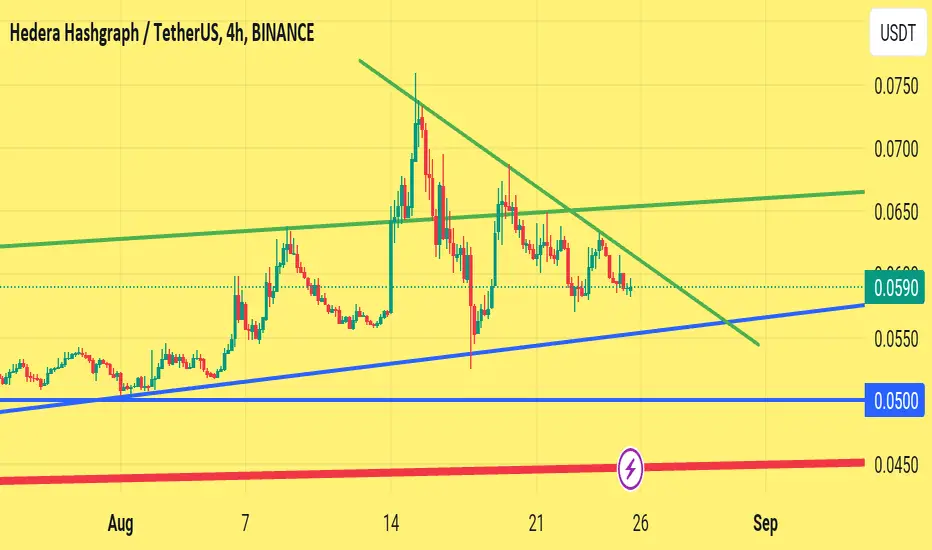
Hbar Decision time#Hbar, if it breaks any green trendline then it pump.
If it breaks any blue trendline then it will dump because a trend of higher high higher low will breakdown.
Decision time is coming soon.
havells india bullish setupHavells india
Entry point :- 1334
Stop lose :- 1240
Target 1 :- 1428
Target 2 :- 1522
Target 3 :- 1616
Target 4 :- 1710

BUY MORE ETH AT THIS ZONE AND HOLD!!!!BUY MORE ETH AT THIS ZONE AND HOLD!!!!
I will drop a lot of pictures on this to make it easily understandable
Firstly on the 3Months time frame we have an all-time high and a drop to 78.2% on Fibo which is 1054.33
then we started reversing slowly, I didn’t see it at first but then I saw it on the drop to 1364.5.
A series of HH and HL has been created; the latest one was in 1597. which is at 61.8% Fibonacci from the previous High indicating a reversal that we are seeing
So I expect that low to take out the previous high at 2145 and then find a new higher high which will be at 2449 or high to 3028 there we will see what the market will do and then see.
Check out my trade on Eth with the link

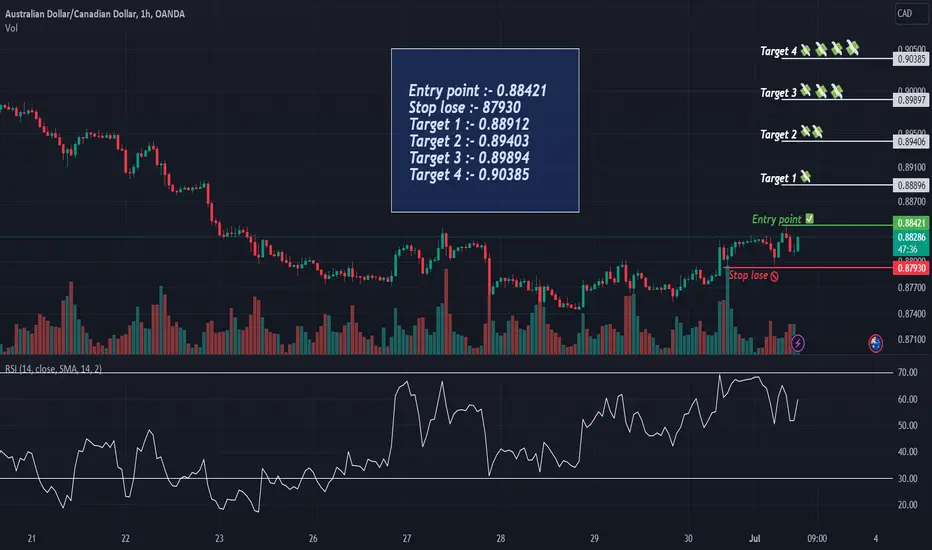
AUDCAD Bullish viewEntry point :- 0.88421
Stop lose :- 87930
Target 1 :- 0.88912
Target 2 :- 0.89403
Target 3 :- 0.89894
Target 4 :- 0.90385
usdjpy to create a strong higher highAfter earning small chips from the shorts I decided to go long and participate in the trend. This pair is still in an uptrend. The dollar is creating higher lows and structurally higher highs. I noticed a breakout of consolidation then a retest. The re-test presented a bullish reversal pattern followed by volume. I project price to push to atleast 144.808

USDJPY to create another higher highUJ is still in its major uptrend as price continues to create strong higher highs and indecision lower lows. I took a buy based on the 30min structure. My target is the next daily resistance level. I believe that buying at a higher low off of a retest is a valid opportunity. Especially after a volume bullish engulfing candle.

EURUSD to make its 4H higher highI believe the daily momentum for this pair is still bullish. The 4H retraced to the 38.2% fib and presented a Volume bullish engulfing on top of a trendline . While I do believe the Euro is getting weaker, one more higher high or bullish push would make perfect sense considering the fact that its beneath a major resistance and had been rejected there prior. Its approaching an untested breakout zone while these daily candles aren't very strong.

AUDUSD POTENTIAL FOR HIGHER HIGH!!Check the chart for the Description.
Audusd shows strong bullish momentum and pushing towards a higher high. Soon to break, wait for market to RETEST then make your decision based on the candle sticks that show

usdjpy to make a big decision todayIn the following video I've provided 3 scenarios in which I would look to take part in any trades. The first of which is quite simply a higher high will produce another higher high.
Both scenarios afterwards are reversals. If price throws indecision in the correct direction, it signals a reversal. The daily close today will suggest a lot at yesterday was relatively volatile.

AUDusd continues to make higher highsThis pair is very beautifully creating its higher highs. I was initially hesitant to go long as price was up trending however there were some bearish signals such as lack of strong bullish candles. This bullish push was made with weaker candles beneath this resistance. After a retracement, and a re-test of support, the trendline, or daily/weekly support.

USDJPY 4H Bullish ReversalI was initially under the impression that UJ might be prepared to retrace deeper. if the 23.6% fib did not hold. The Fibonacci level has held up nicely. Yesterday another indecision candle on top of support, and the 23.6%. In addition, the 4H moving average crossing to the upside, the 1H formed a higher low after forming its higher high within this range. I believe price is preparing to breakout bullish to continue its upward trend.
