$FTM/BTC trading idea$FTM looking to retest 187 level
- 4H MACD turning bullish with a nice curve
- found strong support
- making HH,HL
- rsi is however turning overbought
Higherlow

$CWBHF Is A Prime Cannabis Rebound Play$CWBHF Now Trading Above All 3 Major Moving Averages
$CWBHF is one the most well-known cannabis plays for investors.
As we look for a rebound in the sector, quality names like $CWBHF will rally first.
Charlotte's Web Holdings Inc., founded by the Stanley Brothers, is an industry-leading pioneer and the world's leading brand by market share in the production and distribution of innovative whole-plant hemp extract cannabidiol ("CBD") wellness products. Through its vertically integrated business model, the Company strives to improve customers' lives and meet their demands for stringent product quality, efficacy and consistency. Every step of the process is overseen to ensure the highest quality, from seed to self. Charlotte's Web mission is to improve life, naturally. We do this by responsibly growing our proprietary non-GMO hemp genetics on 300 acres of family farms that are made into premium, full-spectrum phytocannabinoid health and wellness products. Charlotte's Web is manufactured in a FDA-registered facility and 3rd party-verified for Good Manufacturing Practices. Charlotte's Web does not produce or sell medicinal or recreational marijuana or products derived therefrom. The Company's shares trade on the Canadian Securities Exchange ("CSE") under the symbol "CWEB".
As always, trade with caution and use protective stops.
Good luck to all!

Bitcoin: Are You Still Overlooking These Bullish Signs?Bitcoin continues to consolidate but still offers helpful clues as to the near term direction of this market. The key to utilizing these clues is in the ability to understand how they fit into the broader market context. In this article, I will evaluate these clues in light of the current market conditions and further explain how this information guides our own swing trade decision process.
Context is an intangible element that most inexperienced traders and investors completely miss. The reason is usually being too caught up in small time frames, following others who are too caught up on small time frames or not being able to differentiate between market magnitudes. Think of context like a road map, but instead of using it to plan your road trip, you decide to ask for directions at local gas stations. I know it's senseless, but people behave exactly this way with their money (ESPECIALLY in this space).
Based on our evaluation, the technical situation for Bitcoin has NOT changed since July. After the 14K peak, the major support level of 9750 has been in play ever since. Even though price tested 9K, it did not stay there for long, which again emphasizes the 9750 REGION. For those who have been following our trades and analysis know that this area represents the .382 proportion of the entire bullish swing from 3150 to 14K. In other words, this general location (context) is a place where probability continues to favor longs.
Along with this broader context, there are further supportive developments. Like the higher low formation established off the of 9800 level. And the series of inside bars which provide a specific setup to evaluate buy signals from. None of these elements guarantee that a move to the 12K area will unfold, but they do further support the bullish premise presented by the location.
This is information that the market provides, and alone is NOT enough to justify a position. People who manually enter the market because "it feels right" or because "it's good enough" are REACTING, even to their own opinions. And reacting means you will most likely get caught in noise, force trades, over trade and generate more errors than you have to. Instead of reacting, we use this information as a guide, and from there identify specific entries, stops and targets for a swing trade (which is NOT to be confused with a day trade or position trade).
Once we have our setup criteria, all we do is place the orders and then let the MARKET decide the rest. If the market taps us into a trade, then we are in a trade. Like the one we shared on Thursday that got us long at 10,275. There have been many instances when we set up these orders and the market backs away WITHOUT touching the entry price. We have prevented countless errors and stop outs this way.
This same philosophy also determines our exit most of the time. We have targets in place (below the 12K resistance) and a stop loss order. Once we are in, it is up to the market to generate the outcome of the trade, win or lose. Again, reacting to noise often leads to second guessing the trade idea, especially in this indecisive environment. The less you interfere with the trade, the better usually.
There are occasional exceptions when a specific signal appears that negates the original trade premise (before reaching the stop loss order). For example, a price break below the 10,150 level will generate a new sell signal based on our criteria. There are times when we will opt to exit for a smaller loss, or at least share the information so that participants can decide what is better for their unique situation. Is this reacting? In a way, but it still requires the market to make the first move in the form of breaking a specific price. Another way to achieve this is by manually trailing the stop loss order.
Most people want to hear about what is going to clue them into the next big move, or what the secret is to being a profitable trader. If there was such a secret, it certainly would NOT be shared freely on a public forum such as this. Timing markets successfully is about letting the market do most of the work while you focus on defining, managing and minimizing risk. In other words, DEFENSE and capital preservation lead to consistent returns over time. The reason why most fail in this game is because they focus on the obvious.
I shared what our outlook is for Bitcoin, and how we are using this information to manage our current swing trade. Our objective from the start is to keep risk within a particular threshold, and minimize it IF the opportunity presents itself. The profit targets require no attention because these are totally out of our control and dependent on the choice of the market. The root of our process is passive. What is the root of your process? (a question for today's webinar). If you don't have an answer, then you still have a lot of work ahead of you.

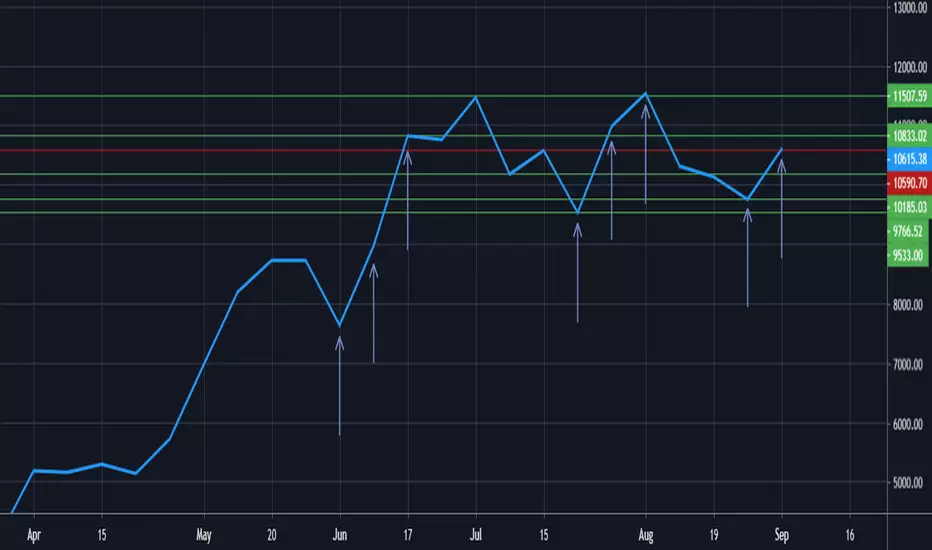
Higher Lows for Bitcoin, Can we Make Higher Highs? Good Evening Traders,
Bitcoin is looking very interesting on the weekly, just over a big resistance mark from July 15 of $10,590 at $10,615.38. Bitcoin has been following an interesting pattern in the last few months. We have seen two weeks of profit follow each low of the cycle, meaning we could see more profit in time to come. We would need to pass $11,507.59 for a higher high to follow the potential higher low at $9,766.52. I would definitely keep a tight eye on this weekly if I were looking to make any moves on Bitcoin. Feel free to compare this to a more zoomed in POV of Bitcoin on the hourly chart, along with some of my technical analysis here .
Disclaimer: This is NOT trading advice! These are merely my opinions that I have posted for you to use as one of hopefully many tools for making YOUR OWN decisions. I hope you all kill it, but I am not responsible for any financial losses. Thanks for reading!
Very low volume todaySPY volume was barely half of the daily average at close. That is VERY bad for the longs. On the e-mini: If a close below the recent pin bar happens then I believe a lower high would have been made, keeping my predictions alive. If futures dive, obviously SPY follows.

BTC Update! Bulls continue their run!Well so far this has turned into what was initially going to be a quick and small profitable trade to now being quite the run by the bulls. I remain in 50% of my position from last chart update which is now up over 10% on that. Purple lines added here outline a possible setup where BTC price is bouncing between but for now I am happily just riding the higher lows. Watching 4 hour as well as hourly chart just to give a bit tighter stop levels. Lets see what bulls can do this week
Just My 2 Sats!

XAUUSD educationHi Traders,
this post is an example how to trade a trending market and you can find the trend.
MA is Moving Average. I use MA8 blue, MA21 red, MA54 yellow.
Take a look of the bull flags, I have drawing this.
I wish you a sucessfull trading week.
Stefan Forex

USDJPY going for 108.00Price is ranging after forming first Higher Low just after it came to Stop Hunt some orders on the Monthly Key Support Level.
We can find a divergence with MACD and the EMA 50 is now forming support.
Price can come back to retest 106.00 (Monthly Supporty) just as TVC:DXY is about to do with Montlhy Resistance, and then fly for 108.00.
If it break with a strong daily or 4H candle above 106.770 (38,2) we can go Long very safe.
Patience is the Key!

BTC Update! Bulls tire out. Higher lows fail and down comes BTC!
We saw a near perfect example of traders rushing to the exits on a loss of our higher lows. Following the same stair stepping up with new higher lows each day BTC was forming. We did have a bit of a sideways action and some may have decided $10,630 was a higher low and lost yesterday with a break down to $10,555. I personally did not have $10,630 as the higher low due to price action being more sideways and not giving the typical lower high and lower low pattern on smaller time frames to confirm anything for me. $10,555 became the higher low I watch. I then set my stop loss before bed a few dollars under this level and slept comfortably knowing it was a profitable trade even if I got stopped out. I zoomed in here on 15 min chart and the yellow line indicates the higher low level traders were watching. Once we finally broke it early this morning, we saw an immediate flush down and find ourselves testing $10k.
So I am safely back to cash, profits locked up rather than holding through that drop. They don't always play out perfectly as trading does not guarantee anything. Trading is a probabilities game. And the probability of price dropping on the loss of higher lows is significant. So now we zoom out to daily chart. $10,953 is our lower high on daily. $9,470 is our must hold on daily. Anything above $9,470 will put us in an equilibrium so potential for scaling back into positions here soon for me and utilizing $9,470 as a stop loss. I'd like to see bears get one more leg down just to decrease my risk but price did bounce right off a Fibonacci line so now bulls need to prove themselves and start with some higher highs and higher lows on smaller time frames (think 15 minutes). Otherwise I'll sit patiently in cash and just wait.
Just My 2 Sats!

BTC Update! Bulls give us our higher low and higher high!Love when charts go the way you anticipate or at least mostly. Last chart I mentioned I had scaled into about 80% of my position on the drop down and re-entered final 20% just over 10k on the first bounce up. Ideally I was seeking a lower high to set in around 10,500-10,900 as that would be a solid bounce and give plenty of breathing room for the bulls to then form a higher low.
Bulls finished just shy for the lower high, coming in at $10,445. Overall pretty decent tho so can't complain other than I missed my first sell to take some profit off the tabel by $30. Oh well.
From there we needed to see the bulls get their higher low compared to $9470 (our low of the pullback). They did this with a higher low at $9,740 last night. And from there we wanted to see the higher high come in compared to wherever the bulls set their lower high (as of yesterdays post we didn't have a lower high set yet as thats what I was hoping to see at 10.5-10.9k). So now that we did get the official level at $10,445. That was the lower high to beat so bulls could shift the trend back into higher lows and higher highs. The bulls did get us there today with a higher high thus far coming in at $10,539. So this isn't much of a higher high but technically is one. I'd like to see bulls give another leg up before coming back down for another higher low. This will give bulls back some control on 4 hour chart and also makes for much easier trading as traders just follow their stop losses up based on each new higher low being established.
Personally I remain in full position as I just missed my first sell yesterday (and would have then rebought on the consolidation seeking the first higher low) but since I missed it, I then raise my first sell level in anticipation of the eventual higher high (which I'm patiently waiting for another leg up to give this higher high a bit more momentum).
If bulls do trend back down that is fine and we just watch for our next higher low with $9740 being a key level to hold and $9470 being more critical level to hold. We must be cautious as 4 hour RSI has significantly cooled off now (remember the oversold 4 hour RSI is what had us begin scaling into positions initially). Also worth watching is our 4 hour EMAs I use (12 EMA currently serving as resistance and 26 EMA currently trying to give support). Overall trade is going nearly as well as one could hope for. A push for further momentum up tonight or tomorrow to really give this higher high some meaning would really help solidify the trade, allow for some profit taking to then have my personal stop loss area at about break even for the trade. Those are my favorite types of trades as they do allow for much more comfort knowing you won't lose money and it then turns into trying to maximize some profits.
Sorry for long write up. I am now out of town for the weekend so will check back in Monday or Tuesday!
Just My 2 Sats!

Is a bottom near for Canopy Growth Corp?Did Canopy create a double top, or is the stock going to create a Macro higher low & stick in a bottom tmrw or sometime right away next week?? If Canopy doesn't take control of the market tmrw with some big news to offset the market sentiment than don't look down, in my humble opinion which is only worth a grain of sea salt from...….
Time will tell per usual.

BTC Update! Are bulls about to take a break?Wow, what an incredible 6-7 days or so for this swing trade. Those in positions have been very happy and I continue to say, Alts are NOT the place to be. I've said it multiple times over last several weeks. Alt/BTC pairings for 99% of them are just getting destroyed. USD value may be increasing on many but only because BTC is running up the price but people would much rather be in BTC than alts and enjoying much greater % gains. Ok, on to the charts.
Last chart I spoke of the 4 hour uptrend and that was my personal guide for following stop losses up. The trend continues to remain in tact and we've added a few more higher lows since last chart. Last night we laid our support at $11,565 for a higher low after rejecting from just under $12k. Still perfectly healthy as that higher low was significantly above the one below of $10,770. And then overnight/early morning the bulls made their push for $12k and got to $12,320.
This is where things became interesting. A big bearish volume push came in and dumped price back down to $11,598. This is a higher low still so bulls haven't taken a break yet but it is also the first red flag in my opinion. Increased bearish volume and essentially a double bottom attempt bulls want to hold here. 4 Hour 12 EMA is also serving as a guide and is extremely close to this higher low range currently. A solid bullish bounce here would keep our 12 EMA rising but a loss of the 12 EMA will likely also coincide with a low of the 4 hour higher lows. I have personally tightened up my stop losses yet again and really couldn't argue against anyone choosing to scale out on a bounce up back towards $12k here. Bears gave a significant pullback in a short period and bulls need to defend otherwise will risk our first red day in over a week.
Just My 2 Sats!

BTC Update! Clear uptrend for traders on 4 Hour!
Those trading have been very happy the past few days as BTC chart has been extremely nice to the technicals.
Last chart I had mentioned I didn't catch the oversold bounce opportunity initially when we went to $9100 area for a trade but had personally entered in at $9700 and was utilizing higher lows as my stop losses. At time of post that higher low was around $9800 so barely a profitable trade for me had I been stopped out but at least was now risk free. We were watching to see if $10,300s would be the next higher low and bulls did manage which allowed me to again move my SL up to higher profit. Next we have $10,572 established so have once again moved SL up and locked in about a 9% guarantee on profit for the trade. If bulls do manage to hold this next higher low and push for yet another leg up, I just continue walking the SL up to protect and guarantee a more profitable trade.
Daily chart is certainly due for some consolidation as we have 6 straight green candles now and no consolidation on daily since the $9100 level a week ago. Once the 4 hour uptrend is lost, it will have me shifting back to this daily chart to see where a potential higher low compared to $9100 would set up for another possible trading opportunity. But until that 4 hour uptrend is loss, I'll continue riding the bull move and utilizing the stop losses along the way up.
Just My 2 Sats!

BTC Update! Continued battle between bulls and bears Bulls and bears have put on quite the battle for the last 2 weeks. Last chart we sat around $9550 and I was watching our large range of $9000-11,100. 6 days later and we continue to be well within this range. I was personally looking for some oversold bounce opportunities as well as a possible flush below $9k. We did see the sell off from mid $9000's down to $9108 with a very quick rebound of 6-7% within a couple hours. Positive of this is the bulls defended the prior low of $9,071 by $37 so essentially a double bottom. We now have support building with touches at $8919, 9071, and 9108. Our weekly candle remains an inside bar with bulls last weeks high of $10,688. Most importantly to me personally is $11,112. If bulls cannot break that and set a lower high here then we will be tightening up an equilibrium pattern. We have our higher low at $9108 and then would be the lower high (anything under $11,112) on the daily chart. This could cause continued extension of the range for a while longer.
Personally I did not play the oversold bounce as was not at a computer and move was just too quick for me to get to one and act. I did personally enter a small trade position around $9700 and was utilizing $9300 range as my stop loss (more clear on hourly chart). I have since raised my stop loss to $9800s to make it a profitable trade regardless. Another leg up today or this weekend would have me moving SL up towards 10.3k assuming the pullback to $10,321 yesterday can hold today.
Alts seem to continue to struggle greatly compared to BTC which really doesn't have me interested much in anything else at this time.
Just My 2 Sats!

Bottom in? Ultra Low Cap GemSeems to be a nice spot for accumulation.
With Staking approaching this is an ideal spot to get some nim.
Great project, great team, usability smashes other coins.
Go to the nimiq website and try first
This bottom reminds me of the bottom of BTC in December before blast off, if alt season does happen, then the gains here could be huge.
Target is 30 - 50 Sats or higher.
If this goes lower, so be it, easier to accumulate.
Timescales of 3 months +
Patience is key ...

BTC Update! Lower high playing out. Mnuchin Trade opportunity!We are playing out exactly as expected off of yesterdays chart. I had outlined our box of where I'd ideally put my "bearish glasses" on and begin shorting BTC if I were a bear. I was pretty confident we'd see a lower high form compared to $11,950 and the bulls would then need to defend the low of $9857 and form a higher low in order to begin having a chance at changing this trend. I had already entered positions in low $10k and was planning to seek entry of remainder once we pulled back after our anticipated lower high was set.
We got our lower high yesterday at $11,080 and have seen a 5% pullback overnight off that with our current pullback low at $10,512. Would be great if this held as our low of the pullback but anything above $9,857 will give us a higher low.
Mnuchin Trade:
Now I did change up my strategy yesterday and made a comment in yesterdays post as Mnuchin was speaking. Those not familiar, Mnuchin is the US Secretary of the Treasury. Now I was fortunate to be able to listen live to his comments as well as be at a computer which opened me up for an interest in taking on a short term trade for a quick flip. I have outlined that in the 5 minute chart above where it was a very quick flip for profit and then back to refilling positions once our expected lower high hit and we began to pullback. With Mnuchin speaking we had a known event as it was announced shortly before that he'd speak at 2pm eastern and BTC price began to drop down. To me this was just some exiting positions in anticipation that it could be negative news. Perfectly acceptable expectation in my opinion. I was preparing with both buys on negative news (buy the dip) or buying into a pump up if news was positive or just not very negative for a quick flip of a trade. We got the latter and at 2pm Mnuchin came out and overall I'd say it was neutral comments. Essentially investors need to use caution and be educated on what they are buying into and it is highly speculative asset class and those using for illegal purposes will be caught. Overall I think that's a very fair statement regarding crypto and bulls began to step in and buy. I was with them and then immediately began scaling out of my position as I was still expecting us to form a lower high within my range since the news was not something crazy bullish that would allow us to moon shot back up. This allowed for a quick 5% flip in under an hour for profit and then reset my buys for the anticipated pullback. This is an easy example of being prepared and recognizing the news event and that often leads to some nice volatility for easy trades. I have refilled majority of the position I sold in the trade already and will hold rest for a dip closer to $10,200's just in case and ideally help bulls defend support for our higher low. If we do not dip further then no big deal and will carry on with current position in hopes bulls reverse trend and get the higher high and begin stair stepping back up.
Just My 2 Sats!

BTC Update! Bulls stay in control!
Not a ton to update here. We saw further continuation last night as we were hoping for to keep bulls happy. Ideally want to see bulls maintain 12 EMA support on daily and really even on 4 hour chart if possible. Bulls got above and stayed above 12 EMA yesterday on 4 hour chart with a test of support down at it today. Resistance from overnight is now up at $12,829 and $12,105 support on 4 hour chart. Daily chart has plenty of breathing room currently with low to hold still down at $10,761. Measured move on the sloppy inverse head and shoulders I had been watching a few days ago would give bulls a move up towards about $14,100. This would be ideal but definitely need to see more of a volume spike to start making that push.
Just My 2 Sats!

BTC Update! Bulls get their breakout! Can they follow through?Last chart I was watching the potential of an inverse head and shoulders on 4 hour chart and expecting a break by today if the bulls were going to make it happen. Pattern didn't play out perfectly as it drug out a bit sideways but the bulls finally got some volume and their next leg up. So checking back in on daily chart here, we have our higher low at $10,761 established and now a higher high compared to our high to beat which was $12,064. So bulls have regained short term control here and seeking further follow through. I remain comfortably in my latest positions and would consider scaling out a small portion if bulls give another leg up tonight or tomorrow but overall am happy with these buys and considering a longer term swing position for them. But lets be patient, see what this week brings and if bulls can get further follow through and start to push back up towards our high of 2019 and get us over $14k!
Congrats to the bulls as this pullback from the high certainly required some patience to re-establish trade positions but overall we got what we have been seeking the past several charts.
Just My 2 Sats!


BTC Update! Bulls show back up!Yesterdays chart I discussed multiple things of interest to me. Mainly we were watching the slow grind of bulls setting lower highs and lower lows on 4 hour to slowly drag price lower. As I was typing up yesterdays chart was when the bulls were showing some life and trying to shift that 4 hour trend back into the bulls favor. I discussed the low of $9651 we set which was a 30% pullback and loving if that would hold for the low and was seeking bulls to change the 4 hour chart to higher lows and higher highs to have me personally back interested in trades. Also was watching for 12 EMA on daily to see if it could now act as resistance. We saw the close of yesterdays daily candle get rejected at the 12 EMA but only for a brief period. Within 2 hours of this we saw a short 3% pullback and then the bulls were off again. Overall we now have seen a 30% pullback from $13868 high down to $9651 and then a 20% bounce back up to $11576. I have personally re-entered a partial position off two separate areas. Pullback on the rejection from 12 EMA on daily which unfortunately only filled one of my buys due to the small pullback. And my second entry this morning when we pullback to just under $11k. I have more cash aside to buy for a further pullback here if needed.
Ideal scenario from here since the bulls have set a higher high on 4 hour chart is a higher low to come in compared to $9651 and then higher high again for 4 hour. This would shift our trend back to fully favoring the bulls and can start the climb back towards $14k. US Holiday tomorrow so stock markets will be closed and shortened day today. Will see what that means for crypto market but I do expect us to trade within this range of $9651 and $13868 for multiple days now.
I do believe the bounce off $9651 was significant enough to say that is our bottom of this pullback but need a higher low and then higher high from 4 hour chart to confirm. Our bounce up to $11576 this morning would be perfectly fine to have that be our short term high of bounce and a healthy pullback just eyeballing the chart is anywhere from $10,500-11k in my opinion. Thus far we have dipped just under $11k but would be fine with a slightly lower pullback to fill last of my orders for this trade. Would also allow bulls to establish a nice healthy support level just below and above $10k. Sorry for long write up, fairly lengthy day trying to set up trade positions last night and early this morning.
Just My 2 Sats!

CTL - LongIn w/ small share size. Beginning a new trend? Nice 20 EMA slope. Decent R/R considering 200 MA as overhead ceiling.

XAUUSD (GOLD) - BULLS still in the game! $1370 on the tableExpecting bulls to keep the heavy bullish momentum going into this week.
Target - $1370 for bulls.

BTC Update! Moving along as plannedNot a bunch to update. We got the break a few days ago we had been waiting for to allow for low risk entries into BTC. We were then looking for a bull flag or perhaps a re-test of 12 EMA to see if it could once again hold as support before giving continuation. We received the re-test to exactly our 12 EMA and bulls have taken us higher again today. Traders can now utilize higher lows on 4 hour or even daily chart for stops to keep the trade in profit or opt to scale out and take some profits along the ride up. Love the low risk trade entries. I did notice some alts pulling back which should only assist BTC here as many sell into BTC from the alts. Hoping for a solid green day today and will consider locking in some profits on my personal trade.
Just My 2 Sats!
