EURAUD BUYEuraud is making higher highs and higher lows all acorss the board.
* I'm predicting Euraud to be making a new higher low
* lower timeframes 4hr to be exact has broken structure to the upside showing bullish pressure
Higherlow

GBPUSD - 2 SCENARIOS 📉📈Hello Traders !
Today, The GBPUSD Price Reached A Resistance Level (1.24980 - 1.25484)
Currently We Have 2 Scenarios:
Bullish Scenario📈
If The Price Breaks and Closes Above The Resistance Level !
We Will See a Bullish Move📈
TARGET: 1.27000🎯
Bearish Scenario📉
If The Market Breaks Higher Low and Closes Below That
I Will Sell On Retest...
TARGET: 1.22260🎯

XAUUSD - Bearish Scenario📉Hello Traders !
The GOLD Price Reached a Resistance Level (2003.916 - 2009.565)
So We Have a Bearish Scenario:
If The Market Breaks The Higher Low and Closes Below That
I Will Sell On Retest...
TARGET: 1969.000🎯

When Madras Fertilizer is set to be a quick Riser.Madras Fertilizers Limited is engaged in the manufacturing of Urea and Complex Fertilizers. It is also involved in manufacturing Bio-fertilizers and trading eco-friendly Agro Chemicals, Organic Manure, and City Compost under the brand name ‘Vijay’
The Co has proposed to set up a 20 MW gas-based power plant with Gas turbine along with Heat recovery by steam generation. It is expected to be funded through the sale of vacant Land in Guindy and Manali and the rest through internal accruals
The Co has changed feedstock from Naptha to RLNG which has resulted in reduction in the cost of production of urea.
The Co is concentrating on product diversification under which two new projects have emerged which are under the study of technical feasibility and financial viability.
Market Cap 1,216 Cr.
Stock P/E 6.56
Industry P/E 10.2
ROCE 26.8 %
EPS 11.5
EPS preceding year 10.1

EURUSD IDEAMy next trade will be eurusd,we see large bearish candles so sellers are in control,as pullback occurs it should show small bull candles,wait for a confirmation beafore entry.
We can se price before rejected the blue line,so bearish candles broke the lowest point.
Happy trading everyone! As always risk menagment is the key to sucess!

USDJPY IDEASo after a long time,i wanted to publish this trading idea,we see clear uptrend on a 1hr chart,but didnt manage to break hh,made hl,so now we wait for a break and retest,and of course a confirmation candle to enter a short position for around 100pips

NQ1! 100 E-mini Futures 1HNQ1! 100 E-mini Futures 1H
Signals:
1. Market structure : Higher High, Higher Low.
2. Mommentum channel PULLISH.
3. Indicator: RSI - hidden divergence RSI
4. Gap

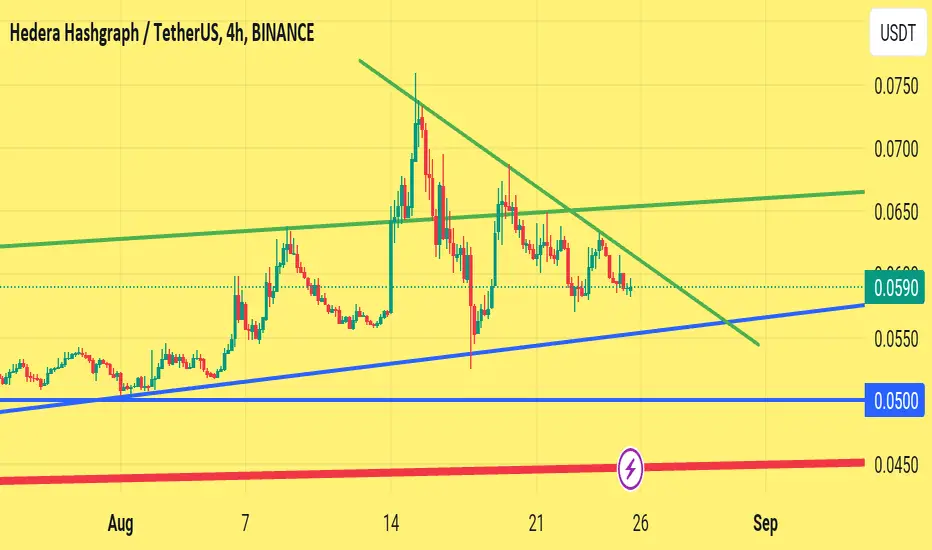
Hbar Decision time#Hbar, if it breaks any green trendline then it pump.
If it breaks any blue trendline then it will dump because a trend of higher high higher low will breakdown.
Decision time is coming soon.
SAIL-DAILY/WEEKLY/MONTHLY-BreakoutNSE:SAIL
Stock is near verge of breakout 90-91 level. It has formed a rounding bottom near support levels.
As per the weekly chart it is creating higher lows from past few weeks. Currently there is a inside candle formed in weekly timeframe. However, it needs 3 more days to get confirmed how it will appear.
I still believe that the stock is bullish above 87-86 levels. If it goes for retest, it will be good opportunity to accumulate some qty around 88.50.
We can keep SL around 85, it has potential to go upside T- 100, T2- 110.
This is only for educational purpose, please manage your risk accordingly.

CASTROLIND-DAILY/WEEKLY/MONTHLY-BREAKOUTNSE:CASTROLIND
Stock is consolidating in a channel from past 8 years. From last year it’s started to making higher low in weekly/Monthly Chart.
Monthly : As per monthly analysis stock has shown a bullish engulfing at bottom levels.
Weekly:
• June 2nd week we can see a big green candle engulfing past multiple weeks.
• June 3rd week there is rejection candle (Inverted Hammer). Things get interesting over here. The rejection candle didn’t get follow through.
• If we look carefully whole week the stock was trading between the range. July first week we can see a boom!
Daily: We can see buying from 122-123 levels from last few days and on Friday (7th July) We can see a big green candle with good volume.
It’s good time to go long for 155-160 targets.
SL: 117
I have already taken this trade.
This is only for educational purpose, please manage your risk accordingly.

HEROMOTOCORP- Daily/Hourly Timeframe-Tringle PatternNSE:HEROMOTOCO
Entire auto sector has outperformed in past few weeks, However HEROMOTOCO is looking a bit weak as per as per the daily chart, it has broke its previous daily swing low.
Stock is consolidating in tringle in hourly chart. In hourly chart buyers are trying to push price higher (Higher lows) however sellers are defending level 2840-2855.
If it breaks either side we may see a momentum, keep eye.
This idea is only for educational purpose, please manage your risk accordingly.

JSW ENERGY- Daily Timeframe-Bullish patternNSE:JSWENERGY
From March-2023 Stock is taking rejection from bottom trendline and on the upper side sellers are trying to sell it around 275-277 levels (resistance zone).
However, the swing lows are shifting up side (Higher lows) which is a sign of strength, sellers are not able to drag it below previous swing.
Currently it has taken support on the trendline 5th time and it’s near its rejection zone.
Stock has good potential to go upside in upcoming weeks.
This is only for educational purpose, please manage your risk accordingly.

Long Scalp on ETHAfter the daily made a bearish push to the downside I wanted to see how price reacted to the 38.2 prz level. on the 4H, a hammer on top of the 38.2 fib as well as support. Breaking things down to a lower timeframe I had a correction trendline drawn from the latest swing highs. Price had broken the correction trendline and began up trending on the 15min and 30min chart so i bought with my stop loss being below the 30min low. take profit at -27.% from that 38%.

Part 1 of catching a reversal is to trust structureI noticed that Ethereum was re-testing the neckline of an inverted head and shoulders pattern while at the bottom of a range and on top of support. Price provided an indecision candle on top of support as well as 61.8 fib. I anticipate that price will push back higher to retest a prz level. we have to get there first. It could begin with this purchase at a higher low.

Do you remember Yahoo!? 📈It's been a long time ago, that Yahoo had any value in browsing the internet. I don't think they are really "up to date", but from a pure technical view this long setup could work.
We've established on the weekly timeframe a clear higher low - waiting for the higher high now.

USDJPY - New Bullish MoveHello Traders👋🏻
On The Daily Time Frame The USDJPY Price Broke The Higher High
If Price Stays Above The Key Zone,
USDJPY Can Create New Higher Low and Continue The Bullish Move 📈
-----------
TARGET: 136.812🎯
___________
if you agreed with this IDEA, please leave a LIKE, SUBSCRIBE or COMMENT!


AUDCAD - New Bearish Move 📉Hello Traders 💖
On The Daily Time Frame The AUDCAD Price Reached A Resistance Level 0.91064-0.90806 !
Currently, The Price Failed to Create new Higher High 📈
If Price Stays Under The Key Zone, AUDCAD Can Continue The Bearish Move 📉
-----------
TARGET: 0.89800🎯
___________
if you agreed with this IDEA, please leave a LIKE, SUBSCRIBE or COMMENT!

What is Higher High, Higher Low, Lower Low, Lower High
In this educational article, we will discuss the foundation of price action analysis: the concepts of highs and lows.
In order to grasp that concept, you should learn to perceive the price chart as the sequence of zigzags.
Depending on the direction of the market and the shape of these zigzags, its peaks will be called differently. There are 6 types of them that you should learn to recognize.
1️⃣ Equal Highs (EH).
The peaks of bullish moves will be called equal highs, if they perfectly respect the same level (resistance), retracing from that and not managing to break above.
2️⃣ Equal Lows (EL).
The peaks of bearish moves will be called equal lows, if they perfectly respect the same level (support), bouncing from that and not managing to break below.
3️⃣ Higher High (HH).
The peak of a bullish move will be called Higher High, if the price manages to violate the previous high after a retracement.
4️⃣ Lower Low (LL).
The peak of a bearish move will be called Lower Low, if the price manages to violate the previous low after a pullback.
5️⃣ Higher Low (HL).
The peak of a bearish move will be called Higher Low if, after a retracement from the high, the price manages to set a low that is higher than the previous low.
6️⃣ Lower High (LH).
The peak of a bullish movement will be called Lower High if, after a pullback from the low, the price sets a high that is lower than the previous high.
Why these terms are so important?
Because, firstly, you can apply them to objectively identify the market trend.
Secondly, all the price action patterns are based on a combination of these highs and lows.
You should learn these terms by heart, and you should learn to perceive the price chart as the sequence of zigzags, with a strict designation of each peak.
❤️Please, support my work with like, thank you!❤️

GBPJPY - New Breakout 🔥On The Daily Time Frame The GBPJPY Price Reached a Resistance Level!
Currently, The Higher Low of The Bullish Structure is Broken (Break of Structure)🔥
The Support Line is Broken 🔥
So, I Expect a Bearish Move 📉
i'm Waiting for a Retest...
-----------
TARGET: 160.880🎯
________
if you agreed with this IDEA, please leave a LIKE, FOLLOW or COMMENT!

AUDJPY - BEARISH MOVE !On The Daily Time Frame The AUDJPY Price Reached a Resistance Level!
Currently, The Higher Low of The Bullish Structure is Broken (Break of Structure)🔥
The Support Line is Broken 🔥
So, I Expect a Bearish Move 📉
i'm Waiting for a Retest...
-----------
TARGET: 86.880🎯
________
if you agreed with this IDEA, please leave a LIKE, FOLLOW or COMMENT!


AUDCHF - Break of Structure 🔥The AUDCHF Price Reached a Daily Resistance Trend Line !
Currently, The Higher Low of the bullish structure is Broken (Break of Structure)🔥
So! I Expect a bearish move 📉
i'm waiting for a retest...
-----------
TARGET: 0.60680🎯
___________
if you agreed with this IDEA, please leave a LIKE, SUBSCRIBE or COMMENT!
