Asian Paints strong above 3170...After breaking, the resistance of 3170 Asian Paints comfortably traded at 3226.
The chart is self-explanatory.
We can see confirmation of the trend from the following points.
1) Breakout of dynamic resistance line.
2) Fibonacci level support
3) Higher Low after consecutive Lower lows.
Buying Range:3230 to 3170
Stop Loss: 3050
Expected target: 3505, 3800 to 4100.
Happy Trading
Higherlow

BTC.D Looking To Continue It's Ascent Into the 50sBitcoin Dominance showing great amounts of hidden bullish divergence here signaling that the decline in alt coin valuation towards Bitcoin may not be over yet.
On more thing to point out here is that soon we will be getting a golden cross on the daily.

LRC - Testing Resistance - Now Time for Time AwayThe BTC ATH move made for a working weekend last week. Not this weekend markets. Time to unplug. LRC testing resistance, has set it's first 4 Hour Higher Low, looking for a second in a row.
$XVS XVS/USDT LONG Trade Setup$XVS did a very deep retrace and is making higher lows now, it might be ready to go soon.
VERY volatile coin!!

My Strategy Works On All Markets and All Time FramesPrice closed above EMA 20, EMA 10, Horizontal Support Resistance, and Trend Line. A pin bar formed on the retest and the pin bar candlestick wick protruded through the support levels. The support levels are EMA 20, EMA 10, Horizontal Support Resistance, and Trend Line.
In this example, there are three higher lows moving into a diagonal resistance level and a horizontal resistance level. Price broke through those two levels and retested those levels with a pin bar. After the break and close above the horizontal and diagonal level; those levels became support.
Entry is the closing price of the pin bar. Target price is the previous swing high.

Shib - Exponential Range Expansion - New Fibbo RulerTracking the Higher Low to ATH retracement with .65 resistance on watch.

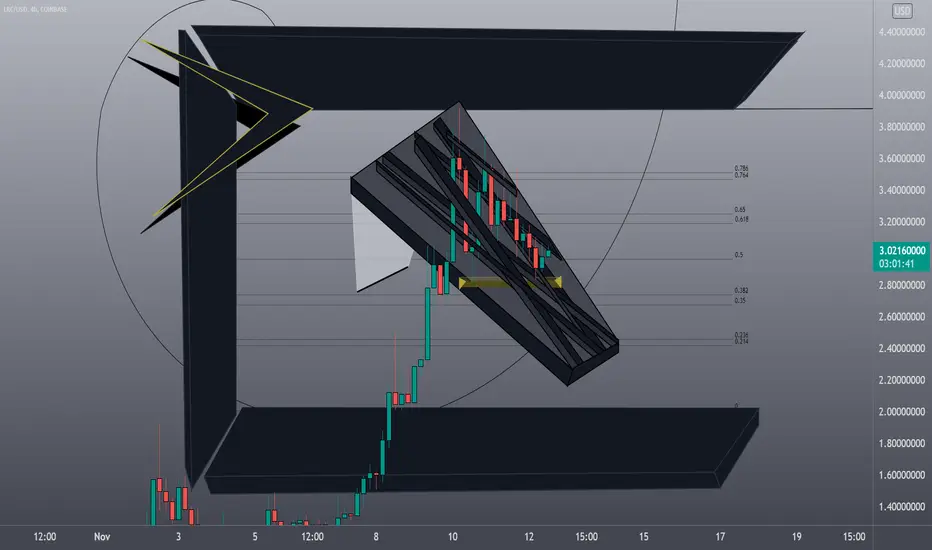
Master's way to use Fibonacci ToolHello traders and dear followers!
I have not posted any idea since the start of this month but today I am back with a powerful strategy that will help your trading easy and the strategy is also very easy to apply. It works exactly as you have ever imagined/wished that God should give you.
1. A strategy that can predict the Target perfectly.
2. At the same time strategy should predict the next drop.
3. Plus strategy should also guide you through every up and down before reaching your target. LOL
We will only use the Fibonacci retracement tool and you can select Fibonacci tool from the Tool column on your left and it's inside the third option. To make it your favorite toll hit the star button.
In this strategy, you just have to find a chain of bullish candles. A chain should be of at least 3 or more continuous bullish candles and after that look for the first bearish candle and that's the first step.
Now look at the chart it's W1 btcusdt candlestick chart. If we see from 14-dec-2020 there is a set of 4 continuous bullish candles. Start the Fibonacci toll from the bottom of the bullish candle and put '0.618' Fibonacci level at the point where the first bearish candle is closed. Now Fibonacci '0' level is your target.
We can see BTC hit the Target and then drop. It's simple as that.
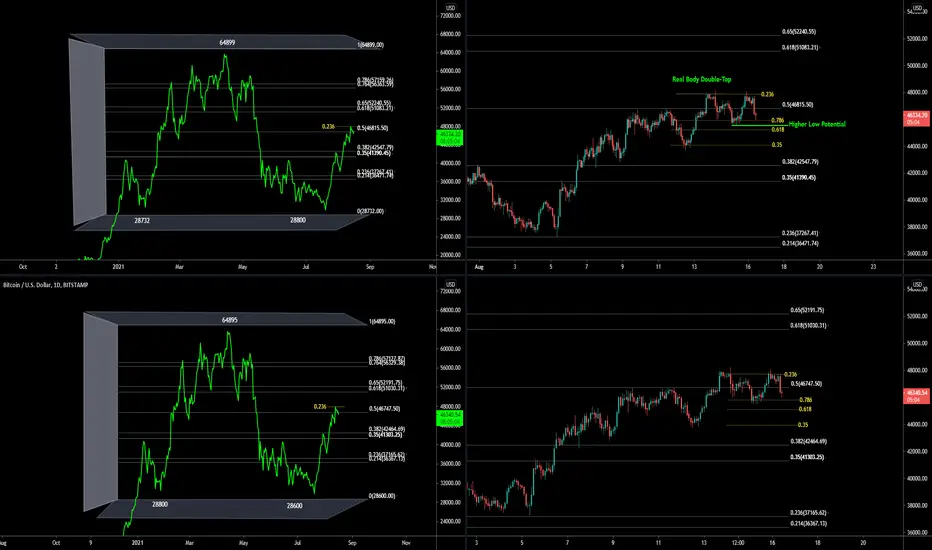
Let's move to the second example
The second example is the ethusdt D1 chart. In this chart, there are 2 examples. The first one has 4 continuous bullish candles and the second one has a set of 5 continuous bullish candles.
I started the Fibonacci Retracement tool from the start of bullish candles then set my Fibonacci '0.618' level at the point where the first bearish candle is closed and '0' is the Target.
We can see ETH has already achieved both targets.
In the first case of ETH it dropped after completing the target and the current one is still live means it is ready to drop soon.
You can use this tool in any timeframe.
At the beginning I gave 3 points and above you saw it complete target which was my first point and all dropped well after completing the target which was my second point and for the third point set these Fibonacci pairs the same way in any pair in 4hr or above timeframe than after that change the timeframe to 15/30/1hr timeframe and you will be amze to see how perfectly Fibonacci levels are respected.
If you want more just hit the like button and follow to stay connected.

Market Structure Simplified It is easy to get confused with overflowing information about market structure in the trading world.
To simplify things we have come up with a way of analysing market structure simply by marking each high or low.
In this particular example, you can see that higher lows were being created all the way down the bearish trend, so we knew that it was a seller's market UNTIL we got our break of structure .
When the BOS became apparent, we began to shift our attention to the possibility of reversals and used our magic tool, the Fibonacci.
This technique can be used in any trend, try it for yourselves!
Please, support this post with a like and comment!

A bullish flag and it's pullbacknew fantom update :
We have a nice descending flag, last night the price broke the flag, and now we're on its pullback.
This setup has an efficient risk/reward ratio.

AMC: Falling Wedge: A New Higher Low:We saw a symmetrical triangle as one of the possibility it will form. I did notify about a bearish divergence. As I expected it retrace back around $41 today. In the last 1.5 hours I was giving a glimpse of dipping red price. Is this the first sign of a falling wedge?
What I expect this week? I expect a volatile week trapping both bulls and bears. What I want to see is the price goes back to $42 trapping the bulls and then smacking down. This will confirm a falling wedge. If not it will go much higher. So if a falling wedge is to be form this and next week in the 30 min chart. I expect the new higher low to be $38 trapping the bears. Beyond that I am bullish. Anything below $37 will break this pattern.

Back above the 1 day 50ma & the mid channel trendline!We have just followed up a 1 day chart higher low with a higher high which is also a good recipe for a bullish trend reversal. Need to see a follow up additional higher low from here now to really set it in stone but it’s very possible we go all the way up to test the 1 day 200ma (in blue) before that correction down to the next higher low. The target for finally breaking above the mid channel trendline (in yellow) is the top of the channel to test the descending channel’s green top trendline. Wouldn’t surprise me if we retesting the 1 day 200ma at the same point we test the top trendline of the channel around 44k then get rejected back down for a higher low (maybe to retest the middle channel yellow trendline one last time as solidified support before finally breaking out of the entire channel). Of course there’s no guarantee of that retest it could just decide to go parabolic and blast past the channel’s top trendline upon the first retest. However odds favor an initial rejection if that trendline is double reinforced resistance with the 1 day 200ma (in blue) overlapping it. Always a chance we could see a slight correction on the way up to that top trendline first though and achieve the follow up higher low before even testing it, in which case we could correct as low as the mid channel yellow trendline imo. All in all, having this turn around occur right after amazon finally admits it’s exploring crypto for payments which we all knew they were going to eventually do, is enough of a bullish excuse to send it flying so the correction could very easily be over. I’m leaning bullish in the slightly more macro short term.Stillw ant to see that follow up higher low first though.

10 Year Note - Higher LowCatching a bid here, watching for any consequence for Tech as AMZN had it's day after good news from Consumer Spending.

Trading Idea : Buy Bajaj AutoNSE:BAJAJ_AUTO Making Higher High & Higher Low on weekly chart. Stock is suppose to bounce back from recent swing lows which is around 200 Day EMA.
We are recommending to buy stock around 3850 levels with Stop Loss of 3700 for the target of 4300 which near previous swing high.

Apple rising slowlyApple is slowly rising. It flipped a resistance to a support and it keeps going up with higher highs and higher lows.

SYK breaking out once again with higher volume!* Exceptional earnings year over year
* Very strong up trend
* Breaking out of a 4 month consolidation period with 63.09% more volume than average
* Pays out dividends with a Payout ratio of 44.50% which means that the company has a lot of room to grow further and possibly increase dividends as well!
* Probable ROI is 12.98% if the trade goes in our favor
Trade Idea:
* This is a great time to get in as it's breaking out for the second time after using the $268 area as support that made a higher low!

Bank nifty Higher High & Higher Low For Bank Nifty my personal view is long as BN above 200 EMA and Forming HH HL.

BTCUSD - Three Rising Valleys Chart PatternWill the buy signal be triggered?
Chart shows the possibility of the Three rising valleys chart pattern and it's target.

$VISL bullish run incomingBottom has formed on $VISL w/ bullish PA showing 3 higher lows.
TP levels are not 100%, but outline where I have set my long term views at. These are heavy resistance levels so I will base position decisions off of price reaction.

LONG position on NAS100I am seeing bullish price action forming on the index. Potential buy setup.
Trade with caution and risk management.
This is not a signal just my sentiment on the current price action.
God bless.

LONG position on EURUSDEURUSD broke out of the descending channel that it was trading in and is continuing the bullish path it was originally following. After the retracement to the highlighted key support level, I anticipate that a new higher low is created, confirming the bullish trend.

BTC - Daily DashboardThe .618 to .5 Channel's .236 was resistance for a real body double top on the 2 hour frame. Bulls in control until the Lower High is lost.
BTC - Searching for the Higher LowPrice did not find the higher low at the ascending Channel #2 fifty. Watching for a reaction at the .382 below if the Head and Shoulders continues to it's 100% target.

EURAUD 8 HourPrice currently is following an uptrend making higher highs & lows. Price is now at a very powerful zone making a new higher low, & momentum seems to be slowing down here. From this zone, I will be watching price action for confirmation for price to resume the uptrend for a new potential higher high next.
