ENJUSDT. One last push for the engine.Hello traders. ENJ/USDT has made another higher low and after forming a nice bullish candle triangle seems primed for one last push before correcting again. I have supplied my buy and sell zones. Good luck!
Higherlow

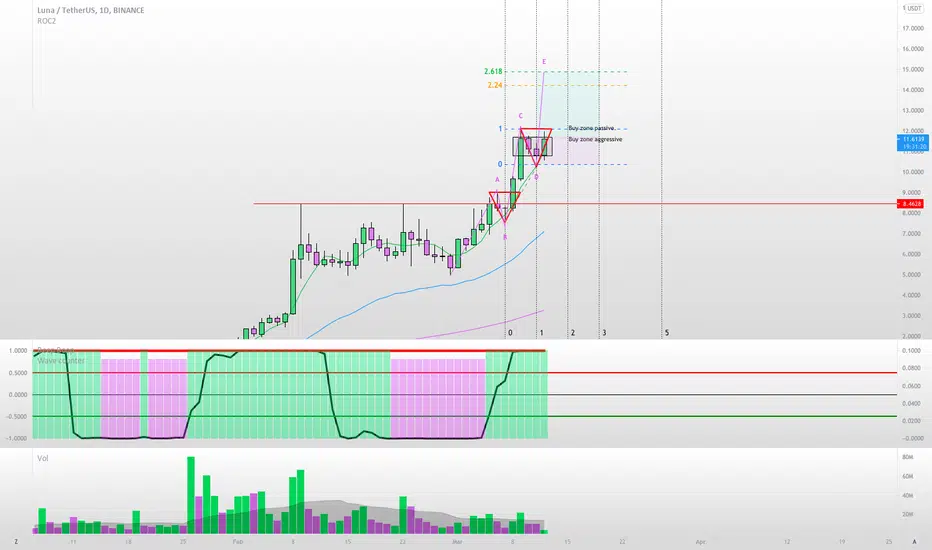
LUNAUSDT Another moon landing?Hello traders. LUNA/USDT has made another higher low and after forming a nice bullish candle triangle seems primed for one last push before correcting again. I have supplied my buy and sell zones. Good luck!
Bicoin rising wedge, 69K insightRising wedge with higher lows and higher highs.
1.9T$ stimulus passed, inflation growing, rates raised.
69K insight this month.

LONG POSITION AUD/USDClear bullish sentiment on higher timeframes (Weekly & Daily). Price attempted to pierce through support however very strong wick rejection. Expecting price to continue to rally up to 0.779 zone and push back down to form new LL. 1:5 RR

LONG POSITION EUR/USDHigher timeframe signalling uptrend pattern. HH and HL formed, however price failed to break previous HH and formed LH instead signifying a change in direction of market. Expecting price to hit around 1.204 and to form another LH and then continue to push downwards after. 1:5 RR

$ORN: More consolidation ahead? Orion protocol has been on a tear since we started talking about it a few weeks ago. It's been nailing our targets.
This post is to point out that I noticed a nice fractal that looks like it could play out if we consolidate downwards for the next few days while coiling for an explosive move up! I think the public mainnet launch will be a massive catalyst for some big moves for $ORN


EUR/USD LONGSignificant push to the uptrend with higher lows and higher highs forming. Expecting this third Higher Low to push price to resistance 1 and possibly break Resistance 2 turning it to support to form new higher high. Similar pattern on lower timeframes, H1, and M15 too.

$HEPA LongHigher low printed at the end of a long downtrend, tested diagonal resistance 3x already. Decent volume. 15% of the company purchased recently as well as insider buys. will be looking for breakout this week. Ideally not a short term trade, hope to be able to hold these shares for a while

$li - consolidating, sitting at supportexcepting a bounce here where there are buyers and breakout past the triangle trendline
also see hidden bullish divergence, declining volume, higher lows for other bullish indicators


Daily Ichimoku Support In-Play For BitcoinThe standard ichimoku cloud's kijun line (referred to as Base line in the indicator settings) is the mid-point of the high and low price over the last 26 periods.
I use Carpenoctom's modified ichimoku cloud inputs for cryptocurrencies since it is a 24/7 traded asset. The kijun shown here uses 60 periods instead of 26.
Carpenoctom has created a video series highlighting the ichimoku cloud settings in crypto, and I plan to create an update to this series over the weekend.

Helium bulls trying to confirm a daily trend change on BTC pairHelium bulls are watching this daily chart, aiming to confirm a daily trend change on the BTC pairing.

EUR/NZD down trend now LH and is going to drop to LLHi traders,
as we look at EUR/NZD, It is in an down trend and is still going down.
After the EU market opened EUR/NZD broke a bit above the trend line this is normal and prob go down, because it is in an down trend right now.
If you take the trade good you will have a 1/5 rr ratio. Still be careful I'm not responsible for your trades.
Semfttrading

NZDJPY 4H upside continuationAUD and NZD,the frontrunners of UJ seasonality have clearly signalled the commence of this season's opening bell. A bit later than usual due to economic turmoil COVID has brought upon us from March last year onwards.
Classic pullback leaving a beautiful higher low on the up trend begging everyone to hop on and go higher.
Correlates with other UJ seasonality oppos.

Apple - Fibonacci and Higher Lows at Retracement LevelsApple had a solid run over the summer, well really from April to July.
The past few weeks APPL has been trending down but when we zoom out to the weekly time frame we can identify that APPL is still in an uptrend.
It continues to make Higher Lows.
It is above the Exponential Moving Average.
We can also take a look at the Fibonacci Retracement which I find really interesting.
After the stock split, it retraced to the 78.6% level where it found support and made a Lower High in October before dropping to the 61.8 level and finding support.
It bounced and found resistance at the 38.2% level and dropped finding support at the 50% level today.
This seems to be a very bullish pattern and I think we will reach an ATH within the next few months.
The swing trade looks very doable.
Please let me know your thoughts.
Disclaimer: I am not a financial advisor. This is not financial advice. This is not trading advice. This is purely for educational purposes only.

WKHS Possible ReversalAppears to be in an island reversal. Watching for a breakaway gap from the box. Additionally, it appears the top of the box is a key level of previous support and resistance ($22.90 ish), with swing lows getting higher. My entry will be a gap up from this level with significant volume or after the break of resistance with a pullback to the $22.90 level confirming support.
Beware: WKHS is burning through cash and needs to raise again. Any bullish run will be a quick trade for me. A pump leading to an offering sounds realistic.

$MDLZIts possible $MDLZ will fall before going up. Possible double top forming and "IF" price does fall its possible price can drop forming a higher low possibly overall forming an ascending triangle

PEN $297 Target (30%+ Gain Opportunity)PEN is on an upward trend as seen with the three sets of Higher Highs and Higher Lows.
We are in the midst of the 3rd "Higher Low" right now. It will likely fall somewhere around here, so right now is the perfect entry point.
I set a Stop Loss around $183.55 because this is the low point of the previous "Higher Low." If the price falls below this point, the upward trend will end and the pattern invalidated. When we begin progressing towards the target, I will move my Stop Loss to be breakeven.
I've used the previous bull runs as a measure for predicting this next one. They estimate the target to be around $310-$320 before there is a new "Higher Low." To be safe, I've placed my target at $297 (before the psychological resistance of $300).
I am unsure whether I will take some profits at $297 (and leave most of it in) or if I will take it all out. Theoretically, a surge past $300 could create an opportunity for an even bigger bull run, but if it rejects off of $300, it could potentially end the upward trend.


HDFC LOOKING GREAT FOR BUYRSI Took Support at Resistance
ADX start rising
Broken major resistance and tested twice
making higher high and higher low

NASUSD100A simple, yet powerful 'Break and retest strategy' alongside 'correction' moves make, for me, the best confluence one can have.
Clean naked chart, Market structure and Price Action, baby!
Buy Bias, after break of previous structure low.

$A Attempting to Bottom$A has had a great run and finally is pulling back a bit for buyers to get back on board. This pullback will likely be defended much more aggressively if buyers can press through the high again and form either a higher low reversal or a lower low trap reversal.
