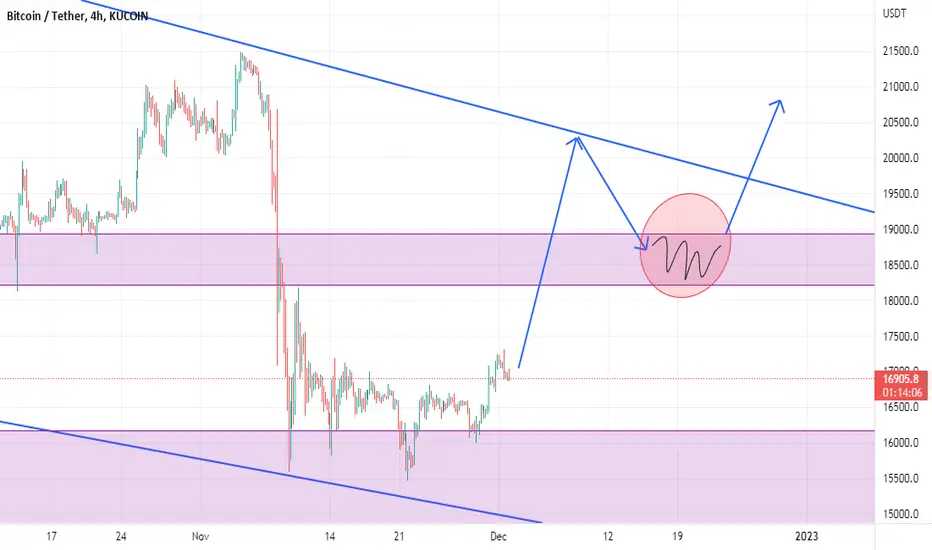
BTC will crazy uppreviously the speech of the powell has been made a really serious dump on the DXY rates so in that case BTC has broken the strong trend line which is made it dump.so in that case we could expect rejection higher on btc/USDt then create new movement .Also now it is in monthly resistance so we could expect a rejection higher as support become resistance.overall its bullish .
Highprobability

EURUSD Long term viewOn daily, EURUSD shifted it's structure. As a result we have two POI's from where the market can again continue to go bullish considering the fundamentals. Pay careful attention to the annotations made on the chart.
Happy trading
Team Lamda

HTF direction LTF execution Hello traders
-In this example, we have explained the high probability setup after a reaction from a strong supply zone.
- Here, we have an entry after the reaction from the supply zone, which we will break down in detail in the following steps;
1) We can see that the price is in a downtrend, and supply has full control.
2) The price moves towards the supply zone, and make liquidity
3) In one move, the price picks up liquidity, and we see a good reaction from the supply zone.
4) An impulsive reaction from the supply zone tells us that we have a strong supply zone and we can expect a downtrend
5) After the reaction from the supply zone, we see a nice momentum, and then the price starts to pullback to our entry.
6) The price creates liquidity, that's another positive confirmation we see here.
7) We currently have everything we want to see, and the price from our entry is expected to continue impulsively towards the downtrend
- It is very important to read the PA in detail in order to understand the psychology behind the PA and to more easily recognize your high probability setup.
-Other people do not look at the market the way we do. They do not look at everything in detail. They don't know that this is necessary because if they do not understand the language of the market, they will have a lot of problems.
-It is hard, it requires time and hard work, and you need to be eager and well disciplined.
-Once we learn the language of the market and the way it communicates with us, we will always be able to understand what the market is saying to us.
- Don't forget to leave a like, if you have any questions, write us below in the comments.

AUDJPY - Short - TP - 92.10AUDJPY is highly volatile these days , however it is expected to fall to 92.10.
Entry - 93.20
TP -92.10
SL - 94.03
Max Risk - 5% of Capital.

EUR/USD where to from here?With termoil on the side of the dollar, a Federal Reserve who continues to show signs of stronger policy moves and major economic data yet to come for the U.S this week, can the Euro continue to gain traction?
The euro has broken in to possibly form a new acending channel. Will we see we see further gains ?

High probable Sell ConditionsAs the DXY kept dropping lower, Stock Indices such as the Dow and the SPXUSD kept rallying higher as expected. From my weekly forecast I expect the DXY to rally once more taking out the current swing high on the overall daily timeframe, and as expected, Both US30 and the SPXUSD indicating bearish confluence factors (such as bearish cracks in correlation, Bearish turtle soup conditions). Therefore, for the upcoming weeks we're most likely going to trade to that 3491.3 level. This is the highest probable scenario amoung others (because there's always more than one possible outcome).

DXY Momentum Shift.Hello Traders!
Here we can see DXY is clearly not breaking swing highs.
It not looking to seek buy side liquidity above swings highs.
Instead we can see price seek sell side liquidity below swing lows.
We also can see here on the daily a swing low is broken and price follows with a lower swing high forming
(High probability scalp model in play).
I would like to see price seek equilibrium of its monthly range it is trading in currently.
Swing highs are broken are going to be seen as turtle soup situations.

US30 Wednesday Long. Overall direction bullish.firstly, once price reaches below asia highs, we can expect it to trade back into the 50% level of the 15M bullish OB before reversing and expanding higher hitting Tuesday highs and reaching for that red highlighted level. But before hitting Tuesday highs there's a high probability we might retrace a little bit during the New York Open Session. Providing further opportunities to join in on the overall bullish movement.

DOW JONES INDUSTRIAL Major Level here! The Dow Jones Industrial Average Indice is seeing a major runup the past few weeks since the beginning of October.
The Dow has seen record gains of 17% since its bottom in Early October.
The Dow is now running into some big-time resistance... That is our focus today to dive in to.
The 30 companies pushing the Dow up may be becoming overbought indicated from RSI and other oscillators.
TrendLine 1
But what we're looking at is the Dow's trendline analysis. We are seeing a Long Time Resistance Line Dating back actually all the way to 2008 guiding as a mean resistance point being touched now again! This marked 'Blue' Line represents that resistance and the Dow is approaching and testing that level now. A Rejection could lead to a selloff, if History Repeats and Dow does not want to head higher at this time.
OPINION : Dow will only break this trendline if looking to really meltup or erase losses and hit All Time Highs. If this is not the case yet, I do not see this breaking upwards at this level.
TrendLine 2
This Trendline has lasted and been intact since the kickoff of the 2022 Bear Market.
We have seen numerous Retests and Rejections of this Resistance Line, and we are now testing this again.
We have YET to break through this barrier, as it guides the market lower & lower.
Again The Dow will need major buying to break thru these levels, as massive resistance is present.
OPINION : Same as above, I can only see a break upwards if buyers really believe Dow is going back to ATH or erase gains in a massive market melt-up
Contrarian to my Writing : This article mainly features idea of a rejection, but one thing that particularly makes me more bullish on Technicals here is that the S&P / NASDAQ have yet hit their own bear market trendlines and this could rally the market up higher to those areas. If this happens, it is likely the Dow follows this movement somewhat, and could see a break above.
Something to keep note of!!!

Here's Why Marvell is a Great Investment OptionMarvell is a semiconductor company headquartered in Sunnyvale, California. It designs and manufacturers standard digital and mixed-signal integrated circuits solutions for various applications across multiple end markets. Marvell has been a steady performer in the semiconductor industry, with its stock price rising by almost 95% last year alone. It is also one of the most cost-effective micro-electro mechanical systems (MEMS) manufacturers with an exceptionally high return on equity.
Marvell is a Diversified Company
Marvell is a diversified company with a range of products across multiple verticals and applications. Its core business is semiconductor design and manufacturing, with its product lines also including storage, cloud infrastructure, wireless, wired connectivity, and industrial IoT. Marvell is also a diversified geographically, with a presence in North America, South America, Europe, Asia, and the Middle East. This diversification, along with its balanced product portfolio, makes Marvell a strong investment option. Marvell's diversified business model and product portfolio help to sustain its revenue stability, cash flow, and profitability through cyclical downturns in specific industries. In addition, a balanced geographic presence helps to reduce the risk of a single-market setback, such as a trade war, or a currency fluctuation.
Marvell has an Exceptional Return on Equity
A key indicator of a great investment option is its ROE, which is calculated by dividing the net income by the total equity on a company's balance sheet. Marvell's ROE is exceptionally high at 25%, which is one of the highest in the semiconductor industry. This high figure shows that Marvell is able to generate a lot of cash from its equity capital through its operations. This shows that Marvell has a very strong business model and can be expected to generate consistent growth in its stock price over the next few years. ROE is a great metric to identify strong investment options because high figures indicate that a company is able to tap equity at low cost. This means that the company has a strong business model and can grow its equity without taking on a lot of debt. This makes Marvell a great investment option as it can sustain high returns without compromising on its financial health and other metrics such as asset turnover ratio and profit margin.
Marvell is a Solid ROIC Company
ROIC is a metric used to determine the financial health of a company and its ability to generate a consistent return on investment for its shareholders. It is calculated by dividing the company's net operating profit by the equity on the balance sheet. Marvell's ROIC is high at 36.77%, which is one of the highest in the semiconductor industry. This means that Marvell is able to generate a large amount of cash from its operating activities and is able to sustain its operations without external financial assistance. A company can generate a higher ROIC by reducing its cost of operations. Marvell has been able to maintain a low cost of operation through its innovative manufacturing processes and cost-saving initiatives. This has led to an increase in the company's net operating profit and a high ROIC. This makes Marvell a great investment option as its high ROIC shows that it has a strong business model and can be expected to generate consistent returns for years to come.
Marvell Holds Strong Partnerships with Big Brands
Marvell is partnered with leading technology and semiconductor companies to design and manufacture its products. The company's partnerships include Wistron, Intel, Samsung, Microsoft, and Huawei. These partnerships make Marvell's products more marketable and ensure its customers are well-served. This significantly reduces the risk of a decline in Marvell's stock price as the company's customers are less likely to switch to another vendor. These partnerships also enable Marvell to share best practices and learn from its customers to refine its products and services. This is expected to enable Marvell to sustain its growth rate and profitability. This makes Marvell a great investment option as its partnerships are expected to generate higher returns and minimize the risk of a decline in its stock price.
Marvell's Shrink Manufacturing Processes
Marvell has been at the forefront of the semiconductor industry through its innovation in the manufacturing sector. The company has pioneered the use of the shrinks manufacturing processes, making it more cost-effective and efficient than its competitors. This has allowed Marvell to expand its product portfolio and diversify its customer base. It has also allowed Marvell to increase its profit margins and sustain its growth rate over the years. This makes Marvell a great investment option as it is expected to generate higher returns and expand its customer base as its products become more cost-effective than its competitors.
Marvell Has Been a Solid Performer in the Semiconductor Industry
The semiconductor industry is a volatile one that is subject to market conditions and economic conditions such as economic growth, inflation, interest rates, and political developments. Marvell has been a steady performer in this industry, with its stock price rising by almost 400% in 2020-21. This makes Marvell a great investment option as it indicates that the company has been able to sustain its profitability through these volatile conditions and generate consistent returns. This is expected to increase the company's stock price and sustain its profitability over the next few years as well.
Marvell's Balance Sheet Looks Strong
A company's balance sheet is an indicator of its financial health and its ability to generate cash flow. Marvell has a strong balance sheet, with a debt-equity ratio of 0.7, an asset turnover ratio of 1.39, a profit margin of 15.67%, and a free cash flow of $460 million. This makes Marvell a great investment option as the company can sustain its operations without external financial assistance and generate cash flow to repay its debts.
An Excellent Track Record of Acquisitions
A key metric that indicates a company's ability to expand its business is its ability to make strategic acquisitions. Marvell has an excellent track record of acquisitions, with the last acquisition being Nautics to expand its presence in the cloud infrastructure sector. This makes Marvell a great investment option as its acquisitions have allowed the company to diversify its product portfolio and expand its customer base. This is expected to generate higher returns and sustain the company's profitability.
Solid Free Cash Flow
Free cash flow is a metric used to determine the profitability of a company. It's calculated by deducting the operating expenses, such as the cost of goods sold, and financing expenses, such as interest on debt, from the company's revenue. Marvell has a high free cash flow of $460 million, which is expected to increase as the company continues to grow its revenue.
Conclusion
Marvell is a diversified company, Marvell has an exceptional return on equity, Marvell is a solid ROIC company, Marvell holds strong partnerships with big brands, Marvell's shrinks manufacturing processes, Marvell has been a solid performer in the semiconductor industry, Marvell's balance sheet looks strong, and Marvell has an excellent track record of acquisitions. In short, Marvell is a great investment option and is expected to generate consistent returns over the next few years.
Free Cash Flow
Valuation Metrics
EPS Estimates & P/E
MRVL Financials

8 Reasons Why Medtronic is a Great Investment OptionMedtronic is a medical device company that focuses on research, development, manufacturing, and distribution of various medical devices. The company has grown rapidly in the last few years thanks to its strong performance and focus on innovation. In this article, we will discuss why Medtronic remains a strong investment option with a promising future ahead.
Reasons to invest in Medtronic
The strong financial position of Medtronic is one of the main reasons to invest in it. The company’s debt-to-equity ratio is below 1.0, which means that its debt is well below its equity base. This is an important ratio to watch as an investor, especially if the company is heavy on debt – as that indicates that the company may run into trouble in the future especially in times like these where interest rates are going up. The company’s return on equity (ROE) is consistently above its cost of equity, which means that it is earning much more than its shareholders could expect in a risk-free investment. Similarly, Medtronic’s debt-to-asset ratio is below 40%, which shows that its debt is lower than its assets. This is important to look at when evaluating a company’s financial position, as it indicates the company is mostly likely to be able to pay back its debt even in a worst-case scenario.
Strong Financial Position
Another factor to consider when evaluating a company’s financial position is its liquidity. Liquidity is the ability of a company to quickly turn its assets into cash if needed. When it comes to Medtronic, the company has enough liquidity thanks to its cash on hand, cash from operations, and other short-term investments that can easily be turned into cash. Similarly, Medtronic’s current ratio (the number of current assets compared to current liabilities) is above 1.0, which indicates that the company has enough current assets to meet its current liabilities. This ratio is important to look at because it indicates whether or not a company can meet its short-term obligations while also pursuing long-term goals.
Strong Track Record of Growth Through Acquisitions
Medtronic has a strong track record of growth through acquisitions, having acquired dozens of companies in its history. This is important to watch out for when investing in a company – especially if it has a history of poor acquisitions. This can lead to lost capital for investors as well as a company that is unfocused. However, the acquisitions Medtronic has made have all been successful and focused around the company’s core business. This has allowed Medtronic to offer a wide range of products around the world while also keeping its R&D focused on the most important innovations.
Integration of CareLink with Guardian 2 platform
Another example of a successful acquisition is when Medtronic purchased CareLink in 2015 for $250 million. CareLink is a company focused on creating remote patient monitoring solutions that are designed to help patients manage chronic diseases at home. Following the acquisition, CareLink was integrated into Medtronic’s Guardian 2 remote care platform, which connects patients and doctors while also allowing patients to monitor their own health. This represents a huge opportunity for Medtronic as it expands its remote monitoring capabilities. This is especially relevant as more and more people are living with chronic conditions that require consistent monitoring. This is expected to lead to a huge opportunity for remote monitoring solutions in the future.
Solid Return on Investment for Medtronic Investors
When looking at the company’s return on investment (ROI), it is important to note that this is a long-term number. This means that you want to see a high ROI, but this number is not as important as a company’s short-term numbers. However, when it comes to investment, the long-term numbers are actually more important than the short-term numbers. The short-term numbers are important because they indicate how strong of a short-term investment a company is. The long-term numbers are important because they show the potential for long-term growth.
Solid Base of Popular Brands/Products for Medtronic
Another important factor to look at when evaluating Medtronic is its core products and brands. These are the products and brands that define Medtronic as a company, and they are what has helped the company grow over the last few decades. These products/brands can give us insight into Medtronic’s future plans, because the company has to consistently update and improve these products to meet consumer demand.
Medtronic is venturing into the artificial intelligence space
One of the biggest trends in the medical device industry is the adoption of artificial intelligence (AI). AI can be used to help medical devices better understand their environment and collect data/information on patients while also allowing them to communicate with other devices. This can be extremely helpful in the medical device industry, especially when it comes to remote monitoring solutions – which is an area in which Medtronic is already growing. One of Medtronic’s key acquisitions in recent years was HealthMine, which is a company focused on the AI space within medical devices. This acquisition could allow Medtronic to significantly expand its AI capabilities and help the company keep up with the latest trends in its industry.
Financials
EPS
Dividend Yield %
Valuation Metrics
Summing up
There are many reasons why Medtronic is a great investment option. The company has a strong financial position, a strong track record of growth through acquisitions, an integration of its CareLink acquisition with its Guardian 2 platform, a solid base of popular brands/products for Medtronic, and Medtronic is venturing into the artificial intelligence space. These are all reasons to invest in Medtronic because they show a strong future ahead.

ACC LTD Life Time High Breakout with Round Bottom Formation.*ACC LTD*
Time Frame: Weekly
Observation:
* Parallel Channel Breakout on Daily Time Frame.
*Rounding Bottom formation.
*Life Time High Breakout on Weekly Time Frame.
Resistance/Target: 2987 3352 3717 3943
Support: 2394 2087 1900

Royal orchid hotels ltdRoyal orchid hotels ltd good for swing trading
breakout on weekly chart
volume high on daily chart
Buy 272
1st target 329
2nd target 385
sp 211
⚠️ Important: Always maintain your Risk & Reward Ratio.
✅Like and follow to never miss a new idea!✅
Disclaimer: I am not SEBI Registered Advisor. My posts are purely for training and educational purposes

Trend Following SystemIt's a simple bearish trend following system, going to meet with its supportive zone. "1Day" time fram is used here.
#trading #systemtrading #trendfollowing #tradingforlife

Eur/Chf looking like the start of a reversal to the upsideThe start of the reversal to the upside, Please let me know in the comments what you think.


H4 TA analysis of the current situation with two options ahead Daily:
We have a not clear downtrend, almost empty area below 8.50. Next serious support is 7.40
H4:
Downtrend for 5 days (-23%), accumulation for 13 days with further bearish breakout. At 8.6 - new accumulation.
After false breakout, no high correction, 3rd bar after FB is "stop bar". Next bar in bearish. reached 80% H4 ATR for 3 hours.
It seems that shorts are nearby, but we have to be sure, that other scenario is cancelled. The best short signal for us will be small bars (H1-H4) in yellow box, just above the 8.5 line.
Tp is 3-5% above the 7.40

SOBHA LTDBollingerband open indicate high volatile
Inside bar breakout which indicate trend will continue

EUR/AUD: Higher high mit heavy VolumeEUR/AUD: Higher high mit heavy Volume
- overaching upward trendchannel
- break of bearish pullbak
- POC high volume below current price
- Break of Structure & Change of Character
For more content watch my last 3 streams:
⚜️ 5 Step Wall Street Analysis
www.tradingview.com
⚜️ Multiple Timeframe Analysis
www.tradingview.com
⚜️ Fixed Range Volume Profile
www.tradingview.com
Meikel & Team WSI

When in Doubt, ZOOM OUT!!!This week can play out big for Bitcoin!! If support holds we can run to $47K.
FOLLOW ME FOR WEEKLY UPDATES!!!

Litecoin continues to gather momentum to the upside.Following on from the LTC/BTC trade I posted a few days back. I believe we are seeing a building of momentum to the upside. Examining the daily candles, we are seeing continuous strong green candles. I believe that this is a great consolidation zone to accumulate litecoin cheap.
Although not financial advice the way I have undertaken this trade is using Binance cross 3x LTC/BTC. This is one of my strongest conviction swing trades at present. I believe the underlying risk to the downside is limited to a low risk level. With large upside if this trade is undertaken and pushed by larger market actors.
Litecoin also has a significantly lower market cap than most cryptos being pushed in the market.

Falling wedge on DAX Hello Traders
On weekend I published this idea first. Now the price formed a falling wedge and is now at the resistance from last week lows. The Traders Dynamic Index is bearish too.
If the price break through the wedge support plus the 38.2 fib level there will be a good chance that it will go further down to the 50 fib level maybe till 61.8 level.
Good Trades
