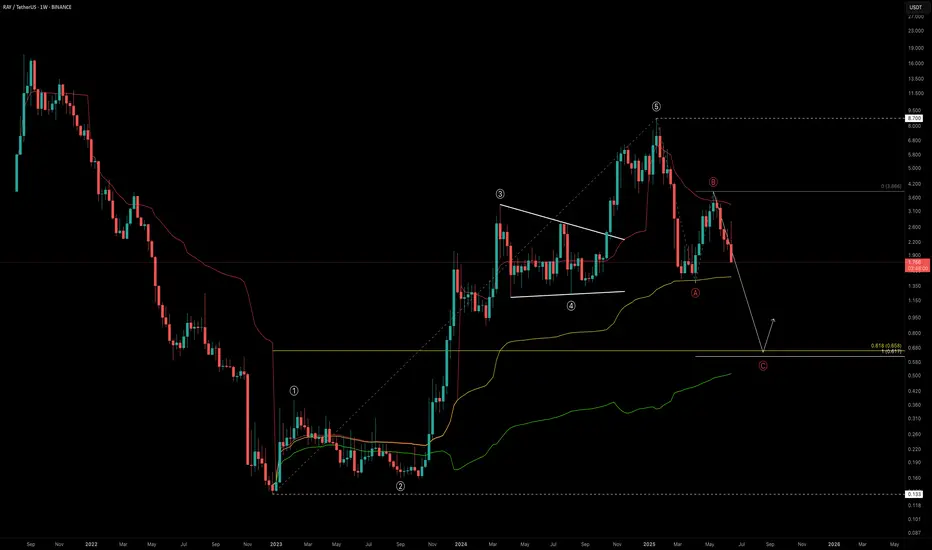
RAY Outlook: Is a -60% Drop the Reset We Need?RAY marked its bottom in December 2022 at just $0.133, entering a prolonged accumulation phase that lasted nearly a year. Then, in late 2023, it broke out into an explosive bull run, skyrocketing +6421% over 756 days and peaking at an impressive $8.70.
This run completed a full five-wave Elliott Wave structure. After topping out, RAY dropped -84% down to $1.388 — likely marking the Wave A correction. A strong relief rally followed into the $4 region before facing rejection at the yearly VWAP, possibly completing Wave B. Now, all signs point toward us being in the final Wave C of the larger corrective structure.
So, where could Wave C bottom out?
🔍 Fibonacci Confluence Zones (Log Scale)
Let’s assess the key levels with log-scaled Fibonacci tools:
🔹 Fib Retracement (from $0.133 low to $8.7 high):
The 0.618 fib retracement lies at $0.658
🔹 Trend-Based Fib Extension (Wave A → B projection for Wave C):
1.0 TBFE sits at $0.617
✅ These two levels align nearly perfectly, giving us a strong confluence zone between $0.62 and $0.66
Additional Confluences
Anchored VWAP Bands:
The 0.618 VWAP band multiplier also aligns with this $0.6 zone
Liquidity Perspective:
This level would wipe out long positions built over the past 550 days — clearing and potentially resetting the market
🚨 Fair Value Trend Model (FV Trend Model):
According to my Fair Value Trend Model indicator, the fair value for RAY currently sits around $0.78 — right in line with the broader confluence zone. This model uses log-log regression to estimate Bitcoin’s and other assets’ fair-value over time.
👉 Feel free to use the indicator
Just head over to my profile, click on the “Scripts” tab, and you can add the Fair Value Trend Model to your charts to experiment with it yourself.
Together, these technical elements form a compelling high-probability zone for long setups around $0.6–$0.8.
💡 Educational Insight — Why 0.618 is a Critical Fib Level
In Elliott Wave theory and harmonic trading, the 0.618 retracement is known as the "Golden Ratio" — often serving as a magnet for price during corrections. When paired with a 1.0 trend-based fib extension, it can mark exhaustion zones where Wave C concludes.
🔭 Summary: What’s Next for RAY?
Potential bottom zone: $0.61–$0.78
Watch for reversal signals like bullish candlestick patterns, volume spikes, or divergences
A drop to this zone would represent a -60% drawdown from current levels
Remember: High-probability setups don’t come every day — patience is your edge
Set alerts. Stay prepared.
_________________________________
💬 If you found this helpful, drop a like and comment!
Want breakdowns of other charts? Leave your requests below.
Highprobabilitysetup
Bitcoin — Breakout or Bull Trap? SFP Setup ExplainedAfter a clean drop that nearly tagged the psychological $100K level, Bitcoin printed a Swing Failure Pattern (SFP) — sweeping the lows and snapping back with strength. That bounce wasn’t just a reaction — it was a liquidity reclaim.
Now, price structure is shaping into a potential Inverted Head & Shoulders — a classic reversal pattern often forming before a bullish continuation.
🔍 Key Level to Watch:
$106,694.63 — This recent key high was just taken out. If we see rejection here (SFP), it could set up a high-probability low-risk short opportunity.
🎯 Short Trade Idea (Only on SFP confirmation):
Entry: After price sweeps $106,694.63 and shows rejection
Stop-Loss: Above wick high (e.g., ~$107.4K)
TP Zones: $103.5K and $101.7K
R:R: ~1:7
✅ Cleaner setup with confluence from structure and liquidity — high probability if confirmed.
📚 Educational Insight: Why SFPs Work So Well
SFPs (Swing Failure Patterns) are some of the most powerful setups in trading because they:
Trap breakout traders
Sweep liquidity and reverse quickly
Offer clear invalidation (wick high/low)
Allow for tight stop-loss and high R:R setups
Using SFPs in conjunction with key highs/lows, volume, and structure dramatically increases your edge.
📈 Why Order Flow Is Crucial for SFPs
1. See the Trap Form in Real Time
SFPs are essentially traps — price sweeps a key level, sucks in breakout traders, and then reverses. Order flow tools let you see this happen:
A spike in market buys above resistance
Followed by a lack of follow-through (no new buyers)
And then an aggressive absorption or reversal (selling pressure hits)
Without order flow, this is all hidden in the candles.
2. Confirm Liquidity Sweeps with Delta & CVD
Watch for a delta spike or Cumulative Volume Delta (CVD) divergence — a clear sign that aggressive buyers are getting absorbed.
This gives you confirmation that the sweep failed, not just a random wick.
3. Tight Entries with Confidence
When you see actual trapped volume or liquidation clusters at the SFP level, you can enter tighter with conviction — because you're not guessing, you’re reacting to actual intent and failure in the market.
4. Early Warning System for Reversal or Continuation
If the SFP fails to trigger a reversal (e.g. buyers step back in with strength), you’ll see it early in the flow — and can quickly reassess.
🧠 Bottom Line:
Order flow lets you stop guessing and start seeing the actual fight between buyers and sellers. Combine it with SFPs, and you're not just trading price — you're trading intent. That edge is huge.
_________________________________
💬 If you found this helpful, drop a like and comment!
Want breakdowns of other charts? Leave your requests below.

SOL Trade Blueprint: Waiting for the High-Conviction EntryAfter printing a SFP at the key high of $180.52 followed by a sharp -8% rejection, SOL made a second attempt to breach the major resistance zone between $180–$185 — but once again, bulls fell short. Since then, price has been in a corrective phase. So the big question is: where’s the next high-probability trade setup? Let’s zoom out and break it down.
📏 Zooming Out: Structure, FVG & Fib Confluence
Back on May 8th, SOL broke through the April 25th swing high at $157 with strong momentum, leaving behind an untested Fair Value Gap (FVG) — a key displacement area that’s yet to be filled. When we draw the Fibonacci retracement from the low of that move to the current high, the 0.618 retracement lands precisely at $157.34 — right on the old breakout high. That’s a beautiful confluence.
Timing-wise, if SOL pulls back to that level between May 21–22, the 0.75 Fib speed fan also kicks in — adding dynamic trendline support to the static Fib level.
📉 What About the $164 Golden Pocket?
There's a golden pocket forming around $164 from a recent mini-impulse, and while it may look tempting, context matters. This pocket isn't supported by enough confluence — no major structure, volume shelf, or EMA alignment. For a quick scalp? Yes. But for a high-conviction swing? It's not ideal.
Remember, in trading we're not here to chase every candle — we're here to wait for the setups that stack the most reasons to say yes.
📍 The Zone to Watch: $157
Now let’s talk about that $157 zone — and why it’s standing out as the highest-probability long setup:
0.618 Fib retracement of the major impulse
Retest of the breakout swing high
Untested Fair Value Gap (FVG)
233 EMA + 233 SMA on the 4H timeframe lining up as dynamic support
1.5 outer pitchfork support line crossing through
1:1 trend-based Fib extension confluence
Prior area of interest
This is what we call a “stacked setup.” The more layers of confluence, the more conviction we have in the trade. Add to that the potential for a liquidity sweep (SFP) just below the current low at $159.44 — and it becomes a zone worth watching closely.
🎯 Long Setup:
Entry: $157–$159.44 (watch for SFP confirmation)
Stop-Loss: Below $154
Target: $200
R:R: Approx. 1:12 — a setup worth being patient for
🧠 Educational Note: Why Confluence Is King
High-probability trades don’t come from guessing. They come from stacking confluence: structure, Fibonacci, moving averages, time-based levels, pitchforks, VWAPs, volume profiles — the more that lines up, the less you need to hope and the more you can trust your edge. Think like a sniper, not a machine gun.
The market rewards patience and precision — not noise and FOMO.
🔻 Short Setup (Alternative Play)
While we’re primarily bullish, there’s a valid short opportunity at the psychological $200 mark — but only if price shows clear rejection and confirmation (e.g. SFP, bearish engulfing, high volume reversal).
Entry: $200 rejection
Stop-Loss: Above $205
Target: $185–$180
R:R: Approx. 1:3+
🔥 Final Words: Trade With Purpose
This is what trading is about — not chasing green candles, but waiting for structure, clarity, and alignment. Whether you’re trading long or short, focus on high-conviction setups backed by logic and levels, not emotion.
Don’t trade for action. Trade for precision. The market will always reward the patient ones who are willing to wait for that clean entry, stacked with reasons to act.
Trust the process, stay disciplined, and let the charts do the talking. 💪📈
___________________________________
If you found this helpful, leave a like and comment below! Got requests for the next technical analysis? Let me know.

BNX: After a +900% Rally, What's Next?BNX had an incredible run, skyrocketing +900% in just 19 days, completing a 5-wave Elliott Wave structure and peaking at $1.3333. Since then, the price has been in a downtrend, now approaching the critical $1.00 psychological support level.
Key Support Levels
The weekly open sits at $0.9387, aligning perfectly with the Point of Control (POC) from the previous trading range, making this a crucial level to watch. However, the bigger question remains—where is the next high-probability trade setup?
Liquidity Below $0.8278 – There's a significant liquidity pool just below this low, making it an attractive area for potential stop hunts before a reversal.
0.5 Fibonacci Retracement ($0.7333) – Measuring the full +900% move, the 50% retracement aligns near a key support zone.
Weekly Bullish Order Block ($0.7076) – A historical area of demand, adding further confluence.
1.272 Fibonacci Extension ($0.7250) – Another confirmation of a potential bounce area.
Anchored VWAP from $0.1334 – Currently sitting at $0.6675, this dynamic support strengthens the buy zone.
0.618 Fibonacci Speed Fan – If the price drops towards this level by late February, it could provide additional confluence for a bounce.
Potential Trade Setups
Bullish Setup: If price sweeps $0.8278 liquidity and enters the $0.7333 - $0.7076 demand zone, a long opportunity with confirmation could offer a great risk-to-reward trade.

High probability Scalp AU ExampleHello Traders!
Here is a great example of getting a high probability raid to sell side.

How to find High Probability trades?Hi all, hope you guys are doing well.
In this post, we are going to see how we can combine different indicators/concepts to create confluence zones and find high-probability trades.
Introduction
A trade that has a greater chance of success than a regular trade is called a high-probability trade. Obviously, it's our assumption that some trades have higher chances of success as compared to others because they have more supporting factors. Nevertheless, a high probability trade can also result in a loss.
How to find high-probability trades?
There are a few things that you can observe to find a confluence of various important factors such as a support/resistance level, demand/ supply zone , Fibonacci level, moving averages, volume , RSI , etc.
Depending on your knowledge and trading style, the confluence zone can be derived using a combination of various different concepts or indicators. In this post, I am going to share the factors that I look at for finding good trades.
How to find confluence zones?
In order to find the confluence zones, you need to understand the concepts and the indicators, then combine them together to create the whole picture. It's like building a jigsaw puzzle - first, you need to identify the individual pieces, and then you need to put them together.
Let’s dive into all of these concepts one by one.
1. Market structure
Market structure is simply a basic form of understanding how the markets move. The price action is how the market moves based just on price, without the consideration of trends and how they may continue. But the market structure is focused mainly on the trend.
I have covered market structure in various different threads that you can read here:
a) Introduction to Market structure
b) Bullish market structure
c) Bearish market structure
2. Consolidation before Breakout
If a stock consolidates before giving a breakout, there are higher chances that it will be a true breakout. This is because all the residual supply gets absorbed at the resistance zone and most of the pending demand orders get filled.
Ideally, once a stock goes into consolidation, one of the two processes occurs:
Accumulation
Distribution
In layman’s terms,
- If demand is more aggressive than supply, then the price rallies, which confirms accumulation.
- Similarly, if the supply is more aggressive than the demand, then the price falls down, which confirms distribution.
If you are struggling with identifying the breakouts, be sure to read this post.
3. Support-Resistance levels
S/R levels are critical parts of trend analysis because they are used to highlight important zones. The fact that these levels flip roles between support and resistance can be used to determine the range of a market, trade reversals, bounces, or breakouts. These levels exist due to the influx of buyers and sellers at key junctures.
Flip zone acting as resistance:
Flip zone acting as support:
If you are looking for an in-depth tutorial on support and resistance, please check out my old guide here:
4. Supply-Demand zones
S/D demand zones are one of the most important things that I look at while charting. The stronger the S/D zone, the higher the chances of a reaction. Always look for these zones in the direction of the major trend.
5. Location of 200MA or 200EMA
Always observe the position of 200MA/ EMA with respect to price. Once the price interacts with the moving average, study the reaction. If you are looking for a long trade, then look for a positive reaction as the price reacts with the moving average.
6. Overlap with a Fibonacci level
A lot of times, the price will come back to a Fibonacci level. You need to observe the price behavior near these levels.
If you are not familiar with the Fibonacci tool, please check my old guide on Fibonacci retracement and extension.
7. Candlestick pattern and the size of the candles
The candle spread plays an important role in determining the strength and mood of the underlying trend. In layman's terms, big-bodied candles indicate strength and small-bodied candles act as noise.
In any case, the candlestick pattern and candle spread should only be viewed at an important level. The context plays a crucial role.
8. Chart patterns
This is pretty self-explanatory. If you trade patterns, you can combine them with other factors to strengthen your analysis.
9. Volume expansion
Ideally, at the time of the breakout, the volumes should rise. The volume can be deceiving and we need to see orderflow for a clear picture. Obviously, the majority of us are not looking at the orderflow and hence the volumes can be deceiving. But, for a normal trader, the simple volume indicator is more than enough.
So, these are mainly all of the factors that I look at while analyzing the charts. Please note that the usage of the concepts will vary with charts. Sometimes only 3-4 factors may be at play and the other times, 6-7.
High Probability trade checklist:
1. Market structure
2. Consolidation before the Breakout
3. Support-Resistance levels
4. Supply-Demand zones
5. Location of 200MA or 200EMA
6. Overlap with a Fibonacci level
7. Candlestick pattern and the size of candles
8. Chart pattern
9. Volume expansion
In the example above, you can notice the following things:
1. The market structure was bullish before the breakout, which was evident from the formation of higher highs and higher lows. Don't confuse the internal structure (Low time frame structure) with the external structure (High time frame structure).
2. The price was consolidating in the rectangle / parallel channel for a good amount of time.
3. When the price reached the previous demand zone, the selling pressure started to decrease and the buyers started to step in.
4. When the price interacted with 200MA/ EMA, there was a strong reaction to the upside. This means that the buyers want to take the price higher.
6. The buying interest can be seen by an increase in the volume in the last few sessions before the breakout. The volume can be deceiving and we need to see orderflow for a clear picture. But in general, you do not need to complicate this, just use volumes in conjunction with other factors.
7. We always look for some reversal or indecision candlesticks in the confluence zone. In the chart above, at the point of interaction with the moving average and the demand zone, we can see the formation of exhaustion candles.
Again, we need to look at these patterns only at specific important levels (like support or resistance levels) and disregard the formations in between the levels.
8. When the price broke above the previous major resistance with a massive bullish candle, there was a heavy volume expansion.
More examples:
You can read and revise this post until you understand all the concepts.
Thanks for reading. I hope you found this helpful! 😊
Disclaimer : This is NOT investment advice. This post is meant for learning purposes only. Invest your capital at your own risk.
Happy learning. Cheers!
Rajat Kumar Singh (@johntradingwick)
Community Manager (India), TradingView

GBP/USD Bullish High Probability ScalpHello Traders!
Here we have an high probability scalp opportunity to the buy side.
Price is making higher swing lows and higher swing highs.
Is another leg higher due? or will be range?
I want to see price make a new leg higher.
Previous daily highs should be broken more often than previous daily lows if we are going to start trending bullish.
Does this mean DXY is leaning bearish? Possibly.

GBPCAD Bearish possibilityDaily TF with a bearish bias.
4Hr TF forming an ascending channel and just recently double top, indicating further bearish movement.
1Hr TF, Formed a head and shoulder pattern with a break of the right shoulder.
30min, forming a correction continuation pattern, further south expected after breaking of that correction.

Bullish EURCHF high probabilityDaily - Lower trendline being hit.
4Hr - Impulsive move out of the HTF trendline.
1Hr - Descending channel formed hitting the HTF trendline, giving a False BO to the downside and impulsively moving the price to the other outside part of the 1hr descending channel, possibility of head and shoulders formation too, + double bottom from a June 2015 swing.
The only need now is to wait for a correction to enter after it, with an SL below and the TP at the beginning of the descending channel.
Trades always need to be managed. Markets can flip their motion like English weather, better to preserve than to lose all of it.

Testing the Underside of Head & Shoulders in NasdaqThis seems like a high probability short after yesterday's profit taking waterfall.
The Fed has been asking for inflation for years, now the question is how well we can manage it. A rate raise cycle could be inevitable, which could/should result in some profit taking.
Good luck to all!

NZDCAD SWING TRADEHigh probability trade
The analysis begins from the Daily timeframe to the 4-hour timeframe execution zone .
5 wave structure complete with multiple wave structures currently in a 3 wave pattern internal structure (3-3- ((with a possibility of 5 to follow)))
Considering where wave B has ended we should consider a high probability that wave C might only go back to the previous high in the wave structure or point A

GBPAUD Long - The Sterling is Bullish After a fake breakout of the 4hr trend line (manipulation?), I expect this pair to re-test line before continuing higher.
I would take this trade, via a buy limit order which would be placed in a confluence area with a 4hr trend line, market structure support and 50% fib level.

SGDJPY SWING LONGWith this pair having completed an impulse and correction on the weekly chart, we can look forward to the next swing leg in the market; which should be an ATTEMPT by the pair to create another impulse and a higher high on the weekly chart.
On the daily chart, this pair has just broken (and closed) above previous resistance; thus presenting a good opportunity to enter a long on this pair. If we get a retracement to test this area (which also has a confluence of the daily 61.8% fib, taken from the low of the circled red candle), it should act as support for the pair, then we can be searching for entries on lower time frames while the pair is in and around the area.

EURJPY Swing LongWith the possibility of creating, at least, an equal high on the weekly time frame, this pair presents a good swing trade opportunity. On the daily time frame, the pair is on a re-test of an important structure level. If the pair rejects this support level, then there is a high probability of the pair rallying from support. Additionally, an inverted H&S is forming on the 4hr time frame of this pair, which serves as good confluence for a long on pair.
A more ballsy target would be the 127.2% fib extension of the weekly retracement.
