$BONK here loks good for another 1000%SEED_DONKEYDAN_MARKET_CAP:BONK here looks good for another 1000%; cluster of htf levels with declining sell volume.
A run to ATH is 500%, and beyond to the fibs is over 1000%.
Easy invalidation just below pink yearly line.
Highrisk

Tue 25th Mar 2025 XAU/USD Daily Forex Chart Sell SetupGood morning fellow traders. On my Daily Forex charts using the High Probability & Divergence trading methods from my books, I have identified a new trade setup this morning. As usual, you can read my notes on the chart for my thoughts on this setup. The trade being a XAU/USD Sell. Enjoy the day all. Cheers. Jim

Komodo (KMD)Introduction:
The Performance of KMD Coin
KMD (Komodo) is a blockchain platform that enables developers to create their own private blockchains while benefiting from robust security features. This coin is used in the cryptocurrency market with the goal of enhancing security, scalability, and interoperability between blockchains. As a result, KMD has a high growth potential and can serve as an attractive option for both investors and blockchain users.
Comprehensive and Optimized Analysis for KMD Coin
📊 Current Market Status:
Support Range: 0.1772 - 0.2344
KMD is currently positioned at the lower boundary of a range box. This support area is the most critical level for market entry. If the market holds at this level, there is a potential for price movement toward the upper boundary of the range box and higher resistance zones. This could present an excellent entry point for investors.
Stop Loss: 0.1400
If the support level fails and the price moves lower, the stop loss should be set just below this level. This risk management strategy is crucial to prevent further losses and properly manage the investment.
📈 Price Upside Potential:
Upper Range Boundary (Red Zone):
Resistance Zone: 0.4043 - 0.4584
This resistance zone is observed on the weekly time frame, and based on historical data, each time the price has approached this zone, we’ve seen a pullback to the lower end of the range. However, if the price manages to break through this zone, there’s potential for the uptrend to continue.
Upside Targets (if the upper range boundary is broken):
TP1: 0.7819 - 0.9000
TP2: 1.3486 - 1.5824
TP3: 3.4201 - 3.7903
If the current resistance zone is broken, the price could reach higher targets as listed above.
🔍 Technical Features:
Low Market Cap:
Given KMD’s relatively low market cap, if liquidity flows into the market, this coin could experience growth beyond the mentioned targets. This characteristic provides a higher profit potential for investors.
RSI (Relative Strength Index):
Connecting RSI lows may indicate support at this trend line, suggesting a potential move toward higher levels. This technical tool can be considered a confirmation signal for long positions.
📊 Trading Volume:
To validate the uptrend, trading volume must increase significantly. Low volume could indicate a fake upward move that lacks sustainability. High volume can serve as a strong confirmation signal for the continuation of the uptrend.
🔒 Risk Management and Stop Loss:
After breaking the weekly resistance zone (red zone), the stop loss can be moved below this level.
Also, as price reaches each target and stabilizes above it, the stop loss should be adjusted to below the broken targets to protect the profits.
💡 Conclusion:
KMD is currently at an important support level, and if this level holds, a move toward higher targets can be expected. With favorable technical features like a low market cap, RSI, and trading volume, this coin has high growth potential. For effective risk management, adjusting the stop loss based on price fluctuations and resistance breakouts is essential.

TrueFi (TRU)Comprehensive Analysis of TRU/USDT
Overview
TrueFi (TRU) is an innovative project in the decentralized lending space (DeFi Lending) that enables collateral-free lending. The TRU coin is among the low-market-cap cryptocurrencies, and due to its low liquidity and high volatility 🚨, it falls into the category of high-risk trades. For investing or trading this coin, risk management and attention to trading volume are essential.
Current Market Situation
Downtrend Channel: 📉
TRU’s price is currently in a downtrend channel and is heading towards the bottom of the channel.
Weekly Support Zone:
The range (0.0605 - 0.0662) acts as a key support level. Although there is a possibility of a drop below this range, a quick rebound (Fake Breakout) from this zone could signal a safe entry. 💡
Trading Volume: 📊
If the volume increases when the price bounces from the channel’s bottom, the likelihood of price rising to the top of the channel strengthens. Traders should pay close attention to volume near the support range.
RSI: 📈
RSI Support Zone:
The range (41.24 - 44.19) could prevent further decline. A breakdown of this zone could lead to a deeper drop.
Breaking the 50 RSI Zone:
A move above this level could indicate a strong upward move, providing a good entry opportunity. 🚀
Upcoming Scenarios
Bullish Scenario: 🌟
Bounce from the Bottom of the Downtrend Channel:
If the price stabilizes in the support range (0.0605 - 0.0662) and trading volume increases, an upward move to the top of the channel becomes likely.
Breakout of the Downtrend Channel’s Top:
If the top of the downtrend channel is broken, the price could reach the target range (0.2258 - 0.2702). Given TRU's low market cap, heavy liquidity inflow could push the price beyond this target. 📌
Bearish Scenario: ⚠️
Loss of Weekly Support:
If the range (0.0605 - 0.0662) is lost, the next support is at 0.0400.
Traders should set appropriate stop-loss orders to mitigate risk. 🛑
Weakness in RSI:
A breakdown of the support zone (41.24 - 44.19) in the RSI could signal a continuation of the downtrend. 🔻
Range-Bound Scenario: ⏸️
If the price remains within the weekly support zone and trading volume decreases, a short-term range-bound movement may develop. 🔄
Stop-Loss:
For long trades, set the stop-loss below the 0.0600 range. ❌
Trade Volume:
Given the high risk, it is recommended to allocate only a small percentage of capital to this trade. 💰
Summary
TRU, considering its technical setup and position in the downtrend channel, can present promising trading opportunities. However, due to its low market cap and high volatility, risk management is crucial. ⚡
Recommendation: Always review fundamental factors and project-related news before making any decisions. 📰
⚖️ Warning: This analysis is purely technical and should not be considered financial or investment advice. Always do your own research and practice risk management. Good luck! 🚀

GMXGMX/USDT Analysis
📊 Introduction
GMX token is considered one of the high-risk assets in the cryptocurrency market, as its relatively low market cap leads to significant price volatility. However, GMX has attracted considerable attention from investors due to its high growth potential in areas related to DeFi and decentralized contracts. In this analysis, we will examine GMX's price structure within a descending channel and explore the possible scenarios ahead.
🔎 Technical Analysis
Overall Trend in the Descending Channel
Channel Structure: GMX is currently moving within a descending channel and has experienced a sharp price correction after hitting the upper boundary of the channel.
Key Levels:
Resistance Zone (Yellow): The range of $26.50 - $27.26, a break above which could pave the way for a bullish move.
Midline of the Descending Channel: This level plays a crucial role in determining the current trend, and breaking above it would be a strong indication of buyer dominance.
Bullish Scenario (Breakout of Resistance Zone)
If the price breaks the yellow resistance zone and stabilizes above it, a bullish move is likely to gain momentum.
After breaking both the resistance and the midline of the channel, the price will approach the upper boundary of the channel. A breakout here could lead to further upward movement towards target levels.
Take Profit Targets (TP):
TP1: $44.57 - $47.86
TP2: $57.68 - $61.98
TP3: $77.88 - $82
🔍 Key Insight: Due to GMX’s low market cap, a significant influx of liquidity could push the price even beyond these targets.
Relative Strength Index (RSI)
The RSI moving above the midline serves as a critical confirmation, signaling bullish momentum alongside the breakout from the resistance zone and the midline of the descending channel.
Volume
An increase in trading volume during the breakout of the resistance zone and midline is crucial. High volume can prevent fake breakouts and provide confirmation for the continuation of the bullish trend.
🔒 Risk Management Key Points
Suggested Entry Point:
Enter after the breakout of the yellow resistance zone ($26.50 - $27.26) and price stabilization above it.
Stop Loss (SL):
Place the stop loss below the lower boundary of the descending channel to mitigate the risk of potential volatility.
Trade Volume Management:
Given GMX’s high volatility and inherent risk, the trade volume should be adjusted according to the investor's risk tolerance.
✨ Final Conclusion
The analysis suggests that GMX token has significant growth potential, especially if key resistance levels are broken and new liquidity flows into the market. However, monitoring technical confirmations (such as RSI and trading volume) and staying alert to market trends are crucial for successful trade entry.

CEROSetup for a short squeeze. Also they said they are doing an R/S 1/100 I believe.
This is a dangerous play.
I am only tossing some pocket change in on this.
NOT FINANCIAL ADVICE!!!

Coin98 (C98)💎 C98/USDT Technical Analysis
🔍 Overview
C98 remains in a long-term downtrend, but there are signs of a potential reversal at key levels. Given its low market cap, it is categorized as a high-risk asset. Therefore, risk management is crucial in this analysis.
🛠 Key Price Zones
🔴 Daily Support Zone (Red):
Range: $0.1429 - $0.1558
This is the first major support level where the price has paused. A decline in selling volume indicates reduced selling pressure in this area.
⚫ Weekly Support Zone (Gray):
Range: $0.0902 - $0.1128
If the red zone fails, this level could act as the next support.
🟢 PRZ (Key Resistance Zone):
This area combines the weekly resistance and the upper boundary of the descending channel. A breakout above this resistance could signal further bullish momentum.
🎯 Suggested Price Targets (TP):
1️⃣ Fibonacci 1.272: $0.5885 - $0.6916
2️⃣ Fibonacci 1.618: $0.9670 - $1.1942
3️⃣ Fibonacci 2.272: $2.1402 - $2.5903
📉 Risk Management (Stop Loss):
Recommended Stop Loss: Below the weekly support zone (Gray), i.e., below $0.0902.
🔔 Confirmation Signals for Entry
1️⃣ Volume Increase:
A surge in volume near resistance levels, especially during a breakout, could indicate the beginning of a bullish trend.
2️⃣ RSI Indicator:
RSI entering the Overbought Zone may signal strong buying momentum.
💡 Proposed Trading Strategy
Entry Points:
1️⃣ First Entry: In the red zone ($0.1429 - $0.1558).
2️⃣ Second Entry: In the gray zone ($0.0902 - $0.1128) if the first support is breached.
Profit-Taking Strategy (Scaling Out):
1️⃣ First Target: $0.5885
2️⃣ Second Target: $0.9670
3️⃣ Third Target: $2.1402
Capital Allocation:
Allocate only 2-5% of your total capital to this trade.
Ensure you set up a Stop Loss to mitigate risks.
🌍 Market Sentiment
Given the current market conditions and low trading volumes, it’s essential to adopt a conservative risk approach. Improved market sentiment could accelerate price recovery.
✨ Final Thoughts
C98 is currently positioned in a critical zone. Entering a trade should be accompanied by meticulous risk management. A breakout of the key resistance levels could lead to significant upside potential.
Avoid hasty decisions, and always consider additional analyses before acting.
🔗 Investment Disclaimer:
This analysis is for educational purposes only. The final responsibility for any investment decisions rests with you.

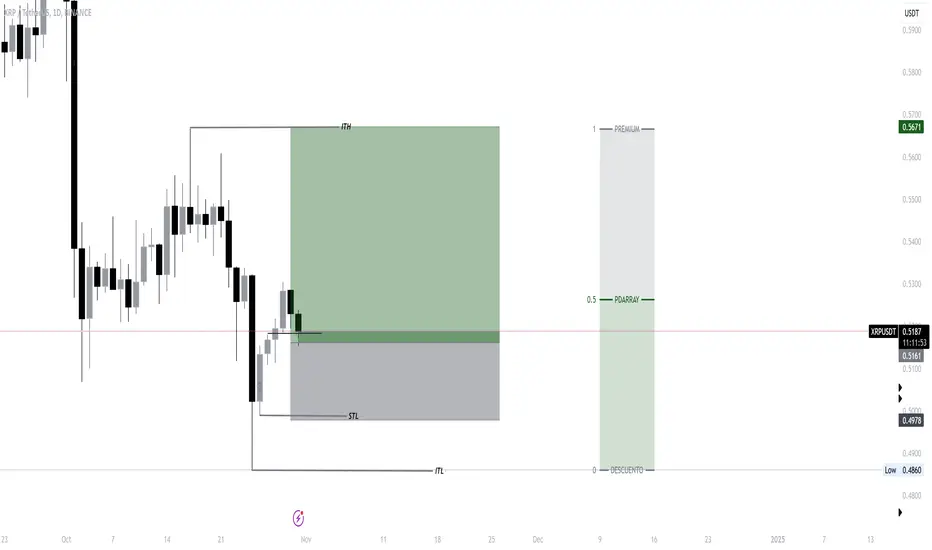
XRP Scalping-Day trading HIGH RISKHigh Risk
BINANCE:XRPUSDT
XRP appears likely to respect the daily bullish FVG (Fair Value Gap), and it's rare to see such setups on this asset. Given this unique opportunity, I’ve decided to enter, aiming to close the trade around the Intermediate Term High (ITH).
This is a straightforward setup: stop-loss placed at the swing low, as a break there could indicate a move to seek liquidity at lower levels. Target profit is set in the premium zone.
XAGUSD LONG-ScalpingThis is a high-risk trade setup. While I believe silver has more room for a rally, I expect it may need a significant drop first—that's what my instincts say. However, based on the charts, I’ve decided to go long as the price action has been resilient and seems poised to recover from yesterday's bearish whipsaw candle. Reminder: this is a high-risk trade with 0.50% capital at risk.

WTI LONG I've decided to open a new long position in oil FPMARKETS:WTI , despite the odds not being particularly favorable. My reasoning is based on observing strong support at the daily Fair Value Gap (FVG), which I had been waiting for to confirm a solid reaction before entering.
On the weekly chart, the outlook leans more bearish, and this week’s performance will be crucial in determining the market's clear direction.
While the 1-hour chart shows a decent reaction, it’s from a lower timeframe, which doesn’t carry much weight in terms of broader market strength.
Looking at the daily timeframe, the market structure is not encouraging. We’ve seen a consistent pattern of lower swing lows, adding pressure to the overall setup.
Trading management
However, on the 15-minute chart, this trade aligns perfectly with my approach: stop-loss just below the wick, as the candlestick has shown strong respect for this level. My take-profit is targeting liquidity on the buyer’s side. I plan to take partial profits at $71.46 and move my stop-loss to break even.
71.46-->RR: 4.19
74.24-->RR: 7.54
Capital risk: 1%

Nasdaq100 High risk LONGIdea in Progress: Noticing that during the Asian and London sessions, the price hasn’t made a new low, I see potential for an upward move. Given that the price is currently within a bullish 4H FVG, there’s a chance it could rise toward the bearish 4H FVG created yesterday before resuming its decline.
Trade Management: I'll take profit at the first swing high and then move my stop loss to break even.
Risk: 1%
Risk-Reward Ratio: 4.34

GBPJPY Bearish reversal possible.
Doji candlestick pattern visible on the 4hr chart. Bearish liquidity sweep & loss of momentum. It is very likely that it is enough to clear the stop-losses of early entries but not far enough to hit orders, thus, we manage in the middle.

GBP/JPYThe market is very risky… I usually don't trade on days like this .. but I saw a high-risk position ... let's see if we can make some money here.
PS. Leave your comments and thoughts.

GBP/AUDHigh-risk position from what I posted before. We have been following the price for some time now.
The price broke the trend line .. now doing a pullback. .. I entered as I posted.
It's all about probability.. remember risk management.
PS. Leave your comments and thoughts.

You like microcaps? Here's an extreme one, less than $100k!Metanept is a metaverse game that is still in the development phase. The chart is mega rekt, and the marketcap is currently not even $100k. The plan is to build a fully immersive open world game with quests, exploration, property management, minigames, all sorts of things. Development has taken very long and right now some things are finally starting to come to fruition. They have just opened up the casino section, where you can hit some slotmachines and play with NEPT. This ofcourse is just a small start, and they will develop it into a full casino with blackjack, roulette tables among other things.
This coin is extremely high risk. We have to hope that the team continues to work hard and realise their goals and ambitions. Either way, if this pumps, it's pretty much an instant 10x, and the long-term potential is obviously ridiculous if it actually ends up becoming a full-scale immersive game with hundreds of thousands of players one day. For now, it's just a gamble. So don't throw in too much money, even just $20 or $50 is more than enough.
Also, looking at the orderbook activity, there is just 1 marketmaker that owns over 1 billion NEPT and is manipulating the price. So keep that in mind if the price continues to dump after you buy. It's all just fake, which is to be expected in a marketcap of this size. Nice little gamble coin just in case they actually end up developing something great in the coming years.

Early entry *High Risk* trade 3HR BEFORE NEWS. Lets seeDXY Found support And I'm news positive on PPI AND jobs claims. High RISK ALERT!!
-not a financial advice please do your own research.

Aarti Industries Stock Analysis: Potential Breakout or Short OppHello traders,
Aarti Industries stock is showing a potential trend reversal from downward to upward on the 1-hour candlestick chart. However, there is a strong resistance level that needs to be broken for a bullish movement. On the other hand, there is a 60% chance for a short opportunity with high profit but high risk . The golden crossover below the current market price may act as a support level. Traders should watch for any bullish movement inside the triangle pattern and bears should exit if there is a breakout from the marked resistance level. It is better to take the short entry before it touches the support level.
Thanks & regards,
Alpha Trading Station
Disclaimer: This view is for educational purpose only & any stock mentioned here should not be taken as a trading/investing advice. We may or may not have position in the stocks mentioned here. Please consult your financial advisor before investing. Because Price is the "King of Market

MSFT still respecting key levels (options)Trading options based on key levels to take profit can be an effective strategy for investors looking to capitalize on short-term price movements. These key levels, also known as support and resistance levels, are often identified by analyzing historical price data and identifying areas where prices have previously stalled or reversed. By entering trades at these key levels and setting profit targets accordingly, investors can limit their risk and potentially realize gains in a shorter period of time. However, it's important to remember that trading options involves risk and investors should have a solid understanding of options trading and market analysis before attempting to use this strategy.
I created these key levels on MSFT in December and they still hold true today. Red levels are daily levels, yellow are hourly levels, and orange are your intraday levels. By my estimation, MSFT looks like it will bounce and find resistance at $260, but if it breaks through, it should go to $264 next. However, if MSFT breaks down tomorrow, we should reasonably target a move to $253 and a further move would go to about $247.
Todays price action was lackluster. There was a nice trendy move at the beginning of the day but it almost completely reversed itself. Watch the wavemaster indicator on lower timeframes for a sign of what is to come next. Right now, I see us in the middle of a range with a higher potential we bounce tomorrow vs go down.

GBPJPY: London SessionIf GBPJPY breaks trend line, there is a possible outbreak awaiting. Just be safe and place good stop loss. There is good support at 167.919

AUDCAD: London SessionIf AUDCAD break Support there is a possible short position. Risk is high due to support line at 0.88749.

FTT - Long position - High Risk On this chart we can see the massive drop from FFTUSD as we all know FTX is in big trouble. So this trading setup is a really high risk setup.
If we ignore the fundamentals, the indicators are showing that the price will go up. The indicators we used are the Bollinger Bands, RSI and stochastic. They´re all suggesting the price is oversold. So hopefully the price will have it´s last convulsion before it continues to go down.
All further details are shown on the chart.

BTC - another leg up #BTCHi everyone!
The last btc long went fast and was on target (hurray).
This play has more risk (under resistance).
but
1) R/R ratio is just fine (2.78)
2) clear invalidation (monthly close + prev ath)
3) RSI consolidating at the higher band - usually indicating a bullish consolidaiton
4) so far looks like a bull pennant is forming, with target exactly at a high volume node
In general it's better to wait for a breakout, but based on the chart (lots of stop loss orders - aka in this case buy orders above the range) so it's possible that there will be an aggressive move (later entry is questionable).
GL & HF

Unizen (ZCX) High Risk Gamble Coin With Huge 10X PotentialUnizen is a real good project with an innovative idea. It currently has a marketcap of just under $5m with a circulating supply of around 60m. They have recently (August 31st) been listed on Huobi and did a nice interview on the Huobi Global YouTube channel a few days ago. They will be launching their DEX aggregator later this month which is very exciting for them, and a huge milestone in their project. I suggest you go to the Huobi Global YouTube channel and watch the video if you want to learn about this project.
Anyway, this chart is absolutely crazy. This tiny little pump I drew on the chart would be more than a 10x from the current price of ~$0.08. Right now if you zoom in on the daily chart it looks like it could potentially pump&dump at any moment now, or otherwise drop straight to a new all time low below $0.07. If it pumps it will probably at least pump 2x - 3x, but as you can see even a 10x is easily possible on this chart, even for the usual pump&dump in the middle of a bearmarket. I would suggest entering between $0.075 - 0.08.
Now, the difficult part about this trade is whether or not you should use a stoploss. If I talk purely strategically, then I would definitely say that you should stoploss as soon as it makes a new all time low below $0.07, but with super illiquid microcap coins like this you just never know what happens because it is completely manipulated. It could easily dump below $0.07 to force traders like us to stoploss and then suddenly pump like crazy right after. So, the best course of action with a trade like this in my opinion is: Only use a small amount. Treat it like a gamble and don't invest anything that holds emotional value for you. Throw in $100 or whatever is a small gamble amount for you and see what it does. I will keep this trade updated to let you know what I think in case it pumps or drops to a new all time low.
Good luck, and remember, never invest more than you are willing to lose!
