NEARUSDT UPDATE
Pattern: Descending Triangle Breakout
Current Price: \$2.937
Target Price: \$3.60
Target % Gain: 22.69%
Technical Analysis: NEAR has broken out of a descending triangle on the 8H chart. Price is closing above resistance with decent momentum, indicating a potential move toward \$3.60.
Time Frame: 8H
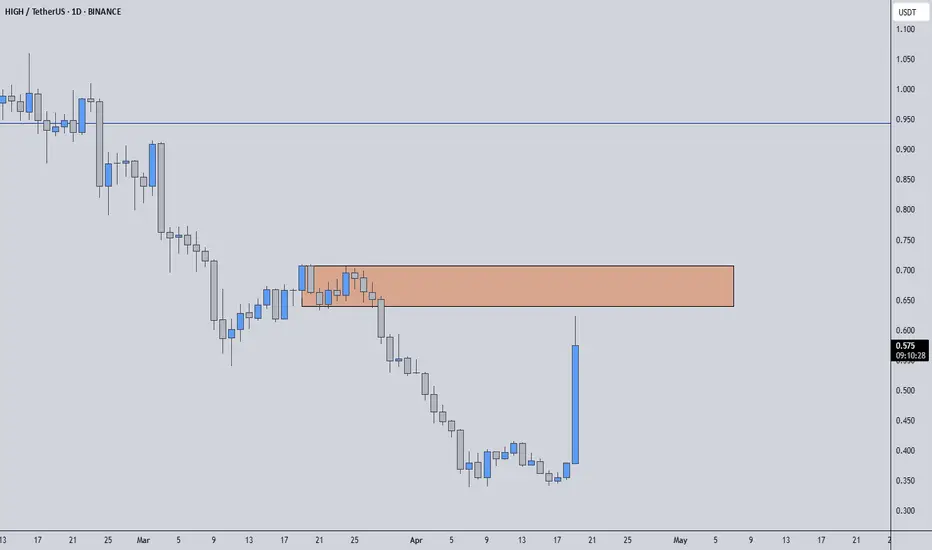
HIGHUSDT

HIGHUSDT Analysis D1HIGHUSDT Already Broken Descending Broadening and started Recovery in D1 Chart
Continuity of momentum can see 80-120% Bullish Rally in Short-term .

HIGHUSDT | +1800% Daily Volume Spike – Major Move Loading?Today, HIGHUSDT is one of the most explosive coins on the market, with an insane 1800% volume spike—this kind of surge never goes unnoticed. When a coin pulls this much liquidity in a single day, it's a clear sign that a major move is coming, and smart traders start watching it like a hawk.
🔍 What I'm Watching:
📈 Scenario 1 – Long Opportunity:
If HIGH breaks out of its current range with strength, ideally with confirmation from LTF breakout structures and sustained volume, I’ll be looking for a potential long setup targeting the next major resistance zone. This move could be fast and aggressive, so reactivity and confirmation are key.
🔻 Scenario 2 – Short Opportunity:
However, if we approach the resistance zone and sellers begin stepping in (especially if CDV divergence or delta weakness shows up), this could give us an ideal short setup. I’ll only consider it with strong LTF confirmations.
📌 Why You Should Care:
I only analyze coins that rank at the top in volume increase, this is how we isolate the setups with the most eyes and liquidity. And if you've been following my setups, you already know: timing and confirmation are everything.
🔥 Stay close. HIGH is about to make a serious decision,and when it does, we’ll be ready to capitalize.
📌I keep my charts clean and simple because I believe clarity leads to better decisions.
📌My approach is built on years of experience and a solid track record. I don’t claim to know it all but I’m confident in my ability to spot high-probability setups.
📌If you would like to learn how to use the heatmap, cumulative volume delta and volume footprint techniques that I use below to determine very accurate demand regions, you can send me a private message. I help anyone who wants it completely free of charge.
🔑I have a long list of my proven technique below:
🎯 ZENUSDT.P: Patience & Profitability | %230 Reaction from the Sniper Entry
🐶 DOGEUSDT.P: Next Move
🎨 RENDERUSDT.P: Opportunity of the Month
💎 ETHUSDT.P: Where to Retrace
🟢 BNBUSDT.P: Potential Surge
📊 BTC Dominance: Reaction Zone
🌊 WAVESUSDT.P: Demand Zone Potential
🟣 UNIUSDT.P: Long-Term Trade
🔵 XRPUSDT.P: Entry Zones
🔗 LINKUSDT.P: Follow The River
📈 BTCUSDT.P: Two Key Demand Zones
🟩 POLUSDT: Bullish Momentum
🌟 PENDLEUSDT.P: Where Opportunity Meets Precision
🔥 BTCUSDT.P: Liquidation of Highly Leveraged Longs
🌊 SOLUSDT.P: SOL's Dip - Your Opportunity
🐸 1000PEPEUSDT.P: Prime Bounce Zone Unlocked
🚀 ETHUSDT.P: Set to Explode - Don't Miss This Game Changer
🤖 IQUSDT: Smart Plan
⚡️ PONDUSDT: A Trade Not Taken Is Better Than a Losing One
💼 STMXUSDT: 2 Buying Areas
🐢 TURBOUSDT: Buy Zones and Buyer Presence
🌍 ICPUSDT.P: Massive Upside Potential | Check the Trade Update For Seeing Results
🟠 IDEXUSDT: Spot Buy Area | %26 Profit if You Trade with MSB
📌 USUALUSDT: Buyers Are Active + %70 Profit in Total
🌟 FORTHUSDT: Sniper Entry +%26 Reaction
🐳 QKCUSDT: Sniper Entry +%57 Reaction
📊 BTC.D: Retest of Key Area Highly Likely
📊 XNOUSDT %80 Reaction with a Simple Blue Box!
📊 BELUSDT Amazing %120 Reaction!
I stopped adding to the list because it's kinda tiring to add 5-10 charts in every move but you can check my profile and see that it goes on..
SUPERUSDT UPDATESUPERUSDT is a cryptocurrency trading at $0.5519, with a target price of $1.2000. This represents a potential gain of over 170%. The technical pattern observed is a Bullish Falling Wedge, indicating a possible trend reversal. This pattern suggests that the downward trend may be coming to an end. A breakout from the wedge could lead to a significant upward movement in price. The Bullish Falling Wedge is a positive indicator, signaling a potential price surge. Investors are showing optimism about SUPERUSDT's future performance. The current price may present a buying opportunity. Reaching the target price would result in substantial returns for investors. SUPERUSDT is positioned for a potential breakout and significant gains.

SEIUSDT UPDATESEIUSDT is a cryptocurrency trading at $0.1700, with a target price of $0.4500. This represents a potential gain of over 200%. The technical pattern observed is a Bullish Falling Wedge, indicating a possible trend reversal. This pattern suggests that the downward trend may be coming to an end. A breakout from the wedge could lead to a significant upward movement in price. The Bullish Falling Wedge is a positive indicator, signaling a potential price surge. Investors are showing optimism about SEIUSDT's future performance. The current price may present a buying opportunity. Reaching the target price would result in substantial returns for investors. SEIUSDT is positioned for a potential breakout and significant gains.

STRAXUSDT UPDATESTRAXUSDT is a cryptocurrency trading at $0.04440, with a target price of $0.07000. This represents a potential gain of over 80%. The technical pattern observed is a Bullish Falling Wedge, indicating a possible trend reversal. This pattern suggests that the downward trend may be coming to an end. A breakout from the wedge could lead to a significant upward movement in price. The Bullish Falling Wedge is a positive indicator, signaling a potential price surge. Investors are showing optimism about STRAXUSDT's future performance. The current price may present a buying opportunity. Reaching the target price would result in substantial returns for investors. STRAXUSDT is positioned for a potential breakout and significant gains.

HIGHUSDT 1DHIGH ~ 1D Analysis
#HIGH This coin is still in the channel decreases, waiting for this resistant line successfully penetrated. Maybe with a minimum target of 10%+.

UNIUSDT UPDATEUNIUSDT is a cryptocurrency trading at $6.780. Its target price is $10.000, indicating a potential 50%+ gain. The pattern is a Bullish Falling Wedge, a reversal pattern signaling a trend change. This pattern suggests the downward trend may be ending. A breakout from the wedge could lead to a strong upward move. The Bullish Falling Wedge is a positive signal, indicating a potential price surge. Investors are optimistic about UNIUSDT's future performance. The current price may be a buying opportunity. Reaching the target price would result in significant returns. UNIUSDT is poised for a potential breakout and substantial gains.

KDAUSDT UPDATEKDAUSDT is a cryptocurrency trading at $0.4898. Its target price is $0.8000, indicating a potential 90%+ gain. The pattern is a Bullish Falling Wedge, a reversal pattern signaling a trend change. This pattern suggests the downward trend may be ending. A breakout from the wedge could lead to a strong upward move. The Bullish Falling Wedge is a positive signal, indicating a potential price surge. Investors are optimistic about KDAUSDT's future performance. The current price may be a buying opportunity. Reaching the target price would result in significant returns. KDAUSDT is poised for a potential breakout and substantial gains.

DOTUSDT IDEADOTUSDT is a cryptocurrency trading at $4.415. Its target price is $7.500, indicating a potential 70%+ gain. The pattern is a Bullish Falling Wedge, a reversal pattern signaling a trend change. This pattern suggests the downward trend may be ending. A breakout from the wedge could lead to a strong upward move. The Bullish Falling Wedge is a positive signal, indicating a potential price surge. Investors are optimistic about DOTUSDT's future performance. The current price may be a buying opportunity. Reaching the target price would result in significant returns. DOTUSDT is poised for a potential breakout and substantial gains.

PEPEUSDT UPDATEPEPEUSDT is a cryptocurrency trading at $0.00729. Its target price is $0.01400, indicating a potential 100%+ gain. The pattern is a Bullish Falling Wedge, a reversal pattern signaling a trend change. This pattern suggests the downward trend may be ending. A breakout from the wedge could lead to a strong upward move. The Bullish Falling Wedge is a positive signal, indicating a potential price surge. Investors are optimistic about PEPEUSDT's future performance. The current price may be a buying opportunity. Reaching the target price would result in significant returns. PEPEUSDT is poised for a potential breakout and substantial gains.

SHELLUSDT UPDATESHELLUSDT is a cryptocurrency trading at $0.3100. Its target price is $0.4500, indicating a potential 60%+ gain. The pattern is a Bullish Falling Wedge, a reversal pattern signaling a trend change. This pattern suggests the downward trend may be ending. A breakout from the wedge could lead to a strong upward move. The Bullish Falling Wedge is a positive signal, indicating a potential price surge. Investors are optimistic about SHELLUSDT's future performance. The current price may be a buying opportunity. Reaching the target price would result in significant returns. SHELLUSDT is poised for a potential breakout and substantial gains.

ACAUSDT UPDATEACAUSDT is a cryptocurrency trading at $0.0430. Its target price is $0.0800, indicating a potential 80%+ gain. The pattern is a Bullish Falling Wedge, a reversal pattern signaling a trend change. This pattern suggests the downward trend may be ending. A breakout from the wedge could lead to a strong upward move. The Bullish Falling Wedge is a positive signal, indicating a potential price surge. Investors are optimistic about ACAUSDT's future performance. The current price may be a buying opportunity. Reaching the target price would result in significant returns. ACAUSDT is poised for a potential breakout and substantial gains.

DGBUSDT UPDATEDGBUSDT is a cryptocurrency trading at $0.00926. Its target price is $0.01500, indicating a potential 70%+ gain. The pattern is a Bullish Falling Wedge, a reversal pattern signaling a trend change. This pattern suggests the downward trend may be ending. A breakout from the wedge could lead to a strong upward move. The Bullish Falling Wedge is a positive signal, indicating a potential price surge. Investors are optimistic about DGBUSDT's future performance. The current price may be a buying opportunity. Reaching the target price would result in significant returns. DGBUSDT is poised for a potential breakout and substantial gains.

STXUSDT UPDATESTXUSDT is a cryptocurrency trading at $0.900. Its target price is $1.600, indicating a potential 90%+ gain. The pattern is a Bullish Falling Wedge, a reversal pattern signaling a trend change. This pattern suggests the downward trend may be ending. A breakout from the wedge could lead to a strong upward move. The Bullish Falling Wedge is a positive signal, indicating a potential price surge. Investors are optimistic about STXUSDT's future performance. The current price may be a buying opportunity. Reaching the target price would result in significant returns. STXUSDT is poised for a potential breakout and substantial gains.

OPUSDT UPDATEOPUSDT is a cryptocurrency trading at $2.000. However, the target price is unusually lower at $0.600, which seems incorrect. Typically, a target price is higher than the current price. Assuming the target price is actually higher, the potential gain would be significant. The pattern is a Bullish Falling Wedge, a reversal pattern signaling a trend change. This pattern suggests the downward trend may be ending. A breakout from the wedge could lead to a strong upward move. The Bullish Falling Wedge is a positive signal, indicating a potential price surge. Investors are optimistic about OPUSDT's future performance. The current price may be a buying opportunity. Reaching the corrected target price would result in significant returns.

LPTUSDT UPDATELPTUSDT is a cryptocurrency trading at $7.414. Its target price is $14.000, indicating a potential 90%+ gain. The pattern is a Bullish Falling Wedge, a reversal pattern signaling a trend change. This pattern suggests the downward trend may be ending. A breakout from the wedge could lead to a strong upward move. The Bullish Falling Wedge is a positive signal, indicating a potential price surge. Investors are optimistic about LPTUSDT's future performance. The current price may be a buying opportunity. Reaching the target price would result in significant returns. LPTUSDT is poised for a potential breakout and substantial gains.

SEIUSDT UPDATESEIUSDT is a cryptocurrency trading at $0.2740. Its target price is $0.4500, indicating a potential 60%+ gain. The pattern is a Bullish Falling Wedge, a reversal pattern signaling a trend change. This pattern suggests the downward trend may be ending. A breakout from the wedge could lead to a strong upward move. The Bullish Falling Wedge is a positive signal, indicating a potential price surge. Investors are optimistic about SEIUSDT's future performance. The current price may be a buying opportunity. Reaching the target price would result in significant returns. SEIUSDT is poised for a potential breakout and substantial gains.

CELRUSDT UPDATECELRUSDT is a cryptocurrency trading at $0.01372. Its target price is $0.02000, indicating a potential 60%+ gain. The pattern is a Bullish Falling Wedge, a reversal pattern signaling a trend change. This pattern suggests the downward trend may be ending. A breakout from the wedge could lead to a strong upward move. The Bullish Falling Wedge is a positive signal, indicating a potential price surge. Investors are optimistic about CELRUSDT's future performance. The current price may be a buying opportunity. Reaching the target price would result in significant returns. CELRUSDT is poised for a potential breakout and substantial gains.

MKRUSDT UPDATEMKRUSDT is a cryptocurrency trading at $1,116. Its target price is $1,700, indicating a potential 55%+ gain. The pattern is a Bullish Falling Wedge, a reversal pattern signaling a trend change. This pattern suggests the downward trend may be ending. A breakout from the wedge could lead to a strong upward move. The Bullish Falling Wedge is a positive signal, indicating a potential price surge. Investors are optimistic about MKRUSDT's future performance. The current price may be a buying opportunity. Reaching the target price would result in significant returns. MKRUSDT is poised for a potential breakout and substantial gains.

IDUSDT UPDATEIDUSDT is a cryptocurrency trading at $0.3183. Its target price is $0.5000, indicating a potential 50%+ gain. The pattern is a Bullish Falling Wedge, a reversal pattern signaling a trend change. This pattern suggests the downward trend may be ending. A breakout from the wedge could lead to a strong upward move. The Bullish Falling Wedge is a positive signal, indicating a potential price surge. Investors are optimistic about IDUSDT's future performance. The current price may be a buying opportunity. Reaching the target price would result in significant returns. IDUSDT is poised for a potential breakout and substantial gains.
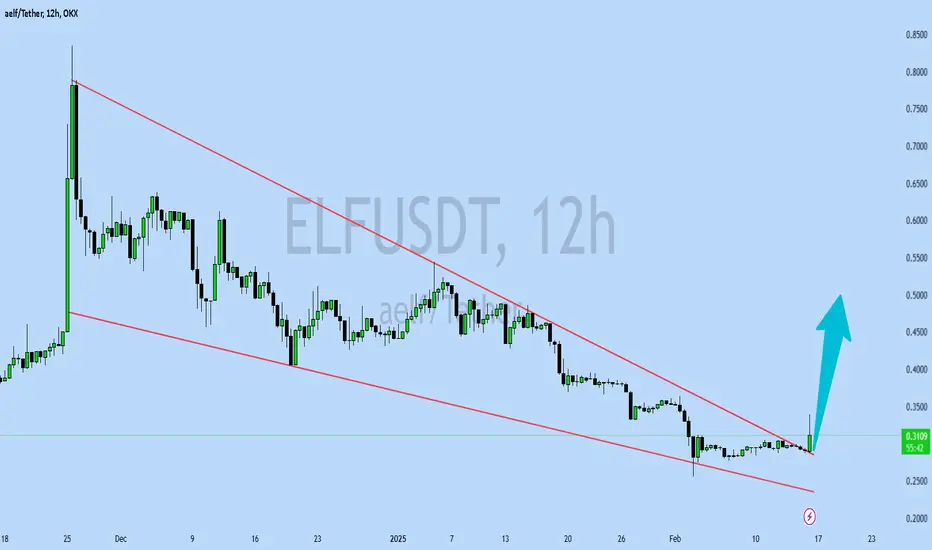
ELFUSDT UPDATEELFUSDT is a cryptocurrency trading at $0.3090. Its target price is $0.5000, indicating a potential 60%+ gain. The pattern is a Bullish Falling Wedge, a reversal pattern signaling a trend change. This pattern suggests the downward trend may be ending. A breakout from the wedge could lead to a strong upward move. The Bullish Falling Wedge is a positive signal, indicating a potential price surge. Investors are optimistic about ELFUSDT's future performance. The current price may be a buying opportunity. Reaching the target price would result in significant returns. ELFUSDT is poised for a potential breakout and substantial gains.

JASMYUSDT UPDATEJASMYUSDT is a cryptocurrency trading at $0.03336. Its target price is $0.06000, indicating a potential 100%+ gain. The pattern is a Bullish Falling Wedge, a reversal pattern signaling a trend change. This pattern suggests the downward trend may be ending. A breakout from the wedge could lead to a strong upward move. The Bullish Falling Wedge is a positive signal, indicating a potential price surge. Investors are optimistic about JASMYUSDT's future performance. The current price may be a buying opportunity. Reaching the target price would result in significant returns. JASMYUSDT is poised for a potential breakout and substantial gains.
