SNXUSDT UPDATESNXUSDT is a cryptocurrency trading at $1.865. Its target price is $3.000, indicating a potential 60%+ gain. The pattern is a Bullish Falling Wedge, a reversal pattern signaling a trend change. This pattern suggests the downward trend may be ending. A breakout from the wedge could lead to a strong upward move. The Bullish Falling Wedge is a positive signal, indicating a potential price surge. Investors are optimistic about SNXUSDT's future performance. The current price may be a buying opportunity. Reaching the target price would result in significant returns. SNXUSDT is poised for a potential breakout and substantial gains.
HIGHUSDT

HBARUSDT UPDATEALGOUSDT is a cryptocurrency with a current price of $0.3900. Its target price is $0.5500, indicating a potential 50%+ gain. The pattern is a Bullish Pennant, a continuation pattern signaling a potential breakout. This pattern suggests a brief consolidation before a strong upward move. The Bullish Pennant is a positive signal, indicating a potential price surge. Investors are optimistic about ALGOUSDT's future performance. The current price may be a buying opportunity. Reaching the target price would result in significant returns. The Bullish Pennant pattern typically leads to a strong upward move. ALGOUSDT is poised for a potential breakout.

HBARUSDT UPDATEHBARUSDT is a cryptocurrency trading at $0.30268. Its target price is $0.42000, indicating a potential 40%+ gain. The pattern is a Bullish Pennant, a continuation pattern signaling a potential breakout. This pattern suggests a brief consolidation before a strong upward move. The Bullish Pennant is a positive signal, indicating a potential price surge. Investors are optimistic about HBARUSDT's future performance. The current price may be a buying opportunity. Reaching the target price would result in significant returns. The Bullish Pennant pattern typically leads to a strong upward move. A breakout from this pattern could propel HBARUSDT to its target price.

LQTYUSDT UPDATELQTYUSDT is a cryptocurrency trading at $1.830. Its target price is $3.000, indicating a potential 60%+ gain. The pattern is a Bullish Falling Wedge, a reversal pattern signaling a potential trend change. This pattern suggests that the downward trend may be ending. A breakout from the wedge could lead to a strong upward move. The Bullish Falling Wedge is a positive signal, indicating a potential price surge. Investors are optimistic about LQTYUSDT's future performance. The current price may be a buying opportunity. Reaching the target price would result in significant returns. This pattern typically leads to a strong upward move.

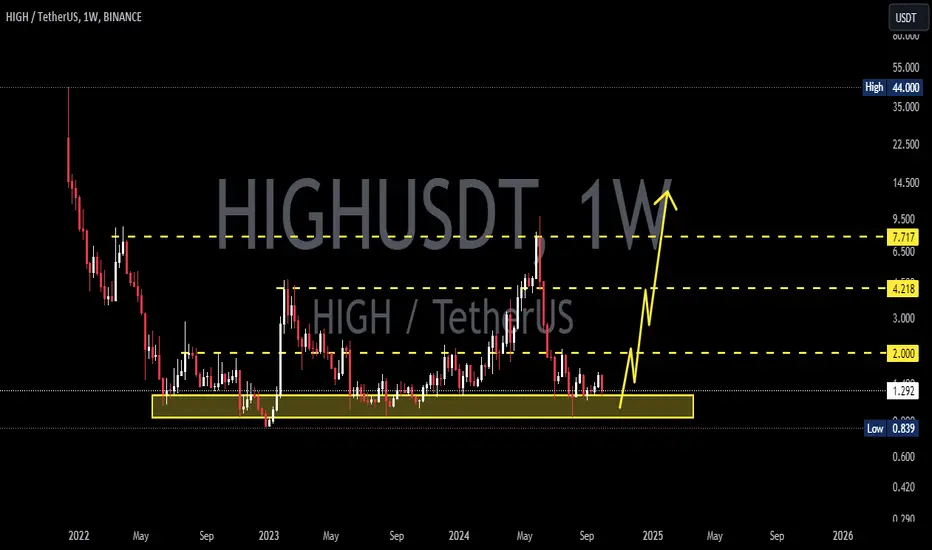
HIGHUSDT 1WHIGH ~ 1W
#HIGH If you still have Conviction on this coin,. This support block would be a very good buying place for now,. buy in stages with a target of 20%++

XRPUSDT UPDATEXRPUSDT is a cryptocurrency trading at $2.4840. Its target price is $3.1000, indicating a potential 25%+ gain. The pattern is a Bullish Pennant, a continuation pattern signaling a potential breakout. This pattern suggests a brief consolidation before a strong upward move. The Bullish Pennant is a positive signal, indicating a potential price surge. Investors are optimistic about XRPUSDT's future performance. The current price may be a buying opportunity. Reaching the target price would result in significant returns. The Bullish Pennant pattern typically leads to a strong upward move. XRPUSDT is poised for a potential breakout.

#HIGH (SPOT) IN ( 1.100- 1.400) T.(7.000) SL(1.051)BINANCE:HIGHUSDT
#HIGH / USDT
Entry ( 1.100- 1.400)
SL 1D close below 1.051
T1 2.200
T2 2.600
T3 3.300
T4 4.000
T5 5.000
T6 5.800
T6 7.000
______________________________________________________________
Golden Advices.
********************
* collect the coin slowly in the entry range.
* Please calculate your losses before the entry.
* Do not enter any trade you find it not suitable for you.
* No FOMO - No Rush , it is a long journey.
Useful Tags.
****************
My total posts
www.tradingview.com
**********************************************************************************************
#Manta #OMNI #DYM #AI #IO #XAI #ACE #NFP #RAD #WLD #ORDI #BLUR #SUI #VOXEL #AEVO #VITE #APE #RDNT #FLUX #NMR #VANRY #TRB #HBAR #DGB #XEC #ERN #ALT #IO #ACA #HIVE #ASTR #ARDR #PIXEL #LTO #AERGO #SCRT #ATA #HOOK #FLOW #KSM #HFT #MINA #DATA #SC #JOE #RDNT #IQ #CFX #BICO #CTSI #KMD #FXS #DEGO #FORTH #AST #PORTAL #CYBER #RIF #ENJ #ZIL #APT #GALA #STEEM #ONE #LINK #NTRN #COTI #RENDER #ICX #IMX #ALICE #PYR #PORTAL #GRT #GMT #IDEX #NEAR #ICP #ETH #QTUM #VET #QNT #API3 #BURGER #MOVR #SKL #BAND #ETHFI #SAND #IOTX #T #GTC #PDA #GMX #REZ #DUSK #BNX #SPELL #POWR #JOE #TIA #TFUEL #HOT #AVAX #WAXP #OGN #AXS #GALA #ONE #SYS #SCRT #DGB #LIT #QI #FIL #GLMR #ATOM #LTC #MANA #ONT #TLM #SLP

#HIGH (SPOT) entry range( 1.080- 1.380) T.(3.990) SL(0.944)BINANCE:HIGHUSDT
entry range (1.080- 1.380)
Target1 (1.910) - Target2 (2.612) - Target3 (3.249) - Target4 (3.990)
3 Extra Targets(optional) in chart, if you like to continue in the trade with making stoploss very high.
SL .1D close below (0.944)
*** collect the coin slowly in the entry range ***
*** No FOMO - No Rush , it is a long journey ***
**** #Manta ,#OMNI, #DYM, #AI, #IO, #XAI , #ACE #NFP #RAD #WLD #ORDI #BLUR #SUI #Voxel #AEVO #VITE #APE #RDNT #FLUX #NMR #VANRY #TRB #HBAR #DGB #XEC #ERN #ALT #IO #ACA #HIVE #ASTR #ARDR #PIXEL #LTO #AERGO #SCRT #ATA #HOOK #FLOW #KSM #HFT #MINA #DATA #SC #JOE #RDNT #IQ #CFX #HIGH ****

PHAUSDT UPDATEPHAUSDT is a cryptocurrency trading at $0.3209. Its target price is $0.5000, indicating a potential 50%+ gain. The pattern is a Bullish Falling Wedge, a reversal pattern signaling a potential trend change. This pattern suggests that the downward trend may be ending. A breakout from the wedge could lead to a strong upward move. The Bullish Falling Wedge is a positive signal, indicating a potential price surge. Investors are optimistic about PHAUSDT's future performance. The current price may be a buying opportunity. Reaching the target price would result in significant returns. This pattern typically leads to a strong upward move.

<HIGH> FOR BUY!!!Hello friends
This coin has succeeded in turning the trend due to the good flooring it has done.
Now considering that the price is a good place, it increases the value of buying it.
If you like it, we will be happy to support us with likes and comments.

Can #High Bulls Sustain Current Bullish Momentum? Key Levels Yello, Paradisers! Is #HIGH gearing up for a massive breakout, or could we see a bearish trap unfold? Let’s uncover what’s next for #HIGHUSDT:
💎The breakout of #HighStreet from the descending channel formation marks a significant turning point. After months of being trapped in a bearish structure, the breakout above the descending resistance line signals a potential trend reversal. However, the $2.547 level now acts as a major resistance zone. A decisive close above this level is crucial for confirming bullish momentum and opening the path toward the next resistance target near $4.50–$5.00.
💎If buyers manage to take control and break through the $2.547 barrier, we could see an explosive rally into the $4.50-$5.00 resistance zone, aligning with the key levels of previous price action. This move would confirm the bulls are back in charge and could even set the stage for a larger bullish structure in 2025.
💎On the flip side, the $1.600 support level and $1.266 demand zone are critical areas to watch for potential bearish invalidation. A daily candle close below $1.266 would signal a breakdown of the bullish structure, likely driving the price back into the descending channel. This could trigger further selling pressure, pushing the market toward the $0.94 region or lower.
Stay focused, patient, and disciplined, Paradisers🥂
MyCryptoParadise
iFeel the success🌴

#HIGH On the Edge of a Major Breakout From Descending ChannelYello! 👀 Is #HIGHUSDT on the edge of a major breakout, or are we setting up for another fakeout? Let's see the latest analysis of #HighStreet:
💎After 4-5 months of a sharp downtrend, #HIGH is finally approaching a critical moment. It’s testing the upper boundary of a Descending Channel, fueled by a strong Bullish Order Block (OB) around $1.177. While this might look like the turning point we've been waiting for, don't get too comfortable just yet.
💎To truly ignite this rally, #HighStreet needs to overcome a significant hurdle—the Bearish OB between $1.55 and $1.65, which previously served as a strong support level. A breakout above this zone, coupled with increasing volume and confirmation from the 20 EMA, could signal that the bulls are ready to take over. If that happens, expect a push toward the next major resistance.
💎However, if momentum slows down, we could see a pullback toward $1.177, retesting the breakout zone. A failure to hold this level might signal trouble, potentially dragging HIGH back down to the $0.95-$1.03 demand zone.
💎And here’s the real risk—if it breaks below this major support, it would hand control back to the bears, opening the door for a deeper correction and likely crushing hopes of a short-term bullish recovery.
Stay focused, patient, and disciplined, Paradisers🥂
MyCryptoParadise
iFeel the success🌴

HIGHUSDTHIGH ~ 1W
#HIGH If you have Conviction on this coin,. Maybe this support Block will be a very good buy for now. at least for 20%++ profit
HIGHTUSDT.4HReviewing the HIGH/USDT chart on a 4-hour timeframe provides a comprehensive look at its recent trading activity and hints at potential future trends. The chart displays a significant downtrend followed by a recent consolidation phase, suggesting a possible change in market sentiment.
Key Observations:
Price Movement: The price has undergone a steep decline since mid-June, bottoming out near the $0.959 mark, which now serves as a major support level (S1). After hitting this low, the price action has shifted into a consolidation phase, indicating a potential stabilization or base formation.
Resistance Levels: There are marked resistance levels at $1.717 (R1) and $2.087 (R2). The price has recently shown attempts to recover, touching and retreating from R1, suggesting this is an immediate hurdle for any bullish momentum.
MACD Indicator: The MACD line is currently above the signal line but very close, suggesting a potential bullish crossover. However, both lines are near the zero line, indicating a lack of strong momentum either way.
RSI Indicator: The Relative Strength Index is currently just below 60, which indicates a slightly bullish momentum but still far from being overbought, providing room for potential upward movement if buying pressure increases.
Technical Analysis and Conclusion:
The recent stabilization and attempts to push towards R1 suggest that the market might be absorbing selling pressure and could be preparing for a bullish reversal. However, the resistance at $1.717 remains a significant barrier that needs to be broken convincingly for a sustained upward move. The next target after R1 would be R2 at $2.087, but this would require substantial buying momentum, which is currently not evident from the MACD.
Trading Strategy:
Given the current market conditions, a cautious approach would be advisable:
Bullish Scenario: Should the price convincingly break and hold above R1 at $1.717, it could present a buying opportunity with R2 as the next target. Traders should consider setting a stop-loss just below R1 to protect against potential pullbacks.
Bearish Scenario: If the price fails to breach R1 and starts turning downwards, a retest of the support level at $0.959 could be likely. Traders might look for short selling opportunities if the price breaks below the support with a stop-loss just above the most recent high.
Investors should closely monitor the volume and other market indicators to confirm the strength of any breakout or breakdown before making significant trading decisions. Always ensure to use risk management techniques to mitigate potential losses.


Get HIGH while low BINANCE:HIGHUSDT.P been dumping hard for the past 5 days and today is 6th in a row. I believe we may expect a bounce soon. Momentum is already decreasing which is the first sign. Might dip lower under 2.6 to collect last portion of liquidity and then bounce back to 4 / 4.4 / 5


HIGH is super bullishAccording to the waves we have on the chart, HIGH seems to be creating a big triangle.
Wave A, B, and C are over. Wave C appears to have been a double hybrid correction.
Now we seem to be in the bullish D wave of this triangle.
It can explode while maintaining the green range.
Closing a daily candle below the invalidation level will violate the analysis.
For risk management, please don't forget stop loss and capital management
When we reach the first target, save some profit and then change the stop to entry
Comment if you have any questions
Thank You

#Highusdt spot pair weekly Timeframe wick price must be filled BINANCE:HIGHUSDT BINANCE:HIGHUSDT.P
MEXC:HIGHUSDT MEXC:HIGHUSDT.P
Based on the weekly timeframe, we have wick price, price should fill this , And this wick price will be our R zone. After that, the price can take support at 4.73

Get $HIGHHi guys! 👋🏻
🔔 Highstreet has been recovering after a slide to its historic lows. The metaverse has recovered after several notable partnerships and looks to continue its progress in partnering with Web2 corporations.
🔔 RSI, MACD and this rising wedge signal an upcoming slide towards the next support at $3.8 - $3.5. Watch these levels closely.
🔔 The cup is there, waiting for the handle to be formed. When the pattern is completed, the next resistance will be at $7.8.
✊🏻 Good luck with your trades! ✊🏻
If you like the idea hit the 👍🏻 button, follow me for more ideas.

HIGHUSD 1WHIGH ~ 1W
#HIGH This chart is very interesting. provided that #BTC does not go down again.
We placed a small buy on this support block, expecting a retest of this support. but this is a very high risk trade at a time when there is a lot of uncertainty in the market.

HIGHUSDT.1DExamining the 4-hour chart for HIGH/USDT, let's delve into the details:
Key Resistance and Support Levels:
Resistance 1 (R1): The chart does not specify the value, but it seems to lie slightly above the current trading price, potentially near recent highs.
Support 1 (S1): Again, the exact level isn't specified, but it's marked on the upward trend line. A breach below this could signal a reversal of the current trend.
Support 2 (S2): $3.653 - This level might serve as a lower boundary of the trading range if a downtrend confirms.
Support 3 (S3): $2.986 - A significant fall below S2 could see prices testing this next critical support level.
Technical Indicators:
Relative Strength Index (RSI): The RSI at 52.54 is just above the neutral 50, indicating slight bullish momentum but not particularly strong.
Moving Average Convergence Divergence (MACD): The MACD is below the signal line, and the histogram values are negative, suggesting bearish momentum is currently prevailing, though it appears to be weakening as the histogram bars are small.
Trend Analysis:
The price has been following an ascending trend line, supporting the price on pullbacks and indicating an upward trend. This trend line is crucial as a guide for the continuation of the bullish sentiment.
Conclusion:
The current market condition for HIGH/USDT on the 4-hour chart shows a market at a potential turning point. With the RSI near neutral and MACD indicating a bearish momentum, traders should be cautious. The adherence to the ascending trend line will be critical in determining future movements. A hold above this line could see attempts to test R1, while a break below might see the price fall towards S2 and potentially S3 if bearish pressure intensifies.
For trading, consider setting up buy orders near the trend line with stops placed just below to catch potential rebounds while managing risks. Conversely, if the price breaks the trend line decisively, it might be prudent to look for short opportunities towards S2 or S3, keeping an eye on any change in momentum indicated by RSI and MACD for potential exit or entry adjustments.

#HIGH/USDT#HIGH
The price is moving in a downward channel on a 1-hour frame, about to break upward
We have a downtrend on the RSI indicator about to occur. Bounce up
We have a higher stability moving average of 100
Entry price: 2.16
First goal 2.23
Second goal 2.30
Third goal 2.37
