Hindustan Unilever looks strong. Hindustan Unilever Ltd. engages in the manufacture of consumer goods. It operates through the following segments: Home Care, Beauty and Personal Care, Foods and Refreshments, and Others. It is one of leading company in FMCG sector.
Hindustan Unilever Closing price is 2453.60. Dividend Yield @CMP = 1.78%. The positive aspects of the company are Stocks Outperforming their Industry Price Change in the Quarter, Companies with Zero Promoter Pledge, Company able to generate Net Cash - Improving Net Cash Flow for last 2 years, FII / FPI or Institutions increasing their shareholding and MFs increased their shareholding last quarter. The Negative aspects of the company are high Valuation (P.E. = 53.9), Increasing Trend in Non-Core Income, Declining Revenue every quarter for the past 2 quarters and PEG greater than Industry PEG.
Entry can be taken after closing above 2460 Historical Resistance in the stock will be 2498 and 2534. PEAK Historic Resistance in the stock will be 2571 and 2601. Stop loss in the stock should be maintained at Closing below 2391 or 2369 depending upon your risk taking ability.
Disclaimer: The above information is provided for educational purpose, analysis and paper trading only. Please don't treat this as a buy or sell recommendation for the stock or index. The Techno-Funda analysis is based on data that is more than 3 months old. Supports and Resistances are determined by historic past peaks and Valley in the chart. Many other indicators and patterns like EMA, RSI, MACD, Volumes, Fibonacci, parallel channel etc. use historic data which is 3 months or older cyclical points. There is no guarantee they will work in future as markets are highly volatile and swings in prices are also due to macro and micro factors based on actions taken by the company as well as region and global events. Equity investment is subject to risks. I or my clients or family members might have positions in the stocks that we mention in our educational posts. We will not be responsible for any Profit or loss that may occur due to any financial decision taken based on any data provided in this message. Do consult your investment advisor before taking any financial decisions. Stop losses should be an important part of any investment in equity.
Hindustan_unilever

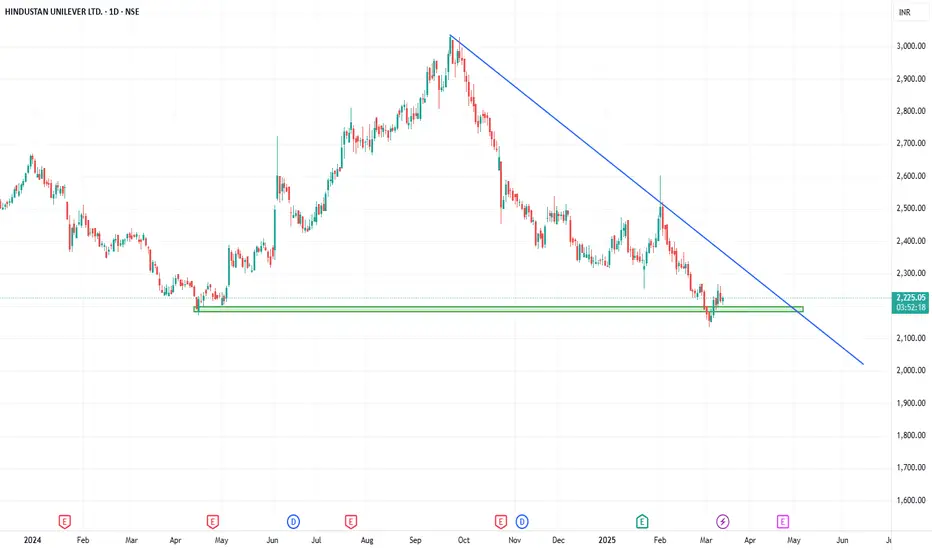
HUL at Strong Support Zone – Reversal Ahead?Hindustan Unilever Ltd (HUL) is currently trading near a key support level, indicating a potential reversal zone. Watch for price action signals like bullish candles or volume spikes to confirm a bounce. If the support holds, an upward move could follow; if broken, further downside may be seen. Keep an eye on RSI and MACD for additional confirmation. Ideal spot for swing traders and positional entries with proper risk management.
#HUL #HindustanUnilever #SupportLevel #TechnicalAnalysis #SwingTrade #NSEStocks #StockMarketIndia #PriceAction #ReversalZone #TradingViewIdeas
HUL looking bullishHindustan Unilever has completed the long-term Cup & Handle formation. It is expected to rise min. INR 350 from here.

Breaking out from Inverted HnS The scrip is breaking out and can give a good move, keep this in radar

Hindustan Unilever This stock has formed Decending Triangle pattern and given Breakout with good intensity of volume. One can go Long at current levels or in dips (if any) with Stop-loss of 2200 for targets upto 2570.
Breakout with good intensity of volume
All the key levels are mentioned in chart
Macd in hourly positive
Macd in daily positive crossover
Rsi in hourly above 60 and uptick
Disclaimer
I am not sebi registered analyst
My studies are Educational purpose only
Please consult your Financial advisor before trading or investing

Hindustan unilver at daily time frame demand zone with RSI indiHindustan unilver
at demand zone with
Postive RSI divergance
Good time to go long for long term invstrs

Buy Hindustan Unilever target 🎯 2800Buy Hindustan Unilever target 🎯 2800 but it's is above major breakout level

HindUnilvr Structure BreakHi Traders,
Previous Structure Break Kindly Avoid GapUp
15 min Chart Make descending triangle pattern so be careful
Plan B in comment Box
Simple & best techniques for Trading called S&D Zone easy to understand for making Profitable Trade. Believe Price Action, has the potential to change your trading lives.
Thanks & regards
Sakthi

Hindustaan unilever || HulHindustaan unilever wait for trend line break after that can go for short 50points and 100 points
Not recommend to buy and sell analysis before take and trade in this.

HULThe stock has taken important support at trendline in weekly chart. It can test its 2400 levels. Stoploss should be 2205. ( personal due diligence advised)

HINDUNILVR LOOK OUT FOR THESE LEVELS!!! HINDUNILVR
CONDITION 1
Buy above 2129
IMPORTANT LEVEL: 2134 TO 2140
- If the price able to break this level with volume and convection add more quantity. Target: 2150/2160
- If the price is not able to break the level, you can sell the stock target 2120/2110
CONDITION 2
Sell below 2116
IMPORTANT LEVEL: 2110 TO 2100
- If the price able to break this level with volume and convection add more quantity. Target: 2089/2079
- If the price is not able to break the level, you can buy the stock target 2125/2135
If you like the analysis, do leave a like and follow for more such content.
The analysis is my POV, hope you got bucks in your pocket to consult a financial advisor before investing :P :)
PH No: 8433624173.
Don't entertain any FREE Advice/suggestions requests, so refrain from sending any such messages.
HAPPY TRADING

9 days to 2310 As predicted HUL is taking small positive steps.. and this is likely to continue till it achieves 2310 level .


HINDUSTAN UNILEVER , 75 Min Elliott Wave Analysis .Elliott Wave Pattern Completed , Double Corrective Flat Followed By Zig Zag
Price Retraced 0.5 Of Its Impulse Wave .
Bigger Time Frame Trend Is Upside .
If Price Respect 2088 Level That Is 0.618 Fib Then It Will Give Big Upside Movement .
Last High Can Also Break .
Find A Bullish Setup Around Demand Zone (Marked Green)
Or Near 2088 Level .
Happy Learning .

HUL A STRONG SELL FOR ATLEST 1500Negative divergence in uniliver makes it very weak for holding.
Don’t buy this stock for now .its time for wait and watch till a bottom is formed

HINDUSTAN UNILEVER , 15 & 75 Min Analysis . In 75 Min Chart That is Attached Below .
Price Retraced . 0.618
Impulse Completed .
Price Is In Demand Zone .
In 15 Min Price Break Consolidation Candle .
Buy Initiated @ 2380 ( 15 Min )
Sl 2345 Followed By 2286 .
Trade And Manage Your RISK : REWARD According To Your Risk Appetite .
happy Trading .

Hindunilever Possible correction in near termCorrection is expected to complete Wave C. can correct up-to 1600 level

