The Bubble Could Pop Like It Did In 1929I and others who try to spot patterns in charts are starting to see a lot of similarities compering bull run from the 2008-2021 and the one from 1921-1929. You can clearly see that patterns are profoundly which to be honest, it keeps me up at night. Stock market as well as crypto market are VERY high. In last few years/months. everyone wants to become a day-trader or whatever, and having a mindset that everything can only go up from here. It was the same mindset back in 1928-1929 where everyone knew about the stock market, getting overleveraged and promoting it as it could make you rich over night. It is the same now so i want to worn people about all this. Don't listen CNBS and financial media as they are only there to create liquidity for the institutions so they can sell when the time comes. That time is right around the corner.
Also a fib. extension levels extended over previous fall in 2008 takes us to around 11-13% above where we currently are with DOW. Don't be naive and say that this time is different. It's not. Maybe the fall will not be that dramatic as the bubble is not as big as it was in 1929 but we certainly could and probably will fall below the bottom of 2008 ( roughly to 6k), so don't be surprised if it turns out this bear market is longer and deeper, because we need such correction for the market to stay healthy.
I am not financial advisor so non of this is a financial advise, just a BIG warning to you all.
DJ:DJI
Historical

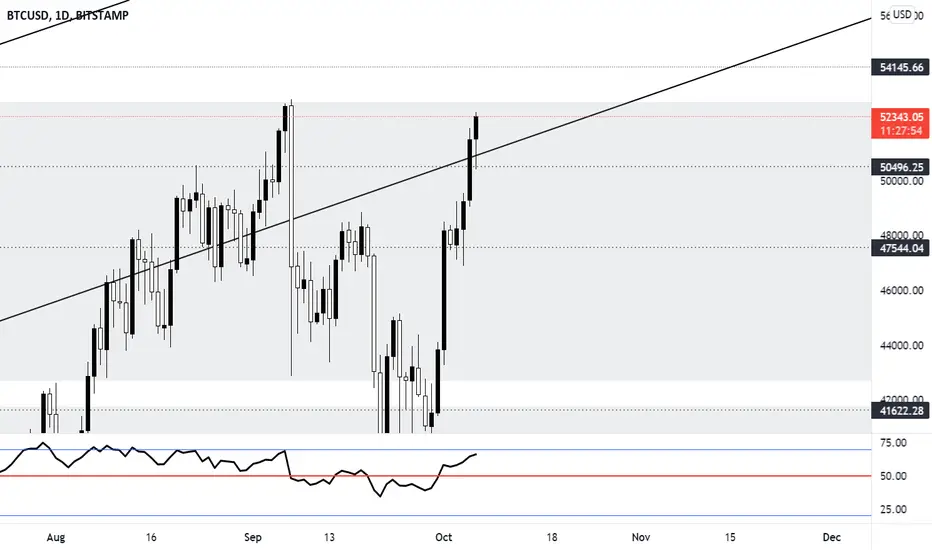
BTCUSDTBitcoin will meet $52854 which it couldn't break in in September. Maybe they are counting somewhere for a dump, but if not, it can reach $54000.
This coming 48 hours is crucial for the Bitcoin move.
DJI Elliot Wave and its HistoryBy using parabolic curves and the logarithmic chart I have found something very consistent and interesting with the DOW starting from its inception.
***Note: IF this has been discovered before then all credit to them, this will just be a decent idea to think about now and to bring up given recent events and trend.***
The Great Depression marked the first parabolic curve break on the chart but after I drew more parabolic curves using these guidelines:
- Each curve must touch the initial bottom back before 1900 and the bottom of the Great Depression (~1932) and must touch the start of Wave 1 and the bottom of Wave 4 for each of the cycles throughout DOW's history.
- There had to be 5 waves that match the rules correctly on the Monthly chart
- There had to be a matching A,B,C style correction after each cycle once the parabolic curve broke
- The 1973-74 recession was more of a W,Y,Z where it ended in a zig-zag type pattern
- Also, the pandemic fall back was very fast but still had a quick A,B,C which I left off the charts since it was too small to view
- Each parabolic curve break had to be after or during an important part of U.S History and sometimes World History as with COVID-19
In the end it seems to be pointing towards a large scale 1 - 5 Elliot Wave on a Super-millennium type cycle. Now this is just pure speculation but proper to ponder as an idea as the rules do fit currently to be so.
If there are debates to this please let me know as I am still a bit intermediate level with Elliot Waves. Same goes for each of the cycles I have shown.
So what does this mean for a possible future?? Once again high speculation here.
- If this is true then this current possible pullback is just a number 2 on the Monthly Elliot scale of this cycle which, if history repeats, would be a 50%-62% retracement back to 22-25k range and should be completed by mid-year next year (2022).
- That means a 3 would reach ~53k with a wave 4 to touch that current parabolic wave at ~36k. Then it would follow a wave 5 pushing towards 55k area.
- After this parabolic break I would speculate that it would be the last and it would end wave 5 of the super-millennium type cycle that DOW has been on since inception
- Once broke it would result in a large scale and long scale bear market that could last many years and see a correction pushing past 80%, 9.6k seems to be a good area with strong support as an eventual target
- Another possibility that points to this being the end of a very large cycle is that each of the parabolic curves are getting more narrow showing the overall rapid price rise as this has aged.
- Also, drawing out the Elliot Waves for this cycle showed 3 and 5 being very close for their tops with 1 and 4 nearly matching in price as well.
- Current Wave 1 has been riding the bottom of the last parabolic wave for some time now.
- Each correction in these Waves have been either been related to a big economic or historic event (sometimes both) so looks like this one could be another housing industry bubble as has been speculated to happen soon.
- IF this stays on course as shown then it would point towards the second half of 2027 as a huge historical event to come especially one that could cause a break of the long-term cycle. This would also be devastating too all markets as well if it happens.
This is just something I did and thought it would be a good idea to share. The DOW has been showing signs of a large correction coming and the speculation of another housing bubble bursting has got some thinking of a 2008 recession. What I have found does show a correction but it is at this time pointing to a much larger correction to come but at a later date this decade.
I would speculate though any monthly close below 20k on the DJI could mean serious trouble indeed as it would break this parabolic curve and each time it has at least meant a multi-year bear market to follow.
Anybody have anything to add or to help correct me on (I'm still not quite to an expert level with Elliot waves) then let me know be glad to comment back!
***Disclaimer: I am not a financial professional/expert and all ideas from me are all speculation based off of my own research. Please do your own research as well as I am not responsible for others when it comes to their financial decisions.***

🚨🚨🚨 SPX Black Swan Event 2022: Hidden MACD Indicator 🚨🚨🚨Technical Analysis comparing MACD histogram and structure of historical black swan events with today: 2018 - 2022.
Each historical Black Swan Event share 3 simple indicators, that are in play today;
1. Incremental pullbacks of increasing % that ultimately lead to the crash
2. MACD histogram micro contractions and macro expansion that ultimately lead to the crash
3. A Trend Line of Lower Lowers followed by Higher Highs on Recovery that ultimately lead to the crash
Historical Black Swan Events;
1965 - 1975: Build Up to 73/74 Crash
1986 - 1988: Black Monday Crash
1998 - 2009: Dotcom Bubble/Subprime Crash
Today;
2018 - 2022: Black Swan Event / Crash?
Hidden MACD Indicator & Analysis
As you will observe, in each of the major black swan events / crashes since the Great Depression, all three of the indicators play out.
Most significantly is the clear contraction and expansion of the MACD that is only visible on daily or weekly timeframes depending on the crash and how it played out:
1965 to 1975 saw the build up to the 1973 Crash and thus the MACD on a weekly timeframe over 10 years expresses the contractions and expansion.
Likewise, the Dotcom bubble to subprime crashes also last around 10 years and can be observed only on the weekly timeframe.
Comparatively on a daily timeframe over the course of 2 years, Black Monday crash displays the MACD contractions and expansion
Meanwhile today in 2021 we can observe over the last 3/4 years a similar expression of the contractions and expansion.
Conclusion:
History tends to repeat itself and three major historical indicators of crashes are playing out today. We know the FED can just keep printing $$$, but regardless, the house of cards will collapse again, as it has done time and time again.
Will 2022 be the next black swan event?
Share your thoughts and interpretations!!


Bitcoin Repeating History Bitcoin is following same pattern as we saw in 2018 Bitcoin dropped around 50% then a test of 200 Ma which also failed and we saw another 50% drop.

Bitcoin Failed to break 200 MA What's next??After a rally up from 30000$ to 45000$ Btc is facing the last fort of bears.
Will we see a downfall from the 200MA Just like we saw in 2018

Bitcoin & Gold Comparison (Fractal)As I was searching for fractals/similar market structures as bitcoin is showing right now I came across this gold chart from the 1970's.
Now when you take a look at this chart there are a lot of similarities.
1. You can see the first top which later on becomes the support area in both charts.
2. Then we see the market creating a top and failing to make a higher high on both charts.
3. On both charts we can see the market sell off after being unable to create a higher high.
4. We then find support on the area where the first top was created.
Now I'm not saying BTC will do the same, but you have to admit this all looks very similar.
On top of this you can see a very similar RSI structure and Ichimoku Cloud structure.
After gold had found its support it went on with an even bigger rally, eventually setting in a real top for that bull cycle. You can see this on the gold chart if you zoom out.
Now if Bitcoin will follow this fractal I believe we will see 100k+ prices within the next few months.

GOLD Historic price movementsHey guys, just some thoughts on Gold over here, Price looking a lot like its previous ATH from 2011-2013.
How wil you guys think it wil go?

QQQ Historical Fib Chart
This will be interesting to see how the next few months go. I have no idea one way or another, I don't really believe anyone does, but this chart is very telling of the runup we had in QQQ with very low interest rates. Once the fed does actually begin moving, I'd expect a sharp drop off in growth stocks that rely on low interest rates if they are not making profits yet. The fed is warning of this as well, so my plan is to put money into high cash flow stocks for the time being and buy back into QQQ once we have a more stable fed rate.

History likes to repeat itself - Sylvania PlatinumA careful look at the chart, and you can easily see that SLP is forming a bull flag after the peak of £1.50. Compare this to the last time this happened, a similar bull flag sent this higher. It looks to be in a strong, steady uptrend for now. Waiting for the bull flag to break.
Note: Not professional financial advice. Thanks and GLTA.

USDBRL exchange during presidencial terms (1995-2021)Dolar / Real exchange value during each presidencial mandates between 1995-2021

Micro Bitcoin Futures Will Increase the Addressable Market
Each event lifted Bitcoin to new highs
Next up- Micro futures
Expanding the addressable market through lower margin requirements- Real Estate is about location; other markets are all about liquidity
The market cap is still low and has room to rise
The next event will be the ETFs- It could take time
I remember a commercial that aired in New York for the lottery. The memorable slogan was “All you need is a dollar and a dream.” The odds of hitting the six lotto numbers along with the Powerball number were infinitesimal. At a recent Powerball drawing in Tennessee was one in 292.2 million. People have a one in 2.32 million chance of being killed in a lightning strike, to put the odds in perspective.
Meanwhile, a $1 investment in Bitcoin eleven short years ago bought 166.67 tokens at six cents per coin. At the April 14 high at $65,520, the $1 invested was worth over $1.09 million, a jackpot. The incredible return continues to fuel widespread speculation in the digital currency arena. Each day new tokens come to market. While Bitcoin and Ethereum are the leaders, there were another over 9,500 tokens, and rising, at the end of last week.
While Bitcoin’s value has risen steadily over the past eleven years, it has been a bumpy road. The Mount Gox debacle in 2014 shook confidence in the digital currency market and sent Bitcoin’s price substantially lower. High-profit critics over the past years have called Bitcoin and the other cryptocurrencies everything from a scam to a Ponzi scheme. JP Morgan Chase’s Jamie Dimon called it a “fraud” in 2017. Warren Buffet said it was financial “rat poison squared.” They were wrong as the digital currencies continue to challenge the status quo.
The CME rolled out its first futures contract in December 2017. The move pushed Bitcoin’s value over the $20,000 level. Monday, the CME will introduce a micro Bitcoin futures contract, which is likely to add liquidity to the market and help in the maturation process.
Each event lifted Bitcoin to new highs
Bitcoin has been around for a little over a decade. From humble beginnings where those with the foresight to mine the tokens found a treasure if they held it, the price of the leading cryptocurrency has vaulted to new highs each time acceptance grew.
In late 2017, the Chicago Mercantile Exchange rolled out futures contracts that sent the price to the first record high at over $20,000 per token.
The chart highlights the peak at $20,650 in December 2017.
This picture shows the incredible rise from price levels before the CME’s futures contract, which provided liquidity and expanded the addressable market. The CME rolled out Ethereum futures on February 8 with the same impact on the price of the second-leading digital currency.
Ether’s price rose in anticipation of the futures contract, but the February 8 rollout turbocharged the gains. Ethereum hit an all-time high at $2803.75 on April 29 as the bullish party continues to push the price to higher highs.
Meanwhile, other events have fostered a rising acceptance for the asset class, which has come a long way from Jamie Dimon’s classification as a “fraud” and Warren Buffett’s characterization as “financial rat poison squared.” Last September, Jack Dorsey’s Square (SQ), a payments technology company, bought $50 million worth of Bitcoin. They added another $170 million in purchases in early 2021. Meanwhile, Elon Musk’s Tesla (TSLA) swooped in and bought $1.5 billion of Bitcoin early this year and said it would accept the cryptocurrency for its EVs. Tesla is not the only company accepting cryptos these days. I've included a link to the growing number of companies and businesses accepting Bitcoins in the full article.
The bottom line is that the more companies accept Bitcoin, the more investment capital pours into the market. At the end of last week, Bitcoin’s market cap stood at roughly the $1.082 trillion level.
The Coinbase listing on NASDAQ was the last significant event. On April 14, the listing date, Bitcoin reached its latest record high at $65,520 per token.
Next up- Micro futures
The five-token Bitcoin contract had a nominal value of $327,600 when the price reached its April 14 high. Original or initial margin requirements or the good-faith deposit required to trade a Bitcoin future was roughly $160,000 per contract, precluding many market participants from trading the product. The extreme volatility in Bitcoin’s price requires a high margin level.
This week, on May 3, the CME rolled out the Micro Bitcoin future, a pint-sized product that makes Bitcoin futures trading and investing available to a broader audience. The contract is 1/50th of the size of the original futures (0.1 Bitcoin per micro contract), meaning margin requirements will be around the $2,500 level.
Micro futures will allow for hedging, speculation, and trading at a more manageable risk level for many.
Expanding the addressable market through lower margin requirements- Real Estate is about location; other markets are all about liquidity
In the real estate market, the mantra is location-location-location. In financial products, it’s liquidity-liquidity-liquidity.
Mature markets offer buyers and sellers the ability to execute purchases or sales on tight bid-offer spreads. Tight spreads are only possible when there is enough critical mass or trading volume created by a substantial number of market participants with interest at all price levels.
The CME’s micro product for Bitcoin that lowers nominal margin requirements could have an explosive impact on liquidity. The bottom line is that lower capital requirements make the market available to a growing addressable market, translating to increased liquidity. Liquidity measures include volume and open interest, the total number of open long and short positions in the futures contract.
Moreover, increasing liquidity often causes price volatility to decline. We witnessed this in the natural gas futures ( NG1! ) arena, which began trading in 1990 on the CME’s NYMEX division. The price ranged from 1990 through 2005 was from $1.02 to $15.65 per MMBtu, and the price action was wild at times. Over the first fifteen years of trading, the highest-level open interest ever reached was below 600,000 contracts. As the market matured and liquidity grew, open interest rose to over 1.6 million contracts. Over the past twelve years, increased liquidity led to a significant decline in price variance.
Please continue reading the full article using the link below.
Any investment involves substantial risks, including, but not limited to, pricing volatility, inadequate liquidity, and the potential complete loss of principal. This post does not in any way constitute an offer or solicitation of an offer to buy or sell any investment, security, or commodity discussed herein, or any security in any jurisdiction in which such an offer would be unlawful under the securities laws of such jurisdiction.

XLM in next retracement Okey, by now it should be clear. XLM will eventually drop back to 0.5 USD(supported by the trendline, break of the trendline will almost certainly indicate longer consolidation period), there we have our buy signal. Our sell signal lies at around 0.77 USD. This analysis was done solely on previous price movements, I have not identify any patterns or indications of the predicted price movement.

Interesting lines to why we might face so much resistance hereThe green and yellow line represents the channel which both the 2012 and 2016 accumulation took part in. We have never been able to build support here since. In 2019 during the summer, we visited this narrowing channel once again as we were forming a top, and got rejected below.
The blue line is drawn from the top of the 2013 rally (weekly tops, not wicks). We barely pushed through this line when we made the 2017 top, and have never been able to hold above this line either.
This would mean, that if we are able to build support above these levels, and go higher, there is a chance of turning the historical resistance levels that we are facing now, into support. If it does, its a paradigm shift in terms of macro price action in my eyes.
If not, the price may have to go down to gather the energy to one day push through. However, the macro picture to me looks very determined to conquering these levels.
Exciting times!


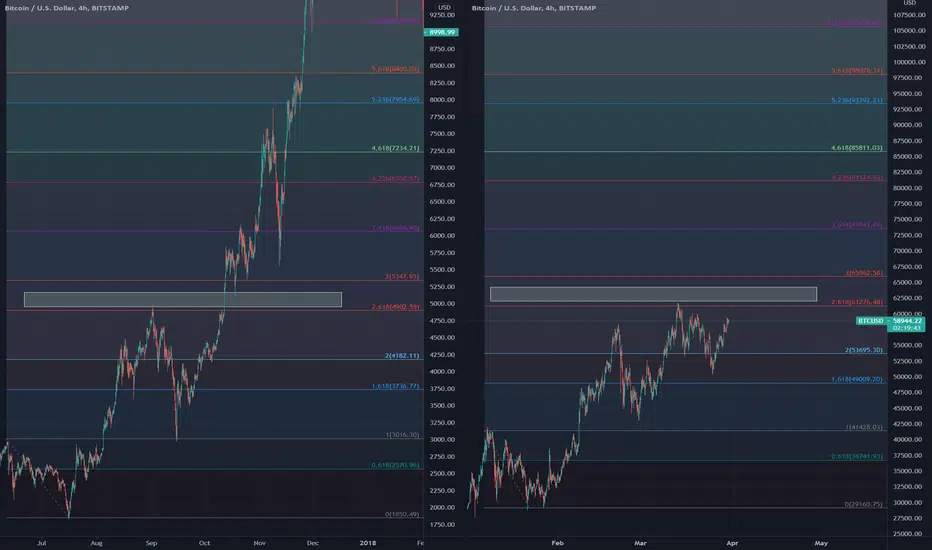
Near Term Points of Interest for the Bitcoin PriceComparing the same pattern in 2017 that has held very strongly with perfectly aligned fib extensions, here are some points of interest coming ahead.
BTC - A Chart to come back and look at one year from now1) Historic Regression Bands
2) Historic Trend Channel with a Heartline
3) Cycle Fibs
4) Historic Elliot Waves
I don't think we can get where we are going without a little pain along the way first.

EURNZD: Still Bearish? Or Bullish Potential?Hello all,
This is my analysis for EURNZD .
- Both lower-risk long and short areas have been clearly indicated with price targets.
If you like this analysis, then consider dropping a thumbs up and a follow! :)
Thank you!

EURNZD: Similar Historic StructureHello all,
This is my analysis for EURNZD .
- As you can see, price is forming similar historic structure. Do you think price will flip bullish soon? Comment down below!
If you like this analysis, then consider dropping a thumbs up and a follow! :)
Thank you!

EOS Has a LOT Of Potential In Terms Of % GainsIn terms of percentage gains EOS has a lot to go. We probably wont see prices below $6, maybe even higher, but that is just my opinion from what i see on a chart. Where are at a beginning of a alt season so it is hard to miss a coin that would not have some kind of % gains in it, but to find the right one, you have to look from a bigger perspective so you can see what it has done in the past. History tends to repeat itself so as human psychology imo.
From the chart perspective, 4.236 fib. extension takes us as high as $93, but in my opinion prices between 50 and 70 are more likely to be reached. It could just surprise us all and go even a bit higher than $100, but quite unlikely imo. We first have to break above $8.6 resistence line, from where we were rejected and couldn't reach for almost 2 years now. Breaking above this (blue) line would confirm the explosion in price, but will see.
The predicted price is just a representation from a 2017/18 alt season and does not mean it will go exactly like that.
I am not a financial advisor so don't buy anything that a say. Wish you all successful investment.
BITFINEX:EOSUSD

XRP Very Possible That The Show Is About To BeginTwo days back, xrp bumped out of nowhere and all that happened after btc setting new highs. Some say that market has experienced such price movements back in 2013 and if we are repeating that moment we are on a verge of a take off. We must not forget that at the moment xrp is one of the most undervalued altcoin that could provide such unique and useful utilities in financial system to begin with. Such useful projects among altcoins are needed for its financial growth and xrp is the leader in such usefulness imo.
From the chard perspective we could wave a bit between yellow and blue lines, but there is also a great chance that when one line is broken upwards, the price could just keep going. We have also managed to stay above purple rising trend line, which is a very great sign for now. The alt season for xrp is however confirmed once we broke above a green resistence line
I am not a financial advisor so don't buy anything that a say.
BITSTAMP:XRPUSD

