HIVE: When To, How To?I've been tracking HIVE for a while and now I want to show it to you, it will be a good money maker if you decide to "jump in." Let's go back to some basics signals.
HIVEUSDT Technical Analysis
In August 2024 we have the main low and subsequent higher low in November. In 2025 we have a long-term higher low, April & June and also a double-bottom. That's the classic.
The higher low points to a higher high for the new bullish wave that will develop in the coming days and weeks; the double-bottom points to the low being in and current prices being good for a trade setup with low risk vs a high potential for reward.
When to sell
I have a friend and he is a scientist, he asked, "Hey Alan, when should I sell? Should I go for 400% or 660%?" It is always the same question.
I said, "You can do whatever you want of course..." He wasn't satisfied. Imagine, the scientific mind. "Yes, but how do I know if the right target is the one where you placed 400% or the 660%?" He said. You know, the scientific mind is never satisfied unless supplied with specific answers.
"Well..." I am preparing myself to give a reply that will require no additional questions. "How you approach the targets will fully depend on your trading style, that is, your goals, your capital, your risk tolerance and how confident you feel about my analysis, the targets and the chart."
"What?" Listen, you just buy and hold and contact me after three months. You'll know what to do when prices are up... Just kidding of course.
Namaste.
HIVE

HIVEUSDT 1W AnalysisHIVE ~ 1W Analysis
#HIVE Buy back gradually from here if you still have confidence in this coin with a short term target of at least 20%+ from this support.

Hive Breaks Above Resistance, Easy 190% Jump In The MakingI don't have to describe the signals because it is already happening, the results will speak for themselves.
I have to describe the signals because we cannot post a chart without adding some text. So some times you will see me writing just to meet the requirements but I would just love to say, "It is going up."
Sometimes no words can give a stronger message than too many words, but the rules say that we have to write so, here we go:
» HIVEUSDT is trading within a long-term higher low. Long-term for me is 6 months or more for Cryptocurrency pairs, and here the main low happened in early November 2024, so this higher low can be called long-term. Of course, the second low happened recently, 7-April 2025, when the correction reached its end marketwide.
» A broken downtrend, based on an internal trendline and a move above resistance is also taking place. I can guess a strong RSI and move and close above some moving averages, in this case, EMA34 has been conquered.
» A nice and easy 190% bullish jump is in the making, this can happen within days or weeks, short-term. Within 30 days (one month). There will be more growth but this is for another day. This chart analysis is for those trading short-term.
Namaste.

HIVE buy/long setup (4H)Two trigger lines have been broken, and there is a bullish iCH on the chart. We have also seen a strong move, and at the origin of this move, buy/long positions can be considered.
This setup is mostly suitable for spot trading.
Targets are marked on the chart.
The closure of a 4-hour candle below the invalidation level will invalidate this analysis.
For risk management, please don't forget stop loss and capital management
When we reach the first target, save some profit and then change the stop to entry
Comment if you have any questions
Thank You

HIVEUSDT – Support & Resistance Levels Marked! Time to Make Some Money – But Smartly! 🔥
📊 Key Levels to Watch:
🟢 Green Box = Strong Support – This is where buyers may step in.
🔴 Red Box = Major Resistance – Sellers are likely waiting here.
💡 The Plan:
✅ At Support? – Look for LTF bullish confirmations & CDV divergence before entering long.
✅ At Resistance? – Wait for LTF breakdowns & CDV confirmation for potential short plays.
✅ Break & Retest? – If price breaks a level with volume, trade the retest—not the breakout itself.
📌 Final Words:
Patience + Confirmation = Profitable Trades. We don’t gamble, we execute!
🚀 Follow me for high-probability setups—let’s get this money! 🔥
✅I keep my charts clean and simple because I believe clarity leads to better decisions.
✅My approach is built on years of experience and a solid track record. I don’t claim to know it all but I’m confident in my ability to spot high-probability setups.
✅If you would like to learn how to use the heatmap, cumulative volume delta and volume footprint techniques that I use below to determine very accurate demand regions, you can send me a private message. I help anyone who wants it completely free of charge.
🔑I have a long list of my proven technique below:
🎯 ZENUSDT.P: Patience & Profitability | %230 Reaction from the Sniper Entry
🐶 DOGEUSDT.P: Next Move
🎨 RENDERUSDT.P: Opportunity of the Month
💎 ETHUSDT.P: Where to Retrace
🟢 BNBUSDT.P: Potential Surge
📊 BTC Dominance: Reaction Zone
🌊 WAVESUSDT.P: Demand Zone Potential
🟣 UNIUSDT.P: Long-Term Trade
🔵 XRPUSDT.P: Entry Zones
🔗 LINKUSDT.P: Follow The River
📈 BTCUSDT.P: Two Key Demand Zones
🟩 POLUSDT: Bullish Momentum
🌟 PENDLEUSDT.P: Where Opportunity Meets Precision
🔥 BTCUSDT.P: Liquidation of Highly Leveraged Longs
🌊 SOLUSDT.P: SOL's Dip - Your Opportunity
🐸 1000PEPEUSDT.P: Prime Bounce Zone Unlocked
🚀 ETHUSDT.P: Set to Explode - Don't Miss This Game Changer
🤖 IQUSDT: Smart Plan
⚡️ PONDUSDT: A Trade Not Taken Is Better Than a Losing One
💼 STMXUSDT: 2 Buying Areas
🐢 TURBOUSDT: Buy Zones and Buyer Presence
🌍 ICPUSDT.P: Massive Upside Potential | Check the Trade Update For Seeing Results
🟠 IDEXUSDT: Spot Buy Area | %26 Profit if You Trade with MSB
📌 USUALUSDT: Buyers Are Active + %70 Profit in Total
🌟 FORTHUSDT: Sniper Entry +%26 Reaction
🐳 QKCUSDT: Sniper Entry +%57 Reaction
📊 BTC.D: Retest of Key Area Highly Likely
📊 XNOUSDT %80 Reaction with a Simple Blue Box!
I stopped adding to the list because it's kinda tiring to add 5-10 charts in every move but you can check my profile and see that it goes on..

HIVEUSDT 1WHIVE ~ 1W Analysis
#HIVE If you still have a Conviction on this coin,. Maybe this support block you can consider to start buying again.

HIVE – Trade Setup - short pain for long gainz Short term risks for long term gainzzz
3h,4h and daily charts indicate heavy oversold conditions which make this a good opppr for the contrarian play, to target $3 levels for a 30% upside.
However we need to reclaim key levels of support first….
🔹 **Trade Direction:** Short (Bearish)
🔹 **Entry:** ~$2.05
🔹 **Stop Loss:** $2.25 (above recent resistance)
🔹 **Target 1:** $1.85 (previous demand zone)
🔹 **Target 2:** $1.60 (key psychological level)
📊 **Probability & Justification:**
- **Momentum:** Strong bearish momentum with lower highs and lower lows.
- **Indicators:** Oversold conditions on stochastic RSI but no bullish divergence yet.
- **Moving Averages:** Price below 50 & 200 EMA, confirming a downtrend.
- **Volume Profile:** Increasing sell pressure suggests further downside.
⚠️ **Risk Considerations:**
- Oversold bounce possible; manage risk accordingly.
- Potential support at $1.85 – monitor reaction before holding further.
📉 **Bias:** Bearish unless price reclaims $2.25+ with volume.

HIVEUSDT Sees 570% Daily Volume Spike! Next Big Move!?HIVEUSDT Analysis
Massive Volume and Key Bullish Zone
"HIVEUSDT is making waves with a 570% daily volume increase. This kind of surge doesn’t go unnoticed, and neither should these levels."
Why It’s Exciting:
Blue Box Zone: Around the blue box, I see a prime opportunity for bullish entries. These levels? Far from bad – they look great.
Volume Surge: This explosive volume increase is a clear sign of strong market interest and potential upside momentum.
Key Observations:
"As always, I’ll wait for confirmation with upward market structure breaks on lower time frames, supported by CDV and volume profile. The blue box isn’t just a zone – it’s a strategy."
This is shaping up to be a fantastic trade setup. Don’t miss the chance to act on strength and data! 🚀
Let me tell you, this is something special. These insights, these setups—they’re not just good; they’re game-changers. I've spent years refining my approach, and the results speak for themselves. People are always asking, "How do you spot these opportunities?" It’s simple: experience, clarity, and a focus on high-probability moves.
Want to know how I use heatmaps, cumulative volume delta, and volume footprint techniques to find demand zones with precision? I’m happy to share—just send me a message. No cost, no catch. I believe in helping people make smarter decisions.
Here are some of my recent analyses. Each one highlights key opportunities:
🚀 RENDERUSDT: Strategic Support Zones at the Blue Boxes +%45 Reaction
🎯 PUNDIXUSDT: Huge Opportunity | 250% Volume Spike - %60 Reaction Sniper Entry
🌐 CryptoMarkets TOTAL2: Support Zone
🚀 GMTUSDT: %35 FAST REJECTION FROM THE RED BOX
🎯 ZENUSDT.P: Patience & Profitability | %230 Reaction from the Sniper Entry
🎯 DEXEUSDT %180 Reaction with %9 Stop
🐶 DOGEUSDT.P: Next Move
🎨 RENDERUSDT.P: Opportunity of the Month
💎 ETHUSDT.P: Where to Retrace
🟢 BNBUSDT.P: Potential Surge
📊 BTC Dominance: Reaction Zone
🌊 WAVESUSDT.P: Demand Zone Potential
🟣 UNIUSDT.P: Long-Term Trade
🔵 XRPUSDT.P: Entry Zones
🔗 LINKUSDT.P: Follow The River
📈 BTCUSDT.P: Two Key Demand Zones
🟩 POLUSDT: Bullish Momentum
🌟 PENDLEUSDT.P: Where Opportunity Meets Precision
🔥 BTCUSDT.P: Liquidation of Highly Leveraged Longs
🌊 SOLUSDT.P: SOL's Dip - Your Opportunity
🐸 1000PEPEUSDT.P: Prime Bounce Zone Unlocked
🚀 ETHUSDT.P: Set to Explode - Don't Miss This Game Changer
🤖 IQUSDT: Smart Plan
⚡️ PONDUSDT: A Trade Not Taken Is Better Than a Losing One
💼 STMXUSDT: 2 Buying Areas
🐢 TURBOUSDT: Buy Zones and Buyer Presence
🌍 ICPUSDT.P: Massive Upside Potential | Check the Trade Update For Seeing Results
🟠 IDEXUSDT: Spot Buy Area | %26 Profit if You Trade with MSB
📌 USUALUSDT: Buyers Are Active + %70 Profit in Total
🌟 FORTHUSDT: Sniper Entry +%26 Reaction
🐳 QKCUSDT: Sniper Entry +%57 Reaction
📊 BTC.D: Retest of Key Area Highly Likely
This list? It’s just a small piece of what I’ve been working on. There’s so much more. Go check my profile, see the results for yourself. My goal is simple: provide value and help you win. If you’ve got questions, I’ve got answers. Let’s get to work!

HIVEUSDT (Hive) Updated till 25-01-25HIVEUSDT (Hive) Daily timeframe range. PA trying to stay above 0.4006 breaking that clean will lead it to 0.2255. staying above 0.4006 give buyers more chance to push it back. depends on volume now.

HIVE movement in small time framesElliot wave can be put on the HIVE 1h chart and I expect it to work like this!
what are your thoughts? let me know!
⚠️ Disclaimer:
This is not financial advice. Always manage your risks and trade responsibly.
👉 Follow me for daily updates,
💬 Comment and like to share your thoughts,
📌 And check the link in my bio for even more resources!
Let’s navigate the markets together—join the journey today! 💹✨

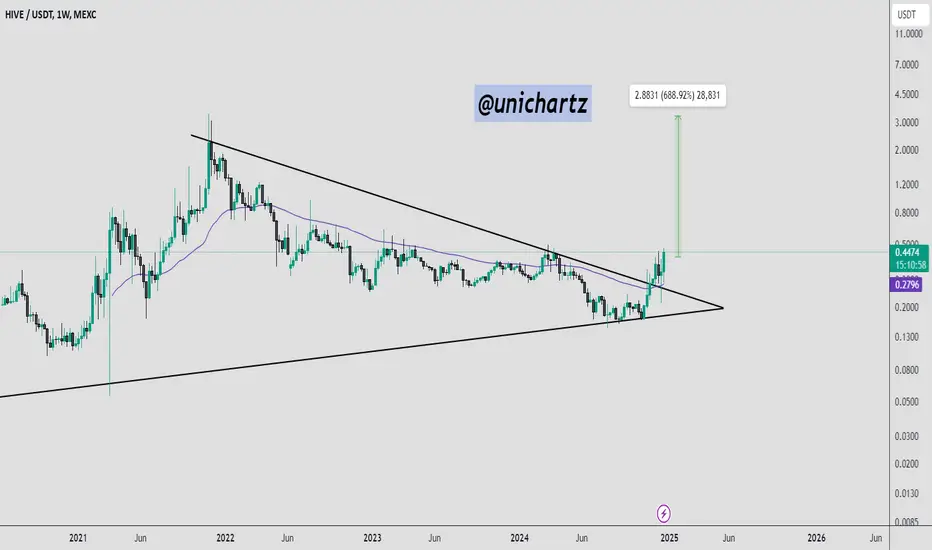
HIVE/USDT Breaks Multi-Year Triangle: Bullish Momentum Ahead?HIVE has broken out of a multi-year symmetrical triangle pattern on the weekly timeframe, with the price currently trading at $0.4456. It is now well above the 50-week EMA, which provides dynamic support around $0.28.
This breakout signals a strong bullish move, with potential resistance targets at $0.50 and $0.65. Watch for a retest of the breakout level for possible re-entry opportunities.
HIVEUSDT 1WHIVE ~ 1W
#HIVE If you still have Conviction on the coin,. buy after successfully breaking through this resistance line with a minimum target of 20%++

HIVEUSDT %1500 DAILY VOLUME SPIKEThere is a 1500% daily volume spike in HIVEUSDT, signaling significant activity and attention in this market.
The blue box is extremely valuable from multiple perspectives. I have used heatmap , cumulative volume delta (CVD) , and volume footprint techniques to identify this as a precise demand region , where buyers are likely to step in with strength.
Key Points:
Volume Spike: 1500% increase highlights a surge in market activity.
Blue Box: Carefully identified as a critical demand zone using advanced techniques.
Techniques Used: Heatmap, CVD, and volume footprint for pinpoint accuracy.
If you'd like to learn how I use these tools to determine such precise demand zones, just DM me!
If you think this analysis helps you, please don't forget to boost and comment on this. These motivate me to share more insights with you!
I keep my charts clean and simple because I believe clarity leads to better decisions.
My approach is built on years of experience and a solid track record. I don’t claim to know it all, but I’m confident in my ability to spot high-probability setups.
If you'd like to learn how I use heatmaps, cumulative volume delta, and volume footprint techniques to identify highly accurate demand regions, feel free to send me a private message. I'm happy to assist anyone interested, with no charge or obligation.
My Previous Analysis
🐶 DOGEUSDT.P: Next Move
🎨 RENDERUSDT.P: Opportunity of the Month
💎 ETHUSDT.P: Where to Retrace
🟢 BNBUSDT.P: Potential Surge
📊 BTC Dominance: Reaction Zone
🌊 WAVESUSDT.P: Demand Zone Potential
🟣 UNIUSDT.P: Long-Term Trade
🔵 XRPUSDT.P: Entry Zones
🔗 LINKUSDT.P: Follow The River
📈 BTCUSDT.P: Two Key Demand Zones
🟩 POLUSDT: Bullish Momentum
🌟 PENDLEUSDT.P: Where Opportunity Meets Precision
🔥 BTCUSDT.P: Liquidation of Highly Leveraged Longs
🌊 SOLUSDT.P: SOL's Dip - Your Opportunity
🐸 1000PEPEUSDT.P: Prime Bounce Zone Unlocked
🚀 ETHUSDT.P: Set to Explode - Don't Miss This Game Changer
🤖 IQUSDT: Smart Plan
⚡️ PONDUSDT: A Trade Not Taken Is Better Than a Losing One
💼 STMXUSDT: 2 Buying Areas
🐢 TURBOUSDT: Buy Zones and Buyer Presence
🌍 ICPUSDT.P: Massive Upside Potential | Check the Trade Update For Seeing Results
🟠 IDEXUSDT: Spot Buy Area | %26 Profit if You Trade with MSB
📌 USUALUSDT: Buyers Are Active + %70 Profit in Total
🌟 FORTHUSDT: Sniper Entry +%26 Reaction
I stopped adding to the list because it's kinda tiring to add 5-10 charts in every move but you can check my profile and see that it goes on..

HIVEUSDT (Hive) Updated till 22-12-24HIVEUSDT (Hive) Daily timeframe range. it do have lots of space to move around. now PA trying to get a close over 0.3444. all it needs a valid close to run it above. volume is decent here 0.2313 defended well. it needs to stay above 0.2313 for later moves.

#HIVE (SPOT) entry range( 0.15 - 0.1720) T.(0.4050) SL (0.1467)entry range ( 0.15 - 0.1720)
Target1 (0.2640) - Target2(0.4050)
SL .1D close below (0.1467)
**** #Manta ,#OMNI, #DYM, #AI, #IO, #XAI , #ACE #NFP #RAD #WLD #ORDI #BLUR #SUI #Voxel #AEVO #VITE #APE #RDNT #FLUX #NMR #VANRY #TRB #HBAR #DGB #XEC #ERN #ALT #IO #ACA #HIVE ****

HIVE Digital Technologies Options Ahead of EarningsAnalyzing the options chain and the chart patterns of HIVE Digital Technologies prior to the earnings report this week,
I would consider purchasing the 5usd strike price Calls with
an expiration date of 2024-12-20,
for a premium of approximately $0.50.
If these options prove to be profitable prior to the earnings release, I would sell at least half of them.

What is the best Proxy to BTC during a bull run....As Bitcoin continues goes mainstream, from Bitcoin ETFs, to El Salvador, the first nation to adopt Bitcoin as legal tender, steadily adding to its Bitcoin reserves every day since March 16 2024.... The question remains, what are some of the best Proxies to Bitcoin...
This chart shows a few stocks trading as proxies to Bitcoin.

Bullish Pennant breakout for Hive! $39 CAD price target.Hive appears to be trading in multiple bullish patterns.
Noticeably the stock is creating higher lows and higher highs forming a bullish pennant & a crude bull flag pattern.
Hive has bounced off the upward sloping support of the pattern 4-5 times, displaying strong support for the bulls.
Considering Hive is correlated to the price of Bitcoin & Ethereum we should see some volatile price action over the upcoming months heading into the US presidential elections..
Bullish cross on the KST
Also, the halving will start being priced into bitcoin as a supply shock is on the verge of occurring near term.

HIVE long,medium,short-term plans. Technical and fundamental Hello, friends! This is Shark, and today we'll be discussing the technical and fundamental analysis of HIVE stocks (a mining company). We'll explore long-term, medium-term, and short-term plans.
Technical Analysis:
Long-term Trading Plan (pink color)
Timeframe: 1 month
Global support level: $1.50
Global resistance level: $26.25
Channel step: 1650%
Notice the global ascending trend line drawn through the minimum price values. Currently, the asset's price has exceeded it, indicating a potential drop. The long-term scenario will be activated once the asset's price breaks below the support of this ascending trend line.
Medium-term Trading Plan (blue color)
Timeframe: 1 week
Resistance level: $7.18
Support level: $2.20
Channel step: 226%
Pay attention to the ascending trend line drawn through the lows. It's drawn on the weekly timeframe, and currently, the price is at its support, presenting the best time to buy this stock. The potential for medium-term trading is 226%. Also noteworthy are the decreasing highs, through which a descending trend line is drawn, forming a graphical structure of a "flag" or "contracting triangle," indicating an accumulation phase. Aggressive purchases should be considered above the $2.77 level.
Short-term Trading Plan (yellow color)
Timeframe: 1 day
On the chart, a descending trend line of yellow color is drawn. As long as the price stays below it, the trend is downward, and all levels marked on the daily timeframe are resistances. The potential for short-term trading to all levels is indicated. It's also worth noting the significant support level formed by the gap, presenting the best opportunity to buy the asset, as there's a market rule that aggressive asset growth should occur after covering all gaps. The short-term buying plan will be activated upon breaking the descending trend line.
Fundamental Analysis:
Mining Industry:
HIVE Blockchain Technologies is a company specializing in cryptocurrency mining, such as Bitcoin and Ethereum. Therefore, the fundamental state of the cryptocurrency market as a whole will heavily influence HIVE stocks.
Cryptocurrency Price Dynamics:
Changes in cryptocurrency prices, especially Bitcoin and Ethereum, will significantly impact the profitability of mining companies, including HIVE. High cryptocurrency prices usually lead to increased miner profitability, which can result in HIVE stock price growth.
Technological Innovations:
HIVE's success will also depend on its technological innovations and ability to enhance mining efficiency. Investors will be monitoring the company's new developments and improvements in equipment and software.
Cryptocurrency Regulation:
Changes in cryptocurrency legislation and regulation can have a significant impact on HIVE's business. Positive decisions or support from authorities can promote the company's growth, while negative measures may adversely affect its prospects.
Historical Events:
The company's past successes and failures can also influence its future value. Investors will analyze HIVE's history, including its financial results, strategies, and response to market changes, to make forecasts regarding its future success.
Considering these factors, investors should carefully assess the risks and opportunities associated with investing in HIVE stocks and make decisions based on a comprehensive analysis of the company's fundamental and technical aspects, as well as the cryptocurrency market as a whole.
If you enjoyed the review and would like more similar ideas, please like! Share your opinion on this asset in the comments below. Don't forget to subscribe to the channel to not miss new videos and updates. Thanks for watching, see you soon!

HIVE LongAnother breakout. Looking very bullish.
In a bull run if we can follow bitcoin movement and take advantage of the breakouts, then chances are we get some good returns.
Any other breakouts anyone?

HIVE/USDT Bullish move from support?👀 🚀Hive Today analysis💎Paradisers, #HIVEUSDT is currently on the move, showing promising strength at its support level. There's a good chance it could rise above the $0.4136 resistance if it keeps up this positive momentum.
💎In the past, we've seen #HIVE follow a downward trend, consistently hitting lower peaks and troughs. A recent bounce from the $0.3689 support has bolstered the outlook for a bullish turn, especially as it's maintaining its pace at this support level to potentially climb past the resistance.
💎 Should #HIVE struggle to keep its momentum at the $0.3689 support, we're anticipating a bullish recovery from the next support at $0.3348. However, breaking below this point may lead to a further drop. Let's stay alert and ready to adapt our strategies as needed.

HIVEUSD 1WHIVE ~ 1W 📈
#HIVE Make purchases gradually after successfully breaking through this resistance line, with a minimum target of 20%++.

HIVE ANALYSIS (1D)From where we put the red arrow on the chart, a double correction has started.
The novelty of this double correction seems to be over.
By maintaining the green range, it can move towards the TPs.
Closing a daily candle below the invalidation level will violate the analysis.
For risk management, please don't forget stop loss and capital management
When we reach the first target, save some profit and then change the stop to entry
Comment if you have any questions
Thank You
