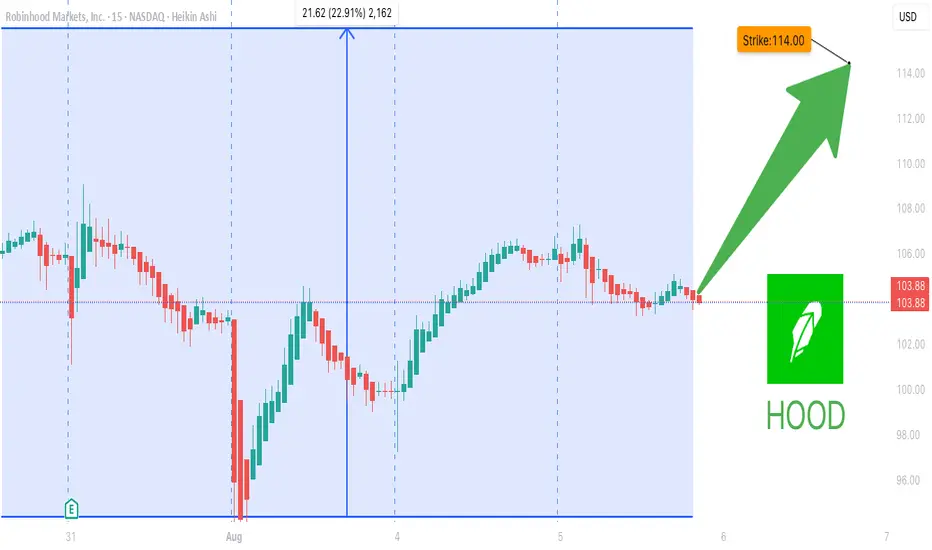
HOOD Lifetime Setup--Will You Miss It Again?### 🟢 **HOOD Options Flow Explodes: 2.05 Call/Put Ratio Sparks Bullish Firestorm 🔥**
**Will \$114 Be Breached This Week? Smart Money Thinks So.**
📈 **HOOD Weekly Options Breakdown – Aug 5, 2025**
---
#### 🔍 Market Snapshot:
* **Total Calls**: 178,756
* **Total Puts**: 87,243
* **C/P Ratio**: 2.05 → **BULLISH**
* **RSI**: Daily – 60.2, Weekly – 77.3 → **Uptrend Confirmed**
* **Volume**: 1.5x Previous Week → **Institutional Flow Detected**
* **Gamma Risk**: 🟡 Moderate
* **VIX**: 17.5 → Ideal for Weekly Plays
* **Time Decay**: 🔥 Accelerating
---
### 🧠 Consensus:
✅ All models confirm **strong bullish momentum**
⚠️ Some debate: Is rising volume accumulation or distribution?
---
### 🎯 Recommended Trade Setup:
> **Naked Call – HOOD \$114C (Exp: 2025-08-08)**
* **Entry**: \$0.79
* **Stop Loss**: \$0.40
* **Profit Target**:
* 🥇 Base: \$1.03 (+30%)
* 🥈 Stretch: \$1.58 (+100%)
* **Confidence Level**: 80%
* **Timing**: Enter @ market open
---
### 🔖 Tags (Hashtags for TradingView & Socials):
`#HOOD #OptionsFlow #CallOptions #BullishSentiment #WeeklyOptions #TradingStrategy #VolumeBreakout #RSI #Gamma #Robinhood #SmartMoneyMoves #HOODTradeIdea #TechnicalAnalysis #StockOptions #ViralTradeSetup`
HOOD
$HOOD – Flag Breakout Setup with Post-Earnings Shake & BakeNASDAQ:HOOD – Hot Momentum + Crypto Tailwind + Flag Breakout in Motion
Robinhood ( NASDAQ:HOOD ) is setting up for a momentum breakout after delivering a perfect post-earnings shake & bake — and now it’s reclaiming key levels with force.
🔹 The Setup:
After earnings, NASDAQ:HOOD flushed under $100, shaking out weak hands and triggering stop runs.
Since then, it's remounted the moving averages and is now pushing through the $107 breakout zone.
Price is flagging cleanly — compression before expansion.
🔹 Why It’s Got Juice:
Strong bounce post-earnings = real buyer interest.
Flag breakout forming with crypto sector strength ( CRYPTOCAP:BTC , CRYPTOCAP:ETH running).
NASDAQ:HOOD often rides crypto momentum — it’s a sleeper sector sympathy play.
🔹 My Trade Plan:
1️⃣ Position: Picked up $105 calls on the morning dip.
2️⃣ Add: Eyeing $110 calls with a few weeks out if we clear the flag.
3️⃣ Stop: Under today’s low or 9 EMA, depending on how it behaves into the breakout.
Why I Like It:
Shakeout + reclaim = powerful combo.
Flag structure is clean, volume is stabilizing, and crypto sector tailwinds add fuel.
When NASDAQ:HOOD runs, it runs fast — and it loves trending when sentiment flips.
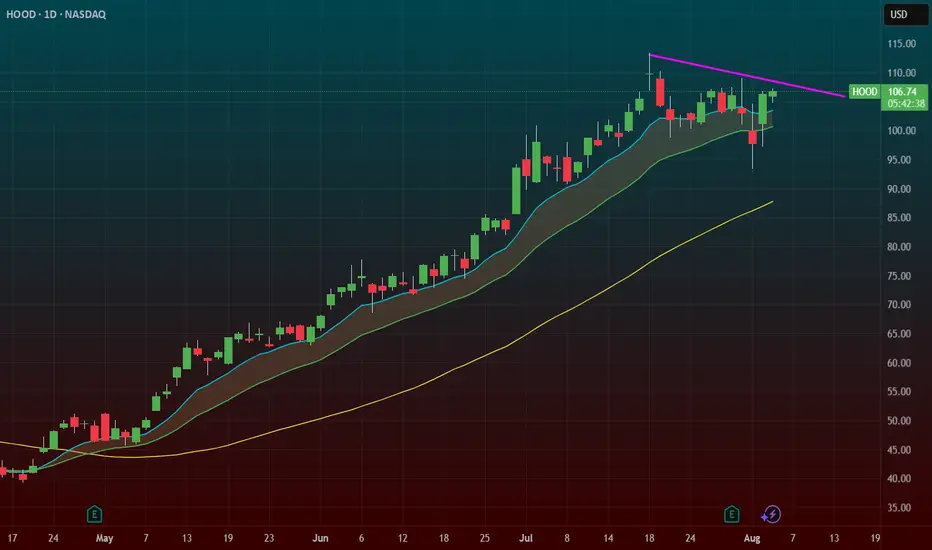
Hood Targeting The Hights
📈 **HOOD BULLISH SETUP - WEEKLY TRADE IDEA (08/03)** 📈
**Ticker:** \ NASDAQ:HOOD | **Bias:** 🟢 *Moderate Bullish*
🔁 **Call/Put Ratio:** 2.13 = **Strong Bullish Flow**
💼 **Volume:** 166K Calls vs. 78K Puts = Institutional Interest
📉 **Gamma Risk:** LOW | ⏳ **Time Decay:** Moderate
🔥 **TRADE SETUP** 🔥
• 💥 **Buy CALL @ \$109**
• 💰 *Entry:* \$0.85
• 🎯 *Target:* \$1.70 (100% ROI)
• 🛑 *Stop Loss:* \$0.43
• ⏰ *Expiry:* 08/08/25 (5DTE)
• 🧠 *Confidence:* 65%
• 📈 *Size:* 5 contracts
• 🕒 *Entry Timing:* Market Open
💡 **Why it matters:**
Despite mixed RSI and conflicting trend models, **massive call volume + low gamma risk** supports a short-term breakout play.
📌 **Watch for confirmation at open. Tight risk/reward. High upside if momentum holds.**

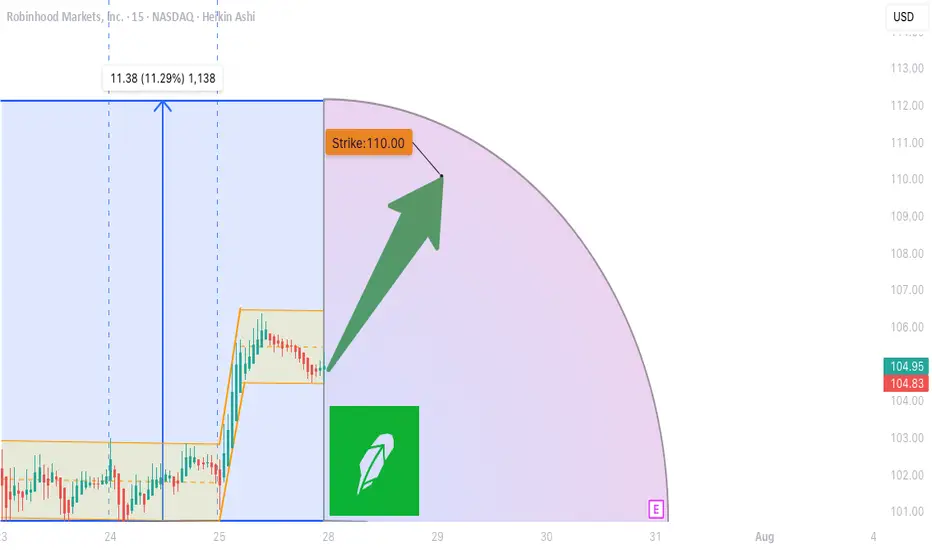
HOOD WEEKLY OPTIONS TRADE (7/31/25)
### ⚡️HOOD WEEKLY OPTIONS TRADE (7/31/25)
📈 **Setup Summary**
→ Weekly RSI: ✅ Rising
→ Daily RSI: ❌ Falling (⚠️ Short-term pullback risk)
→ Call/Put Ratio: 🔥 **1.89** (Bullish flow)
→ Volume: 📉 Weak — fading conviction
→ Gamma Risk: 🔥 High (1DTE)
---
💥 **TRADE IDEA**
🟢 Direction: **CALL**
🎯 Strike: **\$110.00**
💰 Entry: **\$0.82**
🚀 Target: **\$1.62** (+100%)
🛑 Stop: **\$0.41**
📆 Expiry: **Aug 1 (1DTE)**
🎯 Entry: Market Open
📊 Confidence: **65%**
---
🧠 **Quick Insight:**
Mixed signals = *Scalper’s Playground*
✅ Weekly trend favors upside
⚠️ Weak volume & daily RSI divergence = TRADE LIGHT
---
📌 Posted: 2025-07-31 @ 11:53 AM ET
\#HOOD #OptionsTrading #WeeklyPlay #GammaScalp #TradingViewViral #HighRiskHighReward

HOOD WEEKLY TRADE IDEA (07/27/2025)
**🚨 HOOD WEEKLY TRADE IDEA (07/27/2025) 🚨**
**BULLISH OPTIONS FLOW MEETS EVENT RISK CAUTION**
📊 **Options Flow Snapshot:**
📈 **Call Volume > Put Volume**
🧮 **Call/Put Ratio: 2.30** → **Institutional Bullish Flow**
📈 **Momentum Readings:**
* 🟢 **Daily RSI: Bullish**
* 🟡 **Weekly RSI: Mixed to Weak**
➡️ *Momentum is short-term positive, but not confirmed long-term*
📉 **Volume Insight:**
* **Only 0.7x** last week’s volume
➡️ *Lack of participation = ⚠️ caution*
🌪️ **Volatility Environment:**
* ✅ **Low VIX = Great Entry Timing**
* ❗ Fed Meeting ahead = Binary Event Risk
---
🔍 **Model Consensus:**
All 5 models (Grok, Claude, Gemini, Meta, DeepSeek) say:
🟢 **Moderately Bullish Bias**
✅ Bullish options flow
✅ Daily RSI uptrend
⚠️ Weak volume + Fed caution
---
💥 **TRADE SETUP (Confidence: 65%)**
🎯 **Play:** Long Call
* **Strike**: \$110
* **Expiry**: Aug 1, 2025
* **Entry**: ≤ \$2.90
* **Profit Target**: \$5.80 (🟢 100%)
* **Stop Loss**: \$1.47 (🔻50%)
📆 Entry: **Market Open Monday**
📦 Size: 1 Contract
📈 Risk-Reward Ratio: \~1:2
---
🧠 **Key Risks:**
* 📉 Volume Weakness = No confirmation
* ⚠️ **FED Event Risk** = Watch for Wednesday volatility
* ⏳ Theta decay as expiry nears
---
📌 **JSON TRADE DETAILS (for bots/scripts):**
```json
{
"instrument": "HOOD",
"direction": "call",
"strike": 110.0,
"expiry": "2025-08-01",
"confidence": 0.65,
"profit_target": 5.80,
"stop_loss": 1.47,
"size": 1,
"entry_price": 2.90,
"entry_timing": "open",
"signal_publish_time": "2025-07-27 15:09:35 EDT"
}
```
---
🔥 Stay sharp. Ride the flow, respect the risk.
👀 Watch volume + Fed headlines!
💬 Tag your team: \ NASDAQ:HOOD Bulls loading?
\#HOOD #OptionsTrading #UnusualOptions #FedWeek #WeeklyTradeSetup #TradingView #StockMarket
Using the Fractal Alligator IndicatorAccording to the Fractal Alligator in TradingView, we have come to a top/peak of HOOD stock price.
Using a 4 hour chart we can clearly see that green triangle, marking our top.
However when viewing the daily chart, there is no "top" green triangle.
This indicator is great, if you try it on different timeframes.
Give it a try and comment here for more feedback on this indicator.

HOOD WEEKLY TRADE IDEA – JULY 21, 2025
🪙 NASDAQ:HOOD WEEKLY TRADE IDEA – JULY 21, 2025 🪙
📈 Flow is bullish, RSI is aligned, and the options market is betting big on upside.
⸻
📊 Trade Setup
🔹 Type: Long Call Option
🎯 Strike: $118.00
📆 Expiry: July 25, 2025 (4DTE)
💰 Entry Price: $0.68
🎯 Profit Target: $1.36 (💯% Gain)
🛑 Stop Loss: $0.41 (~40% Risk)
📈 Confidence: 75%
🕰️ Entry Timing: Monday Open
📦 Size: 1 Contract (Adjust to risk tolerance)
⸻
🔥 Why This Trade?
✅ Call/Put Ratio = 1.83 → Bullish sentiment
✅ Strong Open Interest at $116 and $118 strikes → Institutions leaning long
🧠 RSI aligned → Technical confirmation of trend
💥 VIX stable → Favors long premium trades
📈 All models rate this as bullish, despite weak volume
⸻
⚠️ Key Risks
🔸 Volume light – fewer confirmations from broader market
⏳ Only 4 DTE → Theta risk accelerates fast after Wednesday
🛑 Tight stop is key – don’t hold through a drift
📉 Exit before Friday’s decay spike unless target is in sight
⸻
💡 Execution Tips
🔹 Get in early Monday — best pricing pre-momentum
🔹 Trail if up >30–50% early in the week
🔹 Exit by Thursday EOD unless strong momentum
⸻
🏁 Verdict:
Momentum + Flow + Technicals align.
Just don’t let the time decay catch you sleeping.
NASDAQ:HOOD 118C – Risk $0.41 to Target $1.36 💥
Clean setup. Strong structure. Watch volume confirmation midweek.
⸻
#HOOD #OptionsTrading #CallOptions #WeeklySetup #TradingViewIdeas #GammaFlow #BullishFlow #UnusualOptionsActivity #ThetaRisk #Robinhood

$HOOD Swing Trade – Riding the Rocket or Chasing the Wick?
🚀 NASDAQ:HOOD Swing Trade – Riding the Rocket or Chasing the Wick? 📈
📅 Posted: July 18, 2025
💡 Strong momentum, but no institutional push – is this the top or just getting started?
⸻
🧠 Multi-AI Model Summary
Model Consensus 🟢 Cautiously Bullish
RSI (Daily): 78.5 → 🚨 Overbought territory
5D/10D Perf: +8.49% / +9.29% → 🔥 Hot trend
Options Flow: Neutral (1:1 call/put) → 💤 No strong hands
Volume: Avg (1.0x) → ❌ Weak confirmation
VIX: Low (<20) → ✅ Swing-friendly environment
“Momentum is there, but it’s skating on thin volume. Institutions are silent. Proceed with caution.”
⸻
🎯 Trade Setup – HOOD Call Option
• Strike: $110.00
• Expiry: August 1, 2025
• Entry Price (Premium): $6.30
• Profit Target: $8.10 (≈ +28.6%)
• Stop Loss: $3.80 (≈ -40%)
• Size: 1 contract
• Confidence: 65%
• Entry Timing: At market open
• Key Watch Zone: Needs breakout above $108 with rising volume for confirmation
⸻
⚠️ Risk Radar
• 📉 RSI 78.5 = high pullback risk
• 🧊 Volume lacks institutional bite
• 📊 Neutral options flow = market unsure
• 🔄 No trade? → If price opens flat or drops below $106 with low volume — sit out
⸻
🧪 Strategy Tip
This is a momentum-chaser’s trade, not a conviction play. If you’re in, monitor aggressively. Take partial profits if momentum fades.
⸻
📊 TRADE SNAPSHOT
{
"instrument": "HOOD",
"direction": "call",
"strike": 110.0,
"expiry": "2025-08-01",
"confidence": 0.65,
"profit_target": 8.10,
"stop_loss": 3.80,
"size": 1,
"entry_price": 6.30,
"entry_timing": "open",
"signal_publish_time": "2025-07-18 14:04:07 UTC-04:00"
}
⸻
🔁 Like + Repost if you’re watching HOOD’s next move
💬 Comment below: Momentum magic or rug risk?

Party Over? Time to get back to senses!- NASDAQ:HOOD valuation is way stretched and it should correct to a reasonable valuation.
- This needs correction. Let's see how it folds out in next 6-12 months

HOOD - Get Great PricingNASDAQ:HOOD and I have had a mixed relationship over the years. I have had my biggest win on the HOOD brokerage (5,000% options trade, $1200 into 60k) and at the same time I was present for the Derogatory removal of the GME button (of which I had sold before they took that button).
After many years and brokerages, I find myself returning to HOOD but this time much more experience... To my surprise, I love the platform, and I still recommend it for new traders for the ease and UI. Honestly, unless you are dealing with BIG Volume or Hot-Keying out of Low float Penny stocks, It will suit you just fine.
Now Let's Talk HOOD.
In this MASSIVE range we are looking at High $67, and a Low of $35. Thats a 47% drop!
Although we have recovered a bit, Many are eager to find a way to get in the range. Here I have put together 2 scenarios to help you play your position with confidence.
Better Price = Better psychology
Whether we are shopping at grocery store, or if we are buying a car. Getting a good deal feels better. But how do you feel when you know you overpaid?
TLDR: The best deals are the lowest purple zone "Extreme Demand" if you are Long, "Reinforced Supply" (at the top) if you are looking to get short or take profit.
Under the HOOD
Currently Robinghood is running into a little bit of a supply zone labelled "Weak Supply"
This is a new player, and we don't yet know how just how big this player is. So far they have absorbed some of that buying pressure coming in, but I would not be surprised if they we overtaken or even gapped above come Monday. This brings us to our first Scenario
Scenario 1: Blue line
With the break above "weak supply", there is headroom all the way until 51.74. This is where we will see some supply initially and maybe a small rejection.
Why would it not reject back down to a demand area like 41? Great question.
If this overtakes that "Weak Supply" zone, this will make a strong case that there is momentum behind the wheels here. I think there will be a new player reinforcing this buying if this happens all the way to the Finale at $58.01. From here I would consider taking some profits, maybe partials, or looking for some Puts.
Scenario 2: Red line
Getting Rejected by "Weak supply" would be evidence that this move was fluff. Those two demand zones may try to hold a bit, but with the lack of buying interest in the
$45 area, this won't make those buyers feel confident.
This is different story when comparing to the "Extreme Demand" zone (lowest purple zone). Buyers here have PROVEN that this is something they are very interested and they are not done accumulating yet. So from this location buyers feel confident that they are getting a good price*( see fn. )
From here this should drive demand up again, crushing shorts, and sending another nice squeeze to test that supply at 51.71
WHEW! if you made it this far, I appreciate your time!
Upvote/Follow if you enjoyed this idea, there are many more to come!
Happy trading!
* (This is a good price, because buyers are showing that it is. Although, if it did come down here, this would be the 4th test of this area. I still think there will be strong demand here, but this isn't the best tests. 2nd and 3rd were stronger.)

HOOD — In Key Macro Resistance ZonePrice has reached a major resistance zone, with the 110 level marking an ideal spot where downside pressure may begin to dominate and a mid-term top could start forming. Macro support for the macro-uptrend structure is at the 80–65 area.
Hedging near current levels may be prudent - especially ahead of earnings and while volatility remains relatively cheap.
Weekly view
Daily view:
Thank you for your attention and I wish you successful trading decisions!
webull buy x robinhood buy webull: 24 million registered users and 4.7 million funded accounts managing $12.6 billion in assets as of Q1 2025
x
Robinhood: recently launched tokenized U.S. stocks and ETFs in Europe, enabling round‑the‑clock 24/5 crypto‑style trading and exposure to private companies like SpaceX and OpenAI : Mizuho raised its price target to $99, Cantor Fitzgerald to $100, and KeyBanc to $110 Q4 2024 EPS estimates up 322% year-over-year, and full-year 2024/25 earnings forecasted to grow by 231%/22%
bigger picture
Retail now constitutes roughly 20–21% of daily trading volume
Brokerages like Webull and Robinhood, offering strong margins, advanced tools, and retail accessibility, are driving the new wave of democratized finance empowering traders amid record market participation and innovation. lots of volume here
should expect these two to have a good quarter and next
price target by end of july
NASDAQ:BULL 16.00 range
NASDAQ:HOOD 101.00+

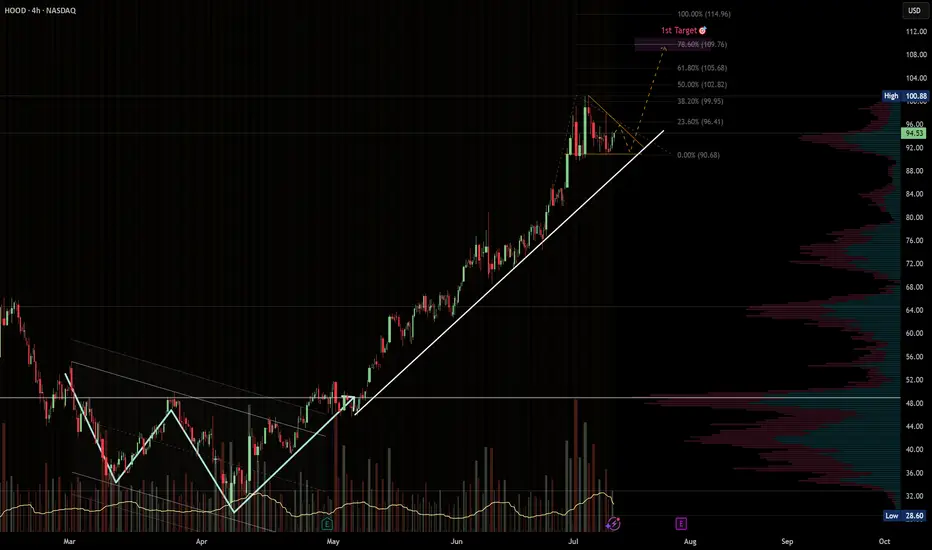
HOOD · 4H — Bullish Continuation Setup Targeting $109 → $115Pattern Overview
HOOD has been riding a strong ascending trendline since early May, respecting higher highs and higher lows all the way up.
After the most recent parabolic move from ~$90 to ~$101, price is now consolidating in a bullish pennant, just above key fib levels.
The setup looks primed for continuation if we see a breakout above $101 with confirming volume.
---
🎯 Target Zones
🎯 Target Level Why It Matters
Target 1 $109.76 78.6% Fibonacci extension from the previous leg. Common spot for intermediate take-profit. Also matches a soft VPVR resistance area.
Target 2 $114.96 100% measured-move projection of the prior rally. If momentum accelerates, this becomes a realistic stretch zone.
---
🛠️ Trade Plan (Example)
Component Level
Trigger Break and hold above $101 with volume ≥ 20-SMA.
Add-on Opportunity Pullback into $96–97 that respects the rising trendline.
Stop-loss Close < $92.5 invalidates trendline.
TP-1 $109–110 — take partials, move stop to breakeven.
TP-2 $114–115 — full exit or runner trail zone.
---
⚠️ Risk Notes
Watch for false breakouts — confirmation needs volume and price stability above $101.
Earnings or macro news could override technicals. Use tighter stops ahead of event dates.
If trendline fails, next key support sits at $89–90 (previous consolidation base).
---
✅ Trade Checklist
Bullish trendline intact
Continuation pennant forming
Fib & measured move confluence at $109–115
Volume profile supports clean move above $101
Clear invalidation under $92
> Disclaimer: This is not financial advice. Always trade your own plan and manage risk appropriately.
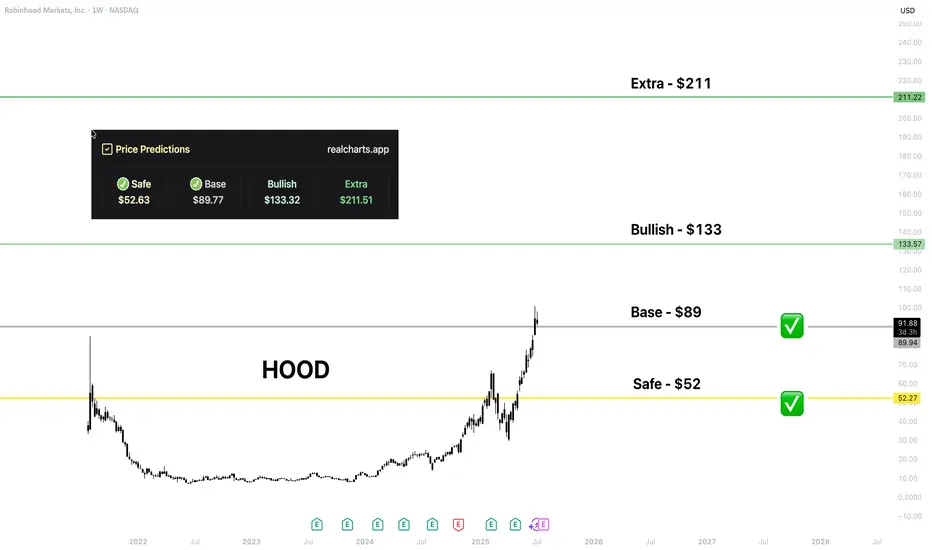
HOOD | Price PredictionI love that NASDAQ:HOOD has made a huge step in crypto integration.
That level is from my platform. I hope HOOD holders would be happy to get every level; time will show!
VLAD impaling WALL ST!I believe Robinhood will achieve over One Trillion dollars in assets in very short order.
Giant Cup and Handle is your technical setup.
(I have covered hood at the low)

Sklz 7.55-8.09 new floor ?!Big volume, i think july 18 calls are micely valued for 7$
Based on chart purely, i think the set up is there for the move north.
Big volume spike on 4hr looking like a nice green week. SKLZ ANS PARADISE TO THE MOON. 10$ by december
Not financial advice but i think its a nice price.

Time to take profits on Robinhood, it's extremely overboughtit's just about time for profit taking with summer here. Aiming for around $45-50 prior resistance turns to support, to buy back in at the 0.618 golden fib level as well.

Trump’s $1,000 baby accounts: what it means for markets President Trump’s “Trump Accounts” proposal would give every American newborn a $1,000 investment account placed in a stock market index fund, managed by the child’s guardians. The plan is part of the Big Beautiful Bill and has support from CEOs including Nvidia’s Jensen Huang, who called it “a seed fund for America’s next generation.”
If passed, the plan could drive consistent inflows into U.S. equity markets and benefit platforms like Robinhood, Vanguard, and BlackRock. Robinhood’s CEO will attend the White House event announcing the plan.
Robinhood shares are trading near multi-year highs, boosted by strong earnings and the acquisition of crypto exchange Bitstamp.
Shares also rallied recently on hopes the company would be added to the S&P 500, an inclusion that typically attracts passive fund inflows. While it wasn’t selected in the latest rebalancing, continued growth keeps it on watch for future inclusion.

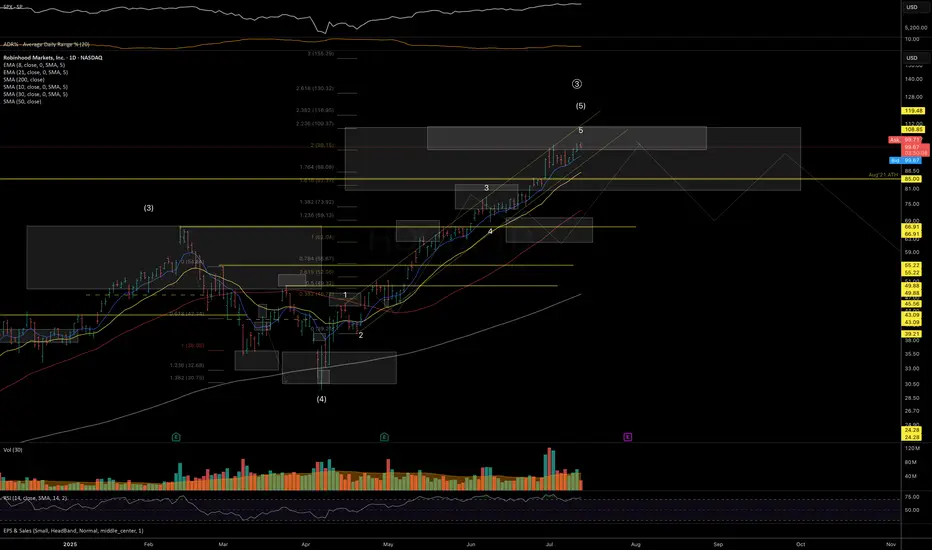
HOOD (Robinhood) - Price Above Bollinger Band and Shooting StarsHOOD (Robinhood) stock price has been in an uptrend since May 2025.
Recent fundamentals such as corporate earnings, EPS, Revenue, Acquisitions have been good in Q2 2025.
However currently, HOOD price has printed 2 shooting stars above the upper bollinger band and linear regression lines (blue arrow).
Potential selling and profit-taking could occur, especially if there is a significant bearish catalyst or news in the stock market.
A -4% or -8% move selloff could occur over time if the price gaps up to an overextended level too fast, such as $80 to $85.
Both the weekly and daily charts are starting to show bearish divergence so I am watching both the technicals and fundamentals this month.

HOOD Swing Trade Plan – 2025-06-06🚀 HOOD Swing Trade Plan – 2025-06-06
Bias: Bullish (High Momentum + Catalyst)
Timeframe: 5–10 days
Catalyst: S&P 500 inclusion speculation, crypto rally, retail momentum
Trade Type: High-conviction naked call option
🧠 Model Summary Table
Model Direction Strike Entry Price Target(s) Stop Confidence
Grok Strongly Bullish $80 $3.90 +100% -50% 85%
Claude Moderately Bullish $78 $4.67 +50–150% -40% 75%
Llama Moderately Bullish $80 ~$3.85 $5.00+ < $75 or -50% 80%
Gemini Strongly Bullish $80 ~$3.88 $5.00 / $7.00+ < $75 or -50% 70%
DeepSeek Moderately Bearish $70 PUT $1.70 $2.50 / $3.40 > $79.17 or -50% 75%
✅ Consensus: Strong bullish trend supported by technicals and macro catalysts
⚠️ Bearish Divergence: DeepSeek warns of exhaustion risk
📈 Technical & Sentiment Summary
Price Action: Trading above all EMAs; price extended above upper Bollinger Bands
RSI: Extreme overbought across daily timeframes (RSI > 80)
MACD: Strongly positive on all models (15m, daily, weekly)
Sentiment: Positive S&P 500 inclusion buzz, retail FOMO, and crypto tailwinds
VIX: Falling → favorable for long calls
Max Pain: $66 (could cause pull later in expiry week)
✅ Final Trade Setup
Parameter Value
Instrument HOOD
Direction CALL (LONG)
Strike $80.00
Expiry 2025-06-20
Entry Price $3.90
Profit Target $5.85 (50% gain)
Stop Loss $1.95 (50% loss) or HOOD < $75
Size 1 contract
Entry Timing At market open
Confidence 75%
💡 Rationale: Aligns with dominant trend and event-driven momentum. Best R/R with defined risk on extreme FOMO move.
⚠️ Risks & Trade Watchouts
RSI overbought → any market pullback could hit stop quickly
S&P inclusion may trigger “sell the news” reaction
Theta decay risk intensifies late next week
Max pain at $66 could drag prices if momentum fades mid-week
RobinHood - Urgent News - Afterhours SelloffOn June 6, 2025, S&P Dow Jones Indices announced no changes to the S&P 500 index in its quarterly rebalance, marking the first such instance since March 2022. This decision notably excluded Robinhood Markets Inc., despite speculation that it might be included due to its market capitalization exceeding $20.5 billion and recent strong performance. Following the announcement, Robinhood's stock declined over 5% in after-hours trading
The next S&P500 quarterly rebalancing is set for September 2025....perhaps the next leg higher needs to wait until them
As of June 6, market close, Robinhood's stock is trading at $74.88, with a market capitalization of approximately $36.85 billion. The company has experienced significant growth, with a 365% increase in stock price over the past 12 months and a 50% surge to start 2025. Analysts project continued revenue and earnings growth, with an average one-year price target of $51.19 per share
We issued put option alerts to our members and shorted this live stream on Friday afternoon.

Why is ROBINHOOD dropping in afterhours? Robinhood's stock (HOOD) is dropping in after-hours trading due to several factors:
1. Regulatory Scrutiny: The company is facing increased attention from regulators, particularly regarding its expansion into unconventional financial offerings like sports betting-related features.
2. Analyst Downgrade: Wolfe Research recently downgraded Robinhood's stock from "Buy" to "Hold," citing valuation concerns and suggesting that the stock's upside potential has already been priced in.
3. Competitive Pressure: Traditional banks and fintech startups are ramping up their offerings, making it harder for Robinhood to maintain its market dominance.
4 Investor Uncertainty: Some investors are skeptical about Robinhood's new ventures, such as its push into banking services and prediction markets, which blur the lines between trading and gambling.
5. Technical Resistance: A clear parallel channel is bringing Hood back to planet earth. This stock has had a 160% run with minimal pullback, profit taking is highly likely.

Why is HOOD still 1/3rd of SCHW? Wealth management remains the last bastion of success for Charles Schwab. Long-term cash, mutual fund, and retirement accounts create an enormous balance sheet, which accures value and reduces fees across the board. I'm hard pressed to see however how NASDAQ:HOOD will not inherit that class of customers as baby boomers pass on their generational wealth to the millenial generation. Do we begin to see a transition of assets from megacaps like NYSE:SCHW in the next 24 - 36 months? I'd say most likely.
