#HOOK/USDT | Long Bias ?#HOOK
The price is moving within a descending channel on the 1-hour frame, adhering well to it, and is on its way to breaking it strongly upwards and retesting it.
We have a bounce from the lower boundary of the descending channel. This support is at 0.0882.
We have a downtrend on the RSI indicator that is about to break and retest, supporting the upside.
There is a major support area in green at 0.0857, which represents a strong basis for the upside.
Don't forget a simple thing: ease and capital.
When you reach the first target, save some money and then change your stop-loss order to an entry order.
For inquiries, please leave a comment.
We have a trend to hold above the 100 Moving Average.
Entry price: 0.0941
First target: 0.0989
Second target: 0.1045
Third target: 0.1121
Don't forget a simple thing: ease and capital.
When you reach the first target, save some money and then change your stop-loss order to an entry order.
For inquiries, please leave a comment.
Thank you.
HOOKUSD

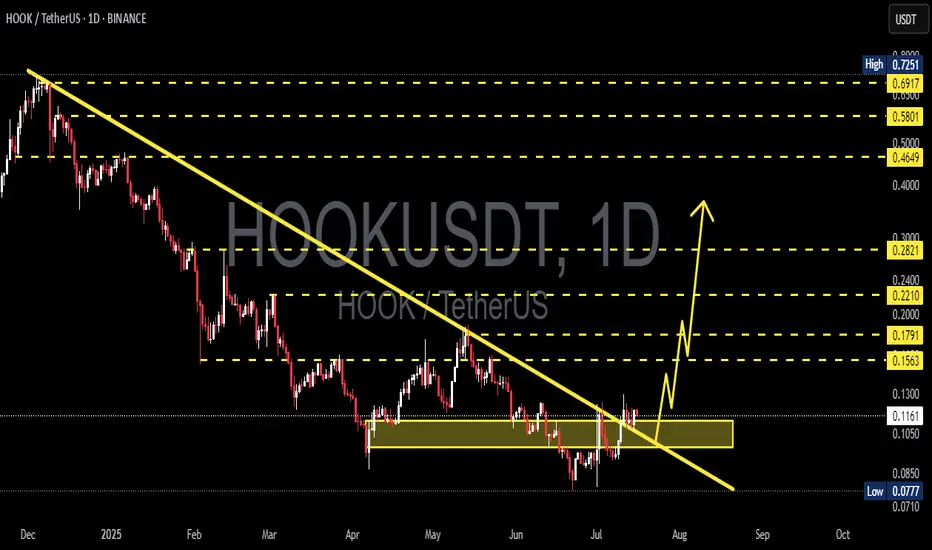
HOOK/USDT Major Downtrend Breakout — Reversal in Play🔍 Chart Overview
HOOK/USDT has finally broken out of its macro downtrend, which had been holding the price down since December 2024. This breakout is not just a technical move — it could mark the beginning of a mid- to long-term reversal. The price is now retesting the breakout area (yellow box), offering an ideal entry point before a potential rally.
📈 Pattern & Technical Structure
🟡 1. Breakout from Long-Term Downtrend
The yellow trendline shows a 7-month-long bearish trendline.
Price has now closed daily candles above this line, indicating a clear shift in market structure.
The breakout occurred after a sideways accumulation phase between $0.1050 – $0.1200, which also acts as a demand zone.
🟢 2. Inverse Head and Shoulders (IH&S) Pattern
Left and right shoulders formed around $0.1050
Head formed at the $0.0710 – $0.0777 zone
Price has broken above the neckline, validating the IH&S reversal pattern
📊 3. Volume & Momentum
Increased volume during the breakout confirms strong buying interest
If the retest holds, bullish momentum could accelerate toward key resistance levels
🟢 Bullish Scenario (Positive Outlook)
If price holds above the retest zone ($0.1167 – $0.1200) and confirms support:
Bullish Targets:
1. $0.1300 – Nearest minor resistance
2. $0.1563 – Breakout confirmation zone
3. $0.1791 – Psychological and fib confluence
4. $0.2210 – IH&S pattern target
5. $0.2821 – Key horizontal resistance
6. $0.4649 – $0.5801 – Golden pocket zone (Fibonacci retracement)
✅ Potential ROI: 100%+ from current levels
🔴 Bearish Scenario (Negative Outlook)
If HOOK fails to hold above $0.1050:
The breakout may become a false breakout (bull trap)
Price could fall back toward $0.0850
A deeper drop toward $0.0777 – $0.0710, the last major demand zone
🚫 Breakdown below this zone would re-enter a long consolidation phase
🎯 Conclusion & Strategy
HOOK is at a critical turning point. A confirmed breakout from the macro downtrend + IH&S pattern signals a high-probability bullish reversal. The current pullback serves as a textbook retest — a prime area for entries.
Aggressive traders can consider entering now with SL below $0.1050. Conservative traders may wait for confirmation candles above $0.1300.
✅ Quick Checklist:
✅ Confirmed breakout from macro downtrend
✅ Inverse Head and Shoulders pattern active
✅ Volume spike supports breakout
✅ Retest in progress at key demand zone
#HOOKUSDT #HookBreakout #CryptoReversal #AltcoinSeason #InverseHeadAndShoulders #TechnicalBreakout #CryptoAnalysis #ChartPattern #TradingSignals #HookAnalysis #BreakoutCrypto
#HOOK/USDT#HOOK
The price is moving in a head and shoulders pattern on the 1-hour frame, adhering well to it, and is heading for a strong breakout upwards and retesting it, forming the right shoulder.
We have a bounce from the lower channel line to the right shoulder, which is support at 0.0890.
We have a downtrend on the RSI indicator that is about to be broken and retested, supporting the upside.
We have a trend of consolidation above the 100 moving average.
Entry price: 0.0970
First target: 0.1000
Second target: 0.1039
Third target: 0.1096

Will #HOOK Continue to Rise or a Trap is Being Set? Must Watch Yello Paradisers! Have you seen the recent price action of the #HookedProtocol or not? Let's see what's happening with #HOOK and its next move:
💎#HOOKUSDT has been moving in a clear falling wedge pattern, with price respecting both the descending resistance and support levels since late April. After multiple rejections from the lows, we finally saw a breakout from the wedge, which is a potential sign that bulls are preparing for a shift in structure.
💎Currently, #HOOKUSD is trading near 0.1120, and the 50EMA is now acting as support, which increases the probability of a continued move higher. The first area we are watching is 0.1242, which now acts as the moderate resistance. If the market manages to hold above this level, it opens up the path toward 0.1938, the next strong resistance, and a level where profit-taking becomes critical.
💎However, if bulls fail to hold the structure and price breaks back below 0.0779, then the entire bullish setup becomes invalid. In that case, we’ll likely revisit the 0.0600 region, and the trapdoor opens for late buyers who ignored the warning signs.
Stay sharp, Paradisers. The market is about to pick a side and we’ll be on the right one.
MyCryptoParadise
iFeel the success🌴

HOOKUSDT 1D AnalysisHOOK ~ 1D Analysis
#HOOK Buy gradually from here if you still have conviction in this coin, with a short-term target of at least 10%+ from this point.

#HOOK/USDT#HOOK
The price is moving in a descending channel on the 1-hour frame and is expected to continue upwards
We have a trend to stabilize above the moving average 100 again
We have a descending trend on the RSI indicator that supports the rise by breaking it upwards
We have a support area at the lower limit of the channel at a price of 0.1560
Entry price 0.1700
First target 0.1800
Second target 0.1906
Third target 0.2030

#HOOK/USDT#HOOK
The price is moving in a descending channel on the 1-hour frame and is adhering to it well and is heading to break it strongly upwards and retest it
We have a bounce from the lower limit of the descending channel, this support is at a price of 0.1670
We have a downtrend on the RSI indicator that is about to break and retest, which supports the rise
We have a trend to stabilize above the moving average 100
Entry price 0.1740
First target 0.1816
Second target 0.1897
Third target 0.2000

#HOOK/USDT #HOOK
The price is moving in a descending channel on the 1-hour frame and is adhering to it well and is heading to break it strongly upwards
We have a bounce from the lower limit of the descending channel, this support is at a price of 0.2586
We have a downtrend on the RSI indicator that is about to be broken, which supports the rise
We have a trend to stabilize above the moving average 100
Entry price 0.2757
First target 0.2903
Second target 0.3046
Third target 0.3182

HOOKUSDT 6DHOOK ~ 6D
#HOOK This is the last support block for this coin. If you still have Conviction on this coin,. This support block would be a very good buying place for now,. Buy in stages with a minimum target of 20%+


Is HOOKUSDT Ready to Skyrocket or on the Verge of a Crash? Yello, Paradisers! Could #HOOKUSDT be gearing up for a major bullish breakout, or are we staring down the barrel of a steep drop? Let’s break down the key levels that could define the market’s next big move.
💎#HOOKUSDT has recently faced a strong rejection at the $0.6612 resistance level, a price point that has repeatedly acted as a significant barrier. While this rejection caused a temporary pullback, it doesn’t necessarily confirm a bearish trend. Instead, the action shifts to critical zones $0.5671 and $0.5293 which could determine whether we see a reversal or further decline.
💎The $0.5293 level aligns closely with the 0.5 Fibonacci retracement zone, often dubbed the “golden pocket.” Historically, this region serves as a pivotal area for price action. If HOOKUSDT stabilizes and consolidates here, it could act as the springboard for the next upward leg. Many traders are zeroing in on this area, anticipating a potential rally that could set the stage for new highs.
💎If the $0.5293 level doesn’t hold, the next support zone lies at $0.4512. A rebound at this lower demand zone could still preserve the bullish outlook, but a breakdown below $0.4512 would invalidate the setup entirely. Such a scenario could trigger a steeper decline, wiping out bullish sentiment and demanding traders exercise extreme caution.
It’s decision time, Paradisers. As the market flirts with these critical levels, patience and discipline will be your greatest allies. Wait for confirmations, whether you’re looking to ride the next breakout or hedge against a potential drop.
MyCryptoParadise
iFeel the success🌴

#Hook (SPOT) IN ( 0.3350- 0.4160) T. (1.5060) SL(0.3200)BINANCE:HOOKUSDT
entry range ( 0.3350- 0.4160)
Target1 (0.6680) - Target2 (0.8960)- Target3 (1.2403)- Target4 (1.5060)
SL .1D close below (0.3200)
______________________________________________________________
Golden Advices.
********************
* collect the coin slowly in the entry range.
* Please calculate your losses before the entry.
* Do not enter any trade you find it not suitable for you.
* No FOMO - No Rush , it is a long journey.
Useful Tags.
****************
My total posts
www.tradingview.com
1Million Journey
www.tradingview.com
www.tradingview.com
********************************************************************************************************************** #Manta ,#OMNI, #DYM, #AI, #IO, #XAI , #ACE #NFP #RAD #WLD #ORDI #BLUR #SUI #Voxel #AEVO #VITE #APE #RDNT #FLUX #NMR #VANRY #TRB #HBAR #DGB #XEC #ERN #ALT #IO #ACA #HIVE #ASTR #ARDR #PIXEL #LTO #AERGO #SCRT #ATA #HOOK #FLOW #KSM #HFT #MINA #DATA #SC #JOE #RDNT #IQ #CFX #BICO #CTSI #KMD #FXS #DEGO #FORTH # AST #PORTAL #CYBER #RIF #ENJ #ZIL #APT #GALA #STEEM #ONE #LINK #NTRN #COTI #RENDER #ICX #IMX #ALICE #PYR #PORTAL #GRT #GMT # IDEX #NEAR #ICP #ETH #QTUM #VET #QNT #API3 #BURGER #MOVR #SKL .

HOOKUSDT: Bullish SignalHOOKUSDT technical analysis update
HOOKUSDT has formed a triangle pattern on the daily chart, and the price is now moving towards a breakout. It has also crossed above the 100 EMA on the daily chart. A bullish move can be expected once the triangle breakout is confirmed.
Buy level: $0.50
Stop Loss: $0.44
Regards
Hexa

#HOOK (SPOT) entry range (0.3400- 0.4000) T.(1.5060) SL(0.3138)BINANCE:HOOKUSDT
entry range (0.3400- 0.4000)
Target1 (0.6680)- Target2 (0.8960)- Target3 (1.2403)- Target4 (1.5060)
SL .1D close below (0.3138)
*** Collect slowly in the entry range ****
*** wait the price to come to entry range***
**** #Manta ,#OMNI, #DYM, #AI, #IO, #XAI , #ACE #NFP #RAD #WLD #ORDI #BLUR #SUI #Voxel #AEVO #VITE #APE #RDNT #FLUX #NMR #VANRY #TRB #HBAR #DGB #XEC #ERN #ALT #IO #ACA #HIVE #ASTR #ARDR #PIXEL #LTO #AERGO #SCRT #ATA #HOOK ****

#HOOK (SPOT) entry range (0.4350- 0.4850) T.(1.5060) SL(0.4223)BINANCE:HOOKUSDT
entry range (0.4350- 0.4850)
Target1 (0.6680) - Target2 (0.8960)- Target3 (1.2403)- Target4 (1.5060)
SL .4H close below (0.4223)
*** collect the coin slowly in the entry range ***
*** No FOMO - No Rush , it is a long journey ***
**** #Manta ,#OMNI, #DYM, #AI, #IO, #XAI , #ACE #NFP #RAD #WLD #ORDI #BLUR #SUI #Voxel #AEVO #VITE #APE #RDNT #FLUX #NMR #VANRY #TRB #HBAR #DGB #XEC #ERN #ALT #IO #ACA #HIVE #ASTR #ARDR #PIXEL #LTO #AERGO #SCRT #ATA #HOOK #FLOW #KSM #HFT #MINA #DATA #SC #JOE #RDNT #IQ #CFX #BICO #CTSI #KMD #FXS #DEGO #FORTH # AST #PORTAL #CYBER #CLV #RIF ENJ #ZIL #APT #MAV #ZRX ****

HOOKUSDTHOOK ~ 3D ✅
#HOOK it is only a matter of time that this descending pattern is successfully broken. minimum target of 20%++ for the short term.

HOOKUSDTHOOK ~ 2D ✅
#HOOK Moving in a descending pattern for now. The best way to buy after this descending pattern is successfully broken is with a target of 10-20%+

#HOOK/USDT#HOOK
The price is moving in a descending channel on the 12-hour frame and is sticking to it very well and is expected to break it upwards
We have a bounce from a major support area in green at 0.5250
We have a downtrend on the RSI indicator that was broken upwards which supports the rise
We have a trend to stabilize above the 100 moving average which supports the rise
Entry price 0.4265
First target 0.5900
Second target 0.7240
Third target 0.8600

Is #HOOK on the Edge of a Major Breakout or a Breakdown?Yello, Paradisers! Are you ready to capitalize on the next big move with #HOOK? We’ve got our eyes on a potential game-changer!
💎#HookedProtocol ( NASDAQ:HOOK ) is currently navigating a descending channel, but things are heating up as it approaches a crucial demand zone at $0.405. This level could be the catalyst for a significant bullish breakout.
💎If the price finds support here and gathers momentum, we could see #HOOKUSDT soaring towards the key supply area at $0.73. Now, this is the critical part: a successful breakout above the descending resistance could pave the way for a strong bullish run, with the next target being the major resistance zone.
💎But let’s not get ahead of ourselves—if momentum falters and #HOOK gets rejected at the supply area, we might witness a pullback. Watch closely for a potential bullish rebound from the strong support between $0.31-$0.34.
💎However, caution is key. If #HOOK slips below this support level, it could spell trouble, trapping the price within the descending channel and possibly signaling a prolonged bearish trend.
Stay Focused, Patient, and disciplined Paradisers!
MyCryptoParadise
iFeel the success🌴

HOOKUSDT Long and Short analysis / be ready for 15% price move!BINANCE:HOOKUSDT
CRYPTO:HOOKUSD
Hello Traders, At first, I was bearish on HOOK. but when the price spikes above my indicated area, I am looking for a bearish entry setup. 🎯
💥📉HOOKUDST is near important are,
as long as the price is above 0.432 area, the Bullish scenario is active. If the price stabilizes below the 0.42 level, the bearish scenario will be activated.📈💥

#HOOK/USDT#HOOK
The price is moving within a bearish channel pattern on the 12-hour frame, which is a strong retracement pattern and was broken to the upside.
We have a bounce from a major support area in green at 0.4000
We have a tendency to stabilize above the Moving Average 100
We have a downtrend on the RSI indicator that supports the rise and gives greater momentum, and the price is based on it to rise after it was broken upward.
Entry price is 0.4800
The first target is 0.6700
The second target is 0.7800
The third goal is 0.9240

HOOK Technical Analysis: Potential for 200% gain.Hello everyone, I’m Cryptorphic.
For the past seven years, I’ve been sharing insightful charts and analysis.
Follow me for:
~ Unbiased analyses on trending altcoins.
~ Identifying altcoins with 10x-50x potential.
~ Futures trade setups.
~ Daily updates on Bitcoin and Ethereum.
~ High time frame (HTF) market bottom and top calls.
~ Short-term market movements.
~ Charts supported by critical fundamentals.
Now, let’s dive into this chart analysis:
HOOK was under a downtrend but respected the lower support trendline and showed a decent rebound of up to 45%.
Currently, HOOK needs to break above the primary resistance, ranging between $0.6437 and $0.7172, to rally higher to the $1.16 resistance trendline.
The RSI shows a rebound from the oversold range, indicating a shift in momentum from bearish to bullish.
- Support/Entry: $0.394 to $0.483.
- Primary Resistance: $0.6437 to $0.7172.
- Higher Resistance: $1.16.
DYOR, NFA.
Please hit the like button to support my content and share your thoughts in the comment section. Feel free to request any chart analysis you’d like to see!
Thank you!
#PEACE

HOOK is bearishFrom where we entered "start" on the chart, the HOOK symbol has entered a large correction, which seems to be a diametric pattern.
Wave B has just ended and price has entered wave C. Wave C is expected to continue up to the green range.
Note that you need a trading setup to enter the position.
Closing a daily candle above the invalidation level will violate the analysis.
For risk management, please don't forget stop loss and capital management
Comment if you have any questions
Thank You
