HOT

HOT is hotHOT have bottomed and if you buy it for 15cents projected what it can reach it 40cents which is about 180% gains

Hot On A Strong Support Level On The Daily I think HOT will continue up after this pullback and now we are on a good strong support level
Reasons why I enter this trade :
1-Good Support Level
2-Good pull back spot on the Ribonacci Retracement
3-Price does not break the moving average of 50 or 100
This is not investment advice, this is my personal opinion, and I am in this trade
Share your idea with me on the comment section
Thank you Guys
BINANCE:HOTUSDT

This is HOTHolochain, compare to the price of DOGE, is significantly undervalued. Remember to consult your financial advisor before investing in Cryptocurrency.


HOT/USDT : Pulled back from bearish trendline BINANCE:HOTUSDT
Hello everyone 😃
It seems that volatility wants to being bullish again !
It had a pullback from last broken bearish trendline.
Also it's above a support zone.
We expect a pressure on selling while HOT approaching MAs...
However some of the Indicators Specially volatility is being bullish on high timeframes ( 12H ) !!
🔴 We can say that market is recovering to reach 59K level on BTC;
Now everything is about recovery's duration...
Attention: this isn't financial advice we are just trying to help people on their own vision.
Have a good day!
@Helical_Trades


RED HOT! When is the housing market going to crash?I didn't say that this post is 'red hot'. And I don't know if or when the housing market is going to crash. The captioned question in a popular search engine rose 2,450% in the past month! That must be super red hot! What's the RSI on that? 😄😂 Expand the chart by pressing the + icon, for a clearer view.
There is extreme chatter in the blogosphere about housing bubbles and crashes. Some want to understand why all the interest in that. After all if something doesn't make sense what's the point of paying any further interest. Oh - except if it's US Equities and Bitcoin - right? I get it - some see sense in Bitcoin and Stock indices going north so they're ploughing their money into those two. The 'sense' is ' The FED has my back.. I'll hedge against a crashing US Dollar! '. That's all people know - I'm often told. Has the FED got your back on the price of your house? I don't think so. But I could be wrong. I'm actually wrong about 60% of the time. And nothing here is advice, anyway. So nothing I say seeks your belief.
Ahhh.. so what's that crazy spike in searches on the question? Could some be worried? Oh yes the 'some' are probably those who made a killing; now looking for signs of a true peak, to dump on those looking to buy into a superheated market. They're in the search engines checking out carefully for news and early signs of a reversal. Some are nervously watching for potential rises in interest rates and hyper-inflation. Those sort of folk probably know little about technical and fundamental analysis.
Is there a peak as yet in the housing market? Nobody can know because there is no dip and no double top at the leading edge, to define the peak (as yet). That means it can still go far more north - to dah Moon, for example. 😉🤐
So for those who need to understand what's going on with house prices, I speculate the following:
1. The parabolic end of the curve up suggests to me this is a stampede of competitiveness among many who think that all bearish sentiment in the economy has been crushed. These are not the likely to be a large proportion of the people searching madly the captioned question.
2. People with cheap credit have jumped on a bandwagon, thinking perhaps " A new dawn is ahead..we've beaten the virus. We have vaccines. Time to git going! Things can only get better. " You know the song?
3. Some believe that the rise in equities plus virtually unlimited monetary and fiscal stimulus means ' They've saved the economy. '
4. Housing property prices took a leap because there was more demand for homes in the pandemic period. But that's not the only reason. Anyway the initial pump got the bull market going. Then came the stampede with some false peaks as jitters set in for shorter periods. I'm not a housing sector analyst.
Now compare what happened in the CONSTRUCTION, PROPERTY & REAL ESTATE INDEX (chart below). Hmmm.. construction? Yeah.. that's nothing to do with housing - right? Think harder. Sound traders and investors know that the best moves they can make in any market involves 90% of their time spent thinking!
Is the housing market in the US a bubble? You and I won't know until after the sound of a POP!
If you have other ideas, do share. Let's get that discussion going.
Disclaimers : This is not advice or encouragement to trade securities or any asset class. This is not investment advice. Chart positions shown are not suggestions and not intended to assure you of an advantage. No predictions and no guarantees are supplied or implied. The author trades mostly trend following set ups which has a low win rate of approximately 40%. Heavy losses can be expected if trading live accounts or investing in any asset class. Any previous advantageous performance shown in other scenarios, is not indicative of future performance. If you make decisions based on opinion expressed here or on my profile and you lose your money, kindly sue yourself.

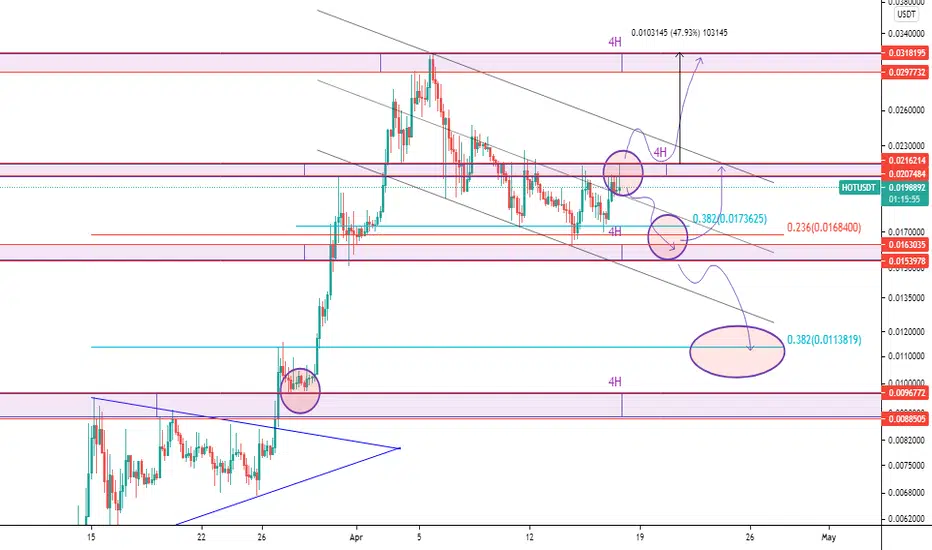
HOTUSDT, Needs more correction or Not. HOLOHello my friends. Like always everything is clear on the chart for you. We have two scenarios, the price in the temporary descending channel and now under a strong resistance baseband, So I expect more correction to fib 0.32 If fails to break the baseband. Totally keep your eyes on the circles zone and watch the price's behavior at this areas. Good luck
If you like the idea, do not forget to support with a like and follow me for next analysis :)
Write your comment and opinion below for me
.
Salam be doostan. hame chiz rooye chart moshakhas hast. inja 2 ta senario darim ya shekast base band va roshde gheymat ya edame eslaah ta fib 0.32 ehtemalan. beshakhse entezar eslaah bishtar ro daram agar natoone moghavemat base band ro rad koneh. dar kol raftar gheymat tooye dayere ha ro rasad konid. moafagh bashid.
like va follow baraye hemayad va didan tahlil haye jadid faramoosh nashe :D
#Holo Breaks Strong Resistance in 4H Timeframe!Currently #holo has nicely reacted to it's 20EMA on daily timeframe . with the breakout confirmation in 4H timeframe , from a bull flag pattern , it is a good time to buy #Holo. headed to 0.618 golden fib. after volume confirmation, we expect the price to go as high as 0.06 as it's first target.
other scenario which in highly unlikely is: breaking down the strong support and hitting SL in 0.013.
Good Luck


WHEN HOT BREAK RED LINEIt can blown when red line is cracked. green line and green zone strong areas. If green line broken, next target is orange line.
Targets 0.25, 0.30


HOT to 0.015HOT is moving toward the main growth line / support line slowly an will bottom at 0.015 - 0.0151 and go up after meeting up. It will do a retest of support if you missed the first chance, but personally I would put either a buy limit at 0.0151 or for bigger change of hitting at 0.0152 as from there it should go up.

Holo (HOT)share you're toughts on this one
-- dont take it as financial advice im still learning and i can't predict the future no one can!! --
My prediction for HotusdtAnother investment deal for ya
All details are marked
If you like it hit the like 👍


HOT.USDT (Y21.P2.E3).To Rise againHOT or HOLO did well and its likely found its bottom and will create a familiar re-accumulation structure like many of the ALTs.
Some ALTs performed ahead of others and others are just braking out.
Hence HOT is to re-accumulation.
Observations:
> Daily 20 ema (black) has confluence with the macro 0.618 fib retracement
> Daily 10 ema (blue) acting resistance with the 0.5 fib level
> Wedge break is what it looks like with the target as per the post
Thoughts:
Some re-accumulation wyckoff structure to take place
I'll buy in here by looking at the smaller time frames to the precise entry.
Sell at the target range or earlier and look to buy from the buy zone as per chart.
Trading strategy:
Aligned with Daily Cradle strategy.
All the best,
S.SAri


HOT bounce incomingExpecting a small bounce here. Should touch the white line before further retracement.

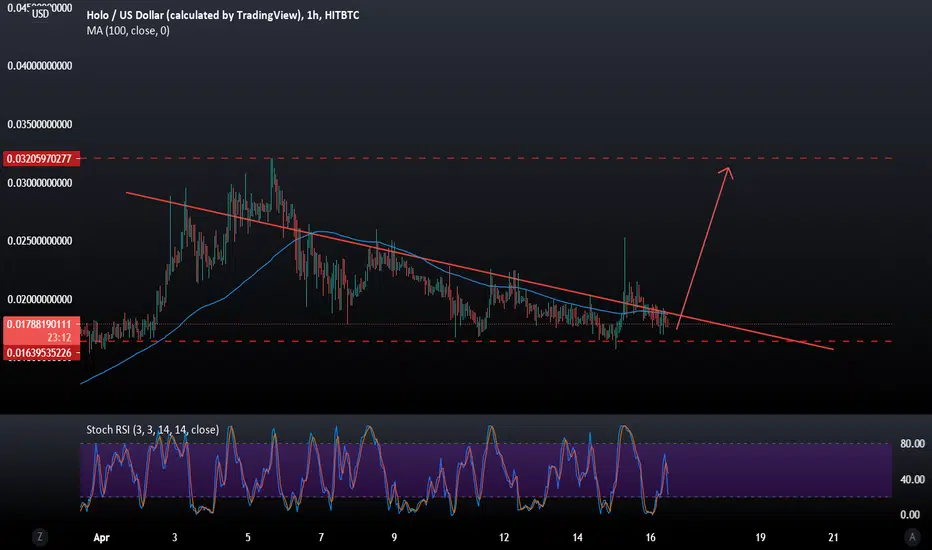
HOT/USDT : Track Price-lvl 15.04As we can see a statistic on the RSI indicator below, probably #HOT will start climbing up from the 17th of April.

We are still in a bullish trend - Macro VisionThe last days could be considered part of the second big consolidation period for holo. The first and the actual consolidation phase I have circled in red(more or less). With the actual BTC Dominance under 58% I can consider quite possible another leg up to 0.03-0.04 before the 15 of April.

HOTUSDT, correction will last up to next support!HOTUSDT needs more correction, hope we will see a bounce around the area I mentioned in Analysis
