#Hot#Hot/usdt
The price has been trading in a large bearish channel since July 2022
Recently, it broke a small bearish channel at the price of 0.001100.
It heads to the upper border of the large channel at 0.001900. First target
In the event that the large channel is broken, the price will head to the 0.002500 level.
as a second target at a rate of 120% of the current price.
All of this is supported by oversold conditions on the MACD indicator.
HOTBTC

#HOT #holo is very well accumulated#holonetwork is sitting on a strong, historical support and looks very well...
If market decides to move #holo here, the pump will be insane. Otherwise, I highlighted the another strong support on the chart.
NOT FINANCIAL ADVICE.
#holonetwork güçlü, tarihi bir destek üzerinde oturuyor ve çok iyi görünüyor...
Piyasa #holo'yu buraya taşımaya karar verirse pompa çılgına döner. Aksi takdirde grafikte başka bir güçlü desteğin altını çizdim.
FİNANSAL TAVSİYE DEĞİLDİR.

BTC is king, not cashI think we are still on target Like I said, Monday it will bounce as we see the W form for the bull run up to $45k+ this summer. I do think by year-end we see 70k-80k mostly due to world markets crashing, housing markets crashing soon, and the economics of the world pushing uncertainty making BTC a safe haven for money as more and more of the world jumps on board with digital currency. I believe BTC will always lead and that ETH will never catch up for this reason. Cash is not king anymore and the US is losing its value, they will also fail to regulate BTC but will use it as an attempt to remain a world leader. Things will still change as the fight for power and manipulation of currency worldwide gets wiped out. I also see Gold not becoming a good thing to hold as you can't get change back for it and it is way too hard to trade open world. Crypto is the only way out and it's putting people in power more and more over the Governments. Rise of Freedom and rebuilding of countries to serve the People instead of controlling the people. A major flip worldwide is happening and BTC will fund it. Poor become rich, Rich becomes poor and people will unite as a world and dethrone the Kings and Queens.
Let the hunger games begin!
Hope you enjoyed reading and keep Frosty. Never invest or trade more than you can afford to lose. always check and double-check the address you send to, and do a $1.00 test to confirm. stay safe and take control of your life. It's your story, not theirs! God Speed.

long setup for hotHi, dear traders. how are you ? Today we have a viewpoint to BUY/LONG the HOT symbol.
For risk management, please don't forget stop loss and capital management
When we reach the first target, save some profit and then change the stop to entry
Comment if you have any questions
Thank You

HOT USDT TODAYpply your own risk management.
Two entries 1st 40% @ 0.00145 second if possible 60% @ 0.001395
hunt the profits at any level you see convenient for you.
Green Zone for entry,
Yellow levels are targets.
have a good day guys.


Holo (HOT) - June 2hello?
Traders, welcome.
If you "follow", you can always get new information quickly.
Please also click "Like".
Have a good day.
-------------------------------------
(HOTUSDT 1W Chart)
Anything below 0.002275 is likely to be a mid- to long-term investment area.
From a mid- to long-term point of view, it should rise above 0.004583 to continue the uptrend.
(1D chart)
In the short-term and medium-term perspective, it needs to move above 0.002715 to turn into an uptrend.
(buy)
- After confirming the support at 0.002715
(Stop Loss)
- When it falls below 0.002275
(Sell)
- When receiving resistance in the range 0.004583-0.006284
- When resistance is received in the range of 0.009011-0.012325
If it rises above 0.012325 and finds support, it is expected to surge.
------------------------------------------------------------ -------------------------------------------
** All indicators are lagging indicators.
Therefore, it is important to be aware that the indicator will move accordingly as price and volume move.
However, for the sake of convenience, we are talking in reverse for the interpretation of the indicator.
** The MRHAB-T indicator used in the chart is an indicator of our channel that has not been released yet.
** The OBV indicator was re-created by applying a formula to the DepthHouse Trading indicator, an indicator disclosed by oh92. (Thanks for this.)
** Support or resistance is based on the closing price of the 1D chart.
** All descriptions are for reference only and do not guarantee a profit or loss in investment.
(Short-term Stop Loss can be said to be a point where profit and loss can be preserved or additional entry can be made through split trading. It is a short-term investment perspective.)
---------------------------------

Trading opportunity for HOTUSDT HoloBased on technical factors there is a long position in :
📊 HOTUSDT Holo
🔵 Long Now 0.002538
🧯 Stop loss 0.002450
🏹 Target 1 0.002735
🏹 Target 2 0.003010
🏹 Target 3 0.003585
💸Capital : 1%
We hope it is profitable for you ❤️
Please support our activity with your likes👍 and comments📝

hot looking greathot is looking good to accumulate down here
could see a big move soon if we break this down trend

HOTUSDTAccumulation from current price 0.0048 to 0.0043 with stop breaking down 0.004 .
The big target is 0.0245 , the blue areas are strong resistance for take profit .
Breaking out the red area at 0.0067 is a good signal to hit the targets .
Good luck and plz control your risk management .

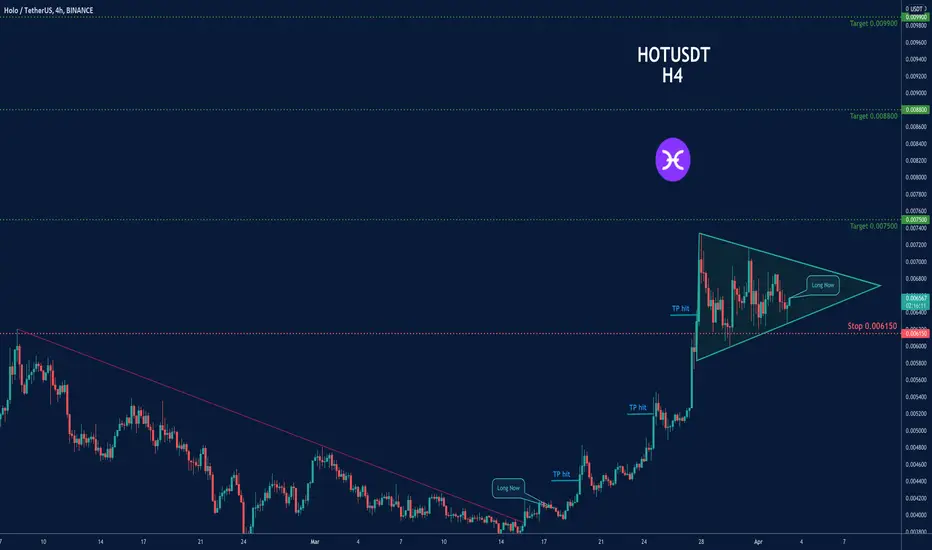
Trading opportunity in HOTUSDT- Symmetrical Triangle PatternBased on technical factors (Symmetrical Triangle Pattern ) there is a long position in :
📊 HOTUSDT
🔵 Long Now 0.006575
🧯 Stop loss 0.006150
🏹 Target 1 0.007500
🏹 Target 2 0.008800
🏹 Target 3 0.009900
💸Capital : 1%
We hope it is profitable for you ❤️
Please support our activity with your likes👍 and comments📝
HOLO CHART BULLISH SCENARIO (UPDATE)In my previous chart i made my longterm expectation for HOLO.
Today i made a shorterm expectation because,
i feel like we are almost breaking out of that resistance.

HOT/USDT LTF Scalping Chart for 36% Profit#HOT/USDT TA Update:-
$HOT currently trading at $0.006655
As per chart Bull flag already broke out.
And retest almost hit.
Lets wait one more dip for best entry around $0.0062
Or
If breakout Symmetric Tringle then Best entry with 36% Target.
- Price is consolidating in
Symmetrical Triangle Pattern.
- Price support on 100EMA confirms
further Bullishness....
- Entry will be trigger on Breakout of
Triangle pattern.
Previous swing high will be Profit Target
Entry :- On Breakout or $0.0062
SL :- Previous swing Low
Will update on breakout

$HOLO is Very Hot, Here's My Trade Idea,Buy Zone & Targets $HOT Hey Traders,
Here's my trade Idea for $HOT #Holochain
Buy Zone Between $0.00435~$0.00408
OR Buy with a stoplimit Order at $0.0049
StopLoss: 1 Day Close Below 0.003666
Targets Are:
$0.005656 ~ $0.005858
$0.006363 ~ $0.006565
I suggest using an OCO Buy order if you're using Binance.
NFA, DYOR, and Good luck.
Let Me know what do you think in the comment? press that like button to show support!
Remember, NEVER use more than 5% on any trade, and Always use a STOPLOSS.

HOT about to MAKE A BIG MOVE!Hello, I am back with an idea on HOTUSDT pair, time frame 1 day. HOT for an entire year has been following a descending triangle for an entire year now that has held a strong support in the area between 0.004-0.0045. This pattern very soon can trigger a big movement, either a reversal or a follow up to the downtrend. But at the moment, to me it looks as a good entry either way following the trade with a SL in the area below 0.004.
1st Scenario - it is usually the scenario I think has more chances of happening. Looking at the daily RSI, the pattern feels ready for a small breakout of the falling wedge leading to a near 100% (dependable on the entire market movement) as generally I see a small bullish trend near March for most coins(likely altcoins). This move could be followed by a 300% move from where we are now if it break the triangle. Always look for breakout areas out of the pattern.
2nd scenario- BTC is following up with my analysis which I expect one last drop. Due to that drop, a fakeout can happen and a wick can be see formed lower than the support. However I see HOT not going lower than 0.003, and if we lose that no lower than 0.002 and from there a consolidation could take place. And then HOT can enter the triangle again.
A reminder, follow the breakout areas in either sides, but most likely we will see a huge breakout or wick very soon as the volume indicates that too. If you have any comment, you are welcome.
Trade safe, trade smart, and always use SL during this time. :)

BTC to 3K?Special harmonic analysis today.
BTCUSD 3rd harmonic short target reached.
Reversal, or set to hit 4th target AT 3k.
Stay vigilant
Advanced_Analyst

HOTUSDT - SHORTThere is a long position in HOTUSDT Holo
HOTUSDT Holo
🔵Long Now or set on Key Level 0.008465
🟢Target 0.009290
❌Stop loss 0.008300
#K_Level

Holochain Short/Midterm Analysis $HOTShort / Midterm analysis of $HOT . All support and resistances have been given on chart. Currently ranging nicely in the channel. When Bitcoin slow downs, I expect TP1 & TP2 to hit.
Always dyor and happy trading.

$HOT Holochain find strong support! If support holds good base for another run.
Let me know what you think.
DYOR and take profits and dont over leverage.

Holochain Pump incoming 0.019?!!I think hot is almost ready for another pump ! Be Ready for it .
i think we can go to 0.0185-0.0190 this time
trade safe

HOLOCHAIN HOTUSDT PRICE PREDICTIONAs a result of my previous post I made a price estimate for holochain (hotusdt).
Since my last post, it had risen 44% within a day.
I've spotted a rerun of Holochain in chart (you can check it, i will link it to related ideas.)
TP1 0.017733
TP2 0.025989
TP3 0.032836
TP4 0.038340
No financial advice, trade safely.

HOTUSDT HOLOCHAINHello Traders,
I've spotted a rerun of holochain, (look at #1 and #2)
let me know what you guys think. I think we 're going up soon .
Nice coin with a lot of potential, Still holding since 2019.
HODL is the way to go :)

