#HOT/USDT#HOT
The price is moving in a descending channel on the 4-hour frame upwards and is expected to continue
We have a trend to stabilize above the moving average 100 again
We have a downtrend on the RSI indicator that supports the rise by breaking it upwards
We have a support area at the lower limit of the channel at a price of 0.001500
Entry price 0.001712
First target 0.001830
Second target 0.001919
Third target 0.002034
HOTUSDT

HOT Long 15m Sl -4.3%HOTUSDT Long Setup
Reason:
Broken out of Trend.
Strong Bullish Momentum
Liquidity Sweep already taken.
All Price actions suggesting a bullish wave.
Best Regard,
Crypto Panda

#HOT/USDT Ready to go up#HOT
The price is moving in a descending channel on the 4-hour frame and sticking to it well
We have a bounce from the lower limit of the descending channel, this support is at 0.001880
We have a downtrend, the RSI indicator is about to break, which supports the rise
We have a trend to stabilize above the moving average 100
Entry price 0.002180
First target 0.002234
Second target 0.002372
Third target 0.002540

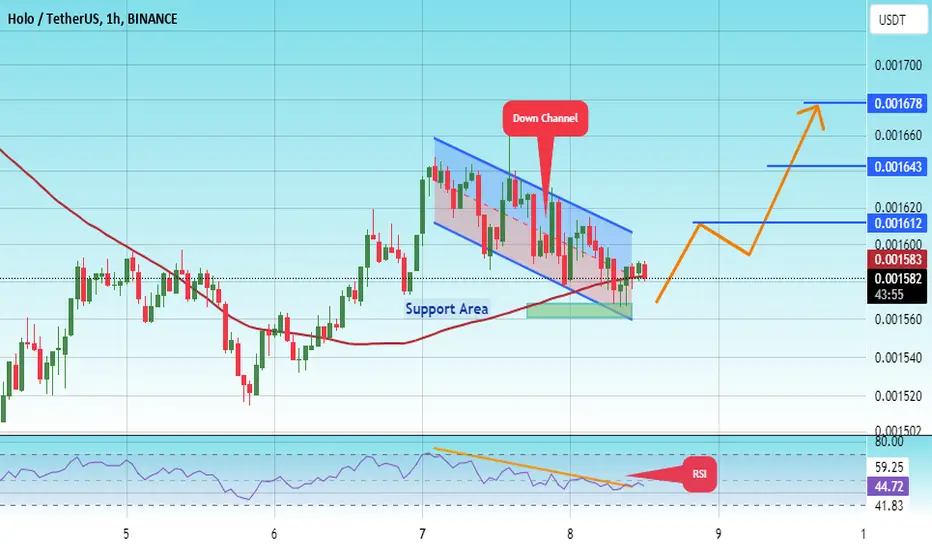
#HOT/USDT#HOT
The price is moving in a descending channel on the 1-hour frame
And it is sticking to it well
We have a bounce from the lower limit of the ascending channel and we are now touching this support at a price of 0.001550
We have a downtrend on the RSI indicator that is about to be broken, which supports the rise
We have a trend to stabilize above the moving average 100
Entry price 0.001570
First target 0.001612
Second target 0.001643
Third target 0.001678
#HOT/USDT#HOT
The price is moving in a descending channel on the 12-hour frame and is sticking to it to a large extent and it was broken upwards
We have a bounce from the lower limit of the channel price 0.001440
We have an upward trend on the RSI indicator which supports the rise
We have a trend to stabilize above the moving average 100
Entry price 0.001600
First target 0.001800
Second target 0.001957
Third target 0.002135

HOLO (HOT) paired with USDT, focusing on a 4h tmeframeTechnical Analysis by Blaž Fabjan
Ascending Channel:
The price is moving inside an ascending channel with clear resistance and support lines. This channel is characterized by higher highs and higher lows, indicating an upward trend.
The price has previously bounced off the support line multiple times, confirming the validity of the ascending channel.
The price action is approaching the upper resistance line of the channel, which could act as a barrier for further upward movement unless broken.
Potential Scenario:
The chart suggests a pullback after testing the resistance, with the potential for the price to drop back to the support line of the ascending channel before resuming its upward momentum.
The upward arrow drawn on the chart indicates an expectation of a bullish continuation after the pullback.
RSI (Relative Strength Index):
The RSI indicator currently sits around 58, which is in the neutral zone, not showing overbought or oversold conditions. This suggests that there is still room for the price to move in either direction.
A possible future rise in the RSI towards overbought levels (above 70) would align with the forecasted bullish move.
Stochastic RSI:
The Stochastic RSI is above 80, indicating that the asset is in overbought territory. This supports the idea of a short-term pullback before another upward move.
Once the Stochastic RSI cools down and approaches oversold levels, it could signal a better entry point for a long position.
MACD (Moving Average Convergence Divergence):
The MACD is slightly bullish with some divergence, showing that momentum is in favor of buyers, but it's not very strong.
A potential bullish cross of the MACD signal lines could confirm further upside momentum.
Volume:
The volume seems relatively stable, although not significantly high. Higher volume on a breakout above the resistance line would confirm a stronger bullish trend.
Trading Plan:
Entry Point:
Wait for a pullback towards the support line of the ascending channel (around $0.00165 - $0.00160), which could provide a better entry point for a long position.
Confirm entry with a bounce off the support line, or when indicators such as the RSI or Stochastic RSI reach oversold conditions.
Stop Loss:
Place a stop loss below the support line of the channel, at approximately $0.00155, to limit losses in case of a breakdown below the channel.
Target:
First target: Resistance of the ascending channel (around $0.00180 - $0.00185). This aligns with the previous highs, offering a solid take-profit level.
Second target: If the price breaks above the resistance line with strong volume, the next target would be around $0.0020 or higher, following the bullish projection shown by the arrow in the chart.
Risk Management:
Ensure the risk-to-reward ratio is favorable, aiming for at least 1:2. For example, if risking 5% (stop loss at $0.00155), the first target should yield at least a 10% gain.
Confirmation:
Before taking any position, look for confirmation through price action, such as bullish candlestick patterns (e.g., bullish engulfing) or strong buy volume when the price touches the support line.
This trading plan outlines a potential setup based on the chart. However, always remember to adapt based on real-time market conditions and further confirmations from your indicators.

HOT Spot Trade | 2500 % or ATH in 2025🔥 HOT (Holo) is setting up for a massive 2500% surge or a new ATH in the 2025 bull run! With its unique decentralized hosting platform gaining traction, this could be a long-term winner. Don't miss the ride! 🚀 #HOT #Crypto #ATH"

Technical Analysis of Holo (HOT) 4H TIMEFRAME ON BINANCEHOT/USDT TECHNICAL ANALYSIS BY BLAŽ FABJAN:
Bullish Falling Wedge Pattern:
The price action indicates the formation of a falling wedge, which is a bullish reversal pattern. The wedge is marked by converging trendlines (resistance line and support line), with the price gradually tightening within the pattern.
The breakout from this wedge has occurred with a slight increase in price and volume, suggesting the start of an upward movement.
Momentum Indicators:
RSI (Relative Strength Index): The RSI is currently around 47.17, indicating neutral momentum. However, there is a slight upward slope, which suggests that momentum is shifting towards the bulls.
Stochastic RSI: The Stochastic RSI is at 78.15, near the overbought region, but not yet fully overbought. This could indicate a short-term pullback or consolidation before another upward move.
VMC Cipher Indicator: The VMC Cipher B divergences indicator shows bullish divergence, further confirming the potential for upward movement. The histogram is turning positive, which is a bullish sign.
Trading Plan:
Intraday Trading:
Entry: Consider entering a long position around the current price levels or upon a slight pullback, ideally around the 0.001580 - 0.001600 support zone.
Target: Target short-term resistance levels around 0.001750 - 0.001800.
Stop-Loss: Place a stop-loss just below the recent low or support level, around 0.001550.
Strategy: Focus on quick scalps and close positions if there is a lack of momentum.
Scalping:
Entry: Enter on minor dips or consolidation phases, particularly around the 0.001600 - 0.001610 range.
Target: Target small profit levels within 0.001630 - 0.001650 range.
Stop-Loss: Keep a tight stop-loss below the 0.001580 level.
Strategy: Utilize tight risk management and be prepared to exit quickly if the price does not move as expected.
Swing Trading:
Entry: Consider entering a long position on the breakout confirmation or upon a retracement back to the breakout zone (around 0.001600).
Target: Aim for higher resistance levels around 0.001900 - 0.002000 based on the measured move of the wedge pattern.
Stop-Loss: Place a stop-loss below the lower boundary of the wedge, ideally around 0.001500.
Strategy: Hold the position over a few days to weeks, depending on the price action and momentum.
Conclusion and Trading Advice for Long Position:
Bullish Outlook: The breakout from the falling wedge pattern suggests a bullish reversal. However, the RSI and Stochastic RSI indicators are neutral to slightly overbought, suggesting caution for overextension in the short term.
Trading Advice:
For Intraday and Scalping: Be prepared for quick trades and potential pullbacks. Ensure tight risk management due to the current levels of momentum indicators.
For Swing Trading: The breakout is promising for a larger upward move. It is advisable to enter on a pullback to minimize risk and target higher resistance levels.
This analysis suggests a cautiously optimistic outlook for HOT/USDT, with the potential for further gains, especially in a swing trading strategy. Always use proper risk management and adjust your strategy according to market conditions.

#HOT/USDT#HOT
The price is moving in a descending channel on the 4-hour frame and is sticking to it very well and is expected to break it upwards
We have a bounce from a major support area in green at 0.001300
We have a downtrend on the RSI indicator that was broken upwards which supports the rise
We have a trend to stabilize above the 100 moving average which supports the rise
Entry price 0.001540
First target 0.001700
Second target 0.001850
Third target 0.002030

holochaunHt did a 18% today. I think will grow until the limit of 0.005 in the next couple of days.
I hope it reachs 0.03 that was my level

HOTUSDTHOT ~ 1W
#HOT demand zone that you might need to pay attention to to start buying if you have Conviction on this NASDAQ:COIN

HOT ROAD MAPOn the HOT chart, we have 3 big ABC waves.
The time of wave A is about 416 days, the time of wave B is about 550 days.
It is expected that the time of C wave will last about 400-500 days.
It should be stated that HOT is very interested in triangle patterns.
Wave A was a contraction triangle.
Wave B was an expansion triangle.
Now wave C seems to have 3 waves. that wave a of C is an expansion triangle and we are now in wave b of C.
On the green range, it is observed that wave b of C will end and we will enter wave c of C.
The targets are clear on the chart.
Closing a daily candle below the invalidation level will violate the analysis.
For risk management, please don't forget stop loss and capital management
When we reach the first target, save some profit and then change the stop to entry
Comment if you have any questions
Thank You

#HOT/USDT#HOT
The price is moving below a downtrend on a 1-hour frame, and the trend is being tested now and is about to break to the upside.
We have a bounce from the green support area at 0.001260
We have a tendency to stabilize above the Moving Average 100
We have a downtrend on the RSI indicator that is about to break higher and supports the rise
Entry price is 0.001380
The first target is 0.001560
The second goal is 0.001680
The third goal is 0.001800

Will HOTUSDT be aiming higher?Hi there traders
We received a new signals from the EnF Breakout Strategy:
BUY on HOTUSDT
See idea for breakout entry, targets and stoploss
Only enter the trade when the price breaks above entry
Check out more on the script:
To get access to this script, DM me

HOTUSDT aiming lower?Hi there traders
We received a new signals from the EnF Breakout Strategy:
SHORT on HOTUSDT
See idea for breakout entry, targets and stoploss
Only enter the trade when the price breaks above entry
Check out more on the script:
To get access to this script, DM me

HOT/USDT Key Levels to Watch the supply for the Next Rally💎 HOT is currently experiencing resistance at a key supply area, leading to a rejection.
💎 It looks set to retest the demand area at $0.00256 to gather momentum for another attempt to break through the supply. A successful breach of this supply could trigger a bullish momentum, propelling HOT towards a significant upward movement and our target.
💎 If HOT fails to bounce upon reaching the demand area and instead breaks below it, the price could continue its descent toward the support trendline. A bounce from this trendline will be crucial for HOT to attempt another rally towards the supply area.
💎 Should HOT also break down below the support trendline, it would be a concerning sign, as it would only leave one key support area at $0.002080.
💎 Historically, HOT has shown positive movement after touching this area, suggesting a potential rebound above the demand area to keep our bullish scenario alive.
💎 The scenario turns bearish if HOT cannot hold above this key support area, especially if it closes a daily candle below it. In such a case, HOT may establish a lower low, potentially leading to a deeper dip.
MyCryptoParadise
iFeel the success🌴

HOT is bullishWe have bullish iCHs on the chart.
A resistance line has also been broken.
By maintaining the demand area, it is expected to move towards the targets. I specified the targets on the chart.
Note that the financial market is risky, so:
Do not enter any position without confirmation and trigger.
Do not enter a position without setting a stop.
Do not enter a position without capital management.
When we reach the first TP, save some profit and try to move the stop continuously in the direction of your profit.
If you have any comments please post them, comments will help us improve our performance
Thanks

Should I buy a large amount of HOT(HOLO)?! 500% profit.500% profit without leverage in short time? in two months? Hmm
I'll be honest it's a one to one copy with history 2021.
2021 btc was high and HOT made a surprise in the market and big profits for people, those who bought and sold at the right time.
Today BTC is high and HOT is the same low as 2021 and everything looks almost exactly the same as the previous pump.
The market capitalization is also almost at the same level! Which shows that more coins haven't been printed thoughtlessly and makes it more likely that it will rise about the same.
Shall we try and buy? There is little time left! If history repeats itself!
The simplified key has sl -50% which is pretty crazy. Currently, the price is around 0.0037.
I'll let you know when I get in! It is important to focus on the small chart to find a good entry.
PS1 this could be a clue and indicator for BTC coin, I have used altcoin analyzes to understand btc and vice versa to find more logic. BTC is the mother!!!!!!!!!and is the first thing to understand!!!!!!
PS2
Remember history may not repeat itself exactly the same and is only a hypothesis according to history. You can lose by buying. Everything can change in a short time!!!!!!!!!!! We exist in legal pyramid schemes and it is insanely risky. It's like a casino, but analyzable.
If you are trying the same thing with me, put support.
MoralDisciple

HOTUSD 1WHOT ~ 1W
#HOT Retesting this Support Line has been successful.
Make purchases gradually starting from here. The bulls will start to push the price to continue rising.

HOTUSDT New Trade Alert!Leverage: Max 10x
Analysis: #HOT already broke down the symmetrical triangle pattern and is looking bearish.
Entry Range: $0.002250 - $0.002300 (Enter Partially)
Targets:
Target 1: $0.002180
Target 2: $0.002120
Target 3: $0.002060
Target 4: $0.002020
Target 5: $0.001940
Target 6: $0.001850
Target 7: $0.001750
Target 8: $0.001650
Target 9: $0.001500 (Short-Mid Term)
Stop-Loss: $0.002340
Please follow me for more analysis and calls.

#HOT/USDT#HOT
We have a bearish channel pattern on a 4-hour frame, the price moves within it and adheres to its limits well
We have a green support area at 0.002228
We have a tendency to stabilize above moving average 100
We have a downtrend on the RSI indicator that supports the price higher
Entry price is 0.002220
The first target is 0.002458
The second goal is 0.002753
The third goal is 0.003050

#HOT/USDT#HOT
We have a bearish trend pattern on a 4-hour frame, within which the price moves and Respect its limits well.
We have a major support area at 0.00200
- We have a tendency to stabilize above moving average 100
We have an uptrend on the RSI indicator that supports the price higher
Entry price is 0.002200
The first target is 0.002350
The second goal is 0.002569
The third goal is 0.002790

HOT Long Term TargetsThis is just a trial. Nobody knows anything in this market.
But these are my targets for HOT
