HOTUSDT Buy levels and targetsHolo (HOTUSDT) is on a strong 1D green candle, being on Higher Highs and Higher Lows since the July 13 Low. The 1D MA50 (blue trend-line) is now supporting and the 1D MA200 (orange trend-line) is the short-term target. After that, we need a clear break above the 0.5 Fibonacci retracement level to confirm the long-term trend shift from bearish to bullish. As a result buy either upon a 1D MA50 pull-back or a 0.5 Fib break-out. Notice that on the previous Lower High of the November 2021 Channel Down, the price got rejected near the 0.5 Fib.
--------------------------------------------------------------------------------------------------------
Please like, subscribe and share your ideas and charts with the community!
--------------------------------------------------------------------------------------------------------
HOTUSDT

Hot USDT Forecast/SignalThe uptrend movement of the price of HOT/USDT, today is associated with the acceleration and high press of Buyers


#Hot❇️Entry : 0.002204~0.002219
🔴LONG Max lev 2~5X
🎯Target : 0.002267 / 0.002291 / 0.002330
⛔️Stop loss : 0.002129
🛑Don't risk more than 3% of capital.

HOTUSDT SellAll the required trading rules are on the chart. We are waiting for the price to retest a prior zone of interest. If the price fails to make a new higher high and a new higher low and we see the price return and close below 62% Fibonacci we will place a sell order. Until the rules are fulfilled, we don't trade.

HOT - Scalp short with potential to add volume⚓️Reasons to take short
⭐️ BTC rose a lot
⭐️ Trendline is clear
⭐️ There is awesome trendline below
⭐️ Many touches
⭐️ Volume at top
⭐️ 70 ATR
Will enter when price squeezes to the level on 5m timeframe, the base will form and the strip will get faster.
If you don't understand the previous sentence, just use swing stop-loss 3-5%
Fix profit by parts:
1% - 1/3
2% - 1/3, stoploss to breakeven
What's left, hold to the maximum
What do you think of this idea? What is your opinion? Share it in the comments📄🖌
If you like the idea, please give it a like. This is the best "Thank you!" for the author 😊
P.S. Always do your own analysis before a trade. Put a stop loss. Fix profit in parts. Withdraw profits in fiat and reward yourself and your loved ones

Holo (HOT) - June 2hello?
Traders, welcome.
If you "follow", you can always get new information quickly.
Please also click "Like".
Have a good day.
-------------------------------------
(HOTUSDT 1W Chart)
Anything below 0.002275 is likely to be a mid- to long-term investment area.
From a mid- to long-term point of view, it should rise above 0.004583 to continue the uptrend.
(1D chart)
In the short-term and medium-term perspective, it needs to move above 0.002715 to turn into an uptrend.
(buy)
- After confirming the support at 0.002715
(Stop Loss)
- When it falls below 0.002275
(Sell)
- When receiving resistance in the range 0.004583-0.006284
- When resistance is received in the range of 0.009011-0.012325
If it rises above 0.012325 and finds support, it is expected to surge.
------------------------------------------------------------ -------------------------------------------
** All indicators are lagging indicators.
Therefore, it is important to be aware that the indicator will move accordingly as price and volume move.
However, for the sake of convenience, we are talking in reverse for the interpretation of the indicator.
** The MRHAB-T indicator used in the chart is an indicator of our channel that has not been released yet.
** The OBV indicator was re-created by applying a formula to the DepthHouse Trading indicator, an indicator disclosed by oh92. (Thanks for this.)
** Support or resistance is based on the closing price of the 1D chart.
** All descriptions are for reference only and do not guarantee a profit or loss in investment.
(Short-term Stop Loss can be said to be a point where profit and loss can be preserved or additional entry can be made through split trading. It is a short-term investment perspective.)
---------------------------------

Trading opportunity for HOTUSDT HoloBased on technical factors there is a long position in :
📊 HOTUSDT Holo
🔵 Long Now 0.002538
🧯 Stop loss 0.002450
🏹 Target 1 0.002735
🏹 Target 2 0.003010
🏹 Target 3 0.003585
💸Capital : 1%
We hope it is profitable for you ❤️
Please support our activity with your likes👍 and comments📝

HOT - 1D1D chart for HOT
support zones & resistance zones
Information purposes only
Like if u like chart
@Cringeego

HOT Can Revisit 0.0025 once again after the Pull BackThe same structure as on many alt coins. Here we can expect more potential downside towards 0.0025 area to find the next best supported level.

HOT ready to fly#HOT/USDT
$HOT broke out from long term descending resistance and dropped to ascending support.
🐮 holding this support can increase price to resistance between $0.0054 and $0.0062.
if price continue its rally to break out from resistance of $0.0076 it can reach $0.01 to complete the inverted head and shoulders.
🐻 break down from ascending support will drop price to $0.004 and even $0.003.

hot looking greathot is looking good to accumulate down here
could see a big move soon if we break this down trend

HOT descending triangle bullish breakoutWe can see that holo is breaking out of a diagonal resistance, if it closes above the line it is very bullish for this coin.

HOTUSDTAccumulation from current price 0.0048 to 0.0043 with stop breaking down 0.004 .
The big target is 0.0245 , the blue areas are strong resistance for take profit .
Breaking out the red area at 0.0067 is a good signal to hit the targets .
Good luck and plz control your risk management .


HOT/USDT Buy step by step in supports.
🔴Supports $0.0055 & $0.0045 & $0.0035
🔵Resistance Zone $0.0067 & $0.0075
🟢Target: $0.0086 & $0.01 & $0.0125
Like and comment please ❤


Hot hot hot 🔥🔥🔥Upside breakout could bring 0.011 are. Waiting under the resistance.
I believe we are gonna see some nice moves soon.

HOTUSDT: FALLING WEDGE, RAISE OF ALTCOINS BULL RUN?Hello Fellow HOLO Investor/Trader!
HOTUSDT rebound on the bullish trendline . Recently, HOTUSDT is also breaking out of the falling wedge pattern. The breakout accompanies with increasing volume which indicates a potential bullish bias ahead.
*All Explanation is presented on the chart*
The roadmap will be invalid after reaching the target/ support area .
"Disclaimer: This is only an outlook, not a recommendation to buy/sell cryptocurrency."
*SUPPORT THE CHANNEL BY SMASHING THE LIKE BUTTON AND SHARE YOUR OPINION BELOWS, SEE YA ON THE NEXT ROADMAP*

HOLO CHART BULLISH SCENARIO (update)Creating a strong bullish sructure on the 4hourly chart.
- Stay safe everybody
- Feel free to share, like and suscribe

Holo Going Bullish these days it's a clear BULLISH PENNANT
First Target could be 13%
Second one 30% ,

HOT bullish flag ideawe can see a nice bullish flag forming on hot, if it breaks out we can expect a target of 0.008

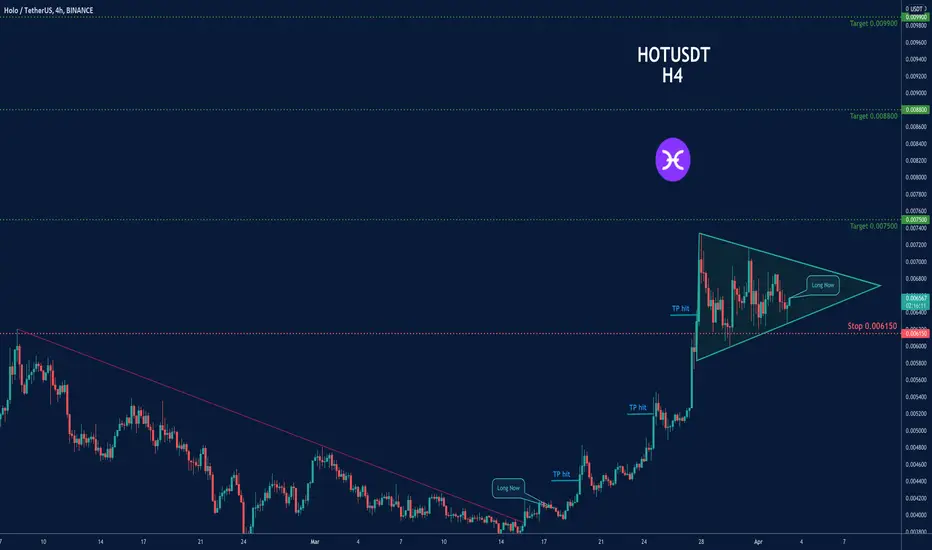
Trading opportunity in HOTUSDT- Symmetrical Triangle PatternBased on technical factors (Symmetrical Triangle Pattern ) there is a long position in :
📊 HOTUSDT
🔵 Long Now 0.006575
🧯 Stop loss 0.006150
🏹 Target 1 0.007500
🏹 Target 2 0.008800
🏹 Target 3 0.009900
💸Capital : 1%
We hope it is profitable for you ❤️
Please support our activity with your likes👍 and comments📝