Stop Chasing Reversals | Wait For This SignalIf you have a hard time spotting reversals it's because you've yet to be taught how to see them. It has nothing to do with structure, but the exchange rate itself. In this video, I will share with you how I help my clients spot reversals and the next step we use to find where price can go next.
Howtotrade

New Highs For The Dollar New Lows EUROThe dollar has made new highs while EURUSD has made new lows. This means it's time to adjust and analyze the next trade setup. In this video, I am sharing who I'm quickly updating my eyes to trade EURUSD.
Remember, I'll be live here on Tradingview today at 12:00 pm EST to uncover the 3 Steps to Making Price Action Trading Easier. See you soon.

Are You Ready to Trade Full Time? 4 Essential Signs ⭐
Hey traders,
Once you mature in trading and become a consistently profitable trader, the question arises: are you ready to trade full time?
Becoming a full time trade is a very significant step and my things must be taken into consideration before you make it.
✨Becoming a full time trader implies that you quit your current job, that you give up a stable income - your salary.
In contrast to classic job, trading does not give guarantees. Please, realize that such a thing as stable income does not exist in trading.
Trading is a series of winning and losing trades, positive and negative periods. For that reasons, remember that in order to become a full time trader, your average monthly trading income must be at least twice as your monthly expenses.
✨Moreover, even if your trading income is sufficient to cover two months of your life, that is still not enough. You must have savings.
Trading for more than 8 years, I faced with quite prolonged negative periods. One time I was below zero for the entire quarter.
For that reason, supporting a family and living a decent life will require savings that will help you not to sink during the losing periods.
✨Another very important sign is your correct and objective view on your trading. Please, realize that if you bought Bitcoin one time and made a couple of thousands of dollars, it does not make you a consistently profitable trader. Please, do not confuse luck with the skill. Your trading must be proven by many years of trading.
✨You must be emotionally prepared for the living conditions that full time trading will bring you.
Being a full time trader implies that you are constantly at home,
you work from home from Monday to Friday.
You do not see your colleagues, your social life will change dramatically.
I know a lot of people who started to trade full time and then realized that they can not work from home for different reasons.
⭐So what are the necessary conditions for becoming a full time traders:
you should have savings that will cover the negative trading periods,
your average monthly trading income should be at least twice as your monthly expenses,
your trading efficiency must be proven by objective, consistent results,
and you must be psychologically prepared for working from home.
When these conditions are met, you can make a significant step and become a full-time trader.
Are you ready to become a full time trader?
❤️If you have any questions, please, ask me in the comment section.
Please, support my work with like, thank you!❤️

FIBONACCI TOOL | common reversal levels📊
⚠️Fibonacci levels are one of the most popular tools for analysis. These are price levels that are located in certain parts of the movement corresponding to the mathematical Fibonacci numbers.
✅What are Fibonacci numbers?
🟢In the XIII century, the famous scientist Leonardo of Pisa lived in the Republic of Pisa – the first major medieval mathematician in Europe. On the cover of one of his most famous works was attributed filius Bonacci (son of Bonacci). Hence the nickname Fibonacci.
🟢The Fibonacci numbers are a sequence of numbers derived from Leonardo's experiment on rabbits. The Pisan mathematician decided to find out how many pairs of rabbits will be in a fenced pen a year after the start of breeding (provided that there will be only one pair in the pen in the first month). In the third month, the cuts began to multiply recurrently – each subsequent number was equal to the sum of the previous two (1, 2, 3, 5, 8, 13, etc.).
🟢If any number from the sequence is divided by the previous one, you get a number tending to 1.61803398875… This number is the "golden ratio". In algebra, such a number is called the Greek letter phi. When dividing any number from the sequence by the following, the inverse of phi 0.618 is obtained. When dividing any number from the sequence by the number following one, 0.382 is obtained. In this form, Fibonacci numbers are much more familiar to traders.
✅Correction levels
🟢Correction (retracement) - movement against an existing trend. The correction "absorbs" part of the trend movement. Of the Fibonacci numbers, 38.2 are mainly used for correction levels (from the previous trend movement), 50%, 61,8%, 78,6%.
🟢Correction levels are based on candle wicks, in other words, on their maximum or minimum points. To build a correction level, you need to find a trend. Fibo levels can be asymmetrical, so it is especially important to pay attention to where the beginning and end of the wave on which the level is being built are located.
🟢On a downtrend, 0% at the bottom, 100% at the top. When ascending, the opposite is true. The most significant correction level is 61.8. When a breakdown of this level occurs, a new trend in the opposite direction usually begins. After that, it is necessary to build a new corrective level.
🟢Correction pattern – movement between minor correction levels. After such a move, the price usually moves to the key level of 61.8. 4 patterns are depending on which levels of correction the price concerns.
❗️Even if the skills of analyzing the state of the market by Fibonacci levels will not be a big advantage in trading, then in any case it is a great (and to some extent integral) experience of technical analysis. Fibo levels can be combined with a footprint, deltas, and other tools. The trader will understand only in practice if it is possible to benefit from this or not.
❤️ Please, support our work with like & comment! ❤️

The power of the daily highs, lows and the VWAP!Hey Traders and Happy Monday!
In todays post on our Tradingview channel talk about the importance of the 3 main levels we focus on, which are,
VWAP
Daily high
Daily low
Based on what happens at these levels we usually take big action! The video explains more.
Enjoy and see you tomorrow!
#support #resistance #keylevel

CUP & HANDLE. How the pattern works☕️
✅This pattern is not as popular among traders as "Head and Shoulders", "Double Top" and other classic patterns of technical analysis. However, this does not mean that it is not so effective. In fact, the "Cup & Handle" pattern is in no way inferior to the above patterns in its reliability and, if used correctly, can bring considerable benefits to the trader.
✅Below we will look at how the "Cup & handle" is formed, what are the signs of authenticity of the formed pattern, and the trading strategy for it.
⚠️How the "Cup & Handle" formation is formed
The formation of this pattern occurs on an uptrend and is a sure sign of its continuation (subject to the conditions of authenticity of the pattern). In essence, it is a cup - an uptrend correction. The price reaches a strong resistance level, cannot overcome it, and smoothly rolls back, forming the left wall of the cup. Then it smoothly unfolds along the bottom and rises to test the level again. Having reached the level, it rolls back down again. This rollback should be much smaller than the previous one, and it forms a handle. The handle of the cup is very often formed in the form of a "Flag" pattern.
The "Cup & handle" pattern is considered fully formed when the price, having formed a "handle", returns up and breaks through the resistance level from which the pattern formation began
⚠️Confirmation of the truth of the "Cup & handle" pattern
There are several conditions, without which the formed pattern cannot be considered true. These are the conditions:
1️⃣To begin with, as mentioned above, for the formation of this pattern, it is necessary to have an uptrend. Without a trend, there is no point in looking for this formation on the price chart, because even if you find a drawing of an ideal cup with a handle, it will be just a drawing that has no meaning.
2️⃣The depth of the forming cup should not exceed 2/3 of the height of the previous uptrend. The optimal depth of the cup is within 1/3 - 2/3 of this value.
The depth of the forming handle should not exceed a value equal to ½ of the depth of the cup.
3️⃣The most reliable is the "Cup & Handle" pattern formed on daily or weekly timeframes. Of course, it can also be formed on hourly charts, but where the probability of its triggering is somewhat lower.
4️⃣The "Cup & handle" pattern should be confirmed by the indicators of the volume indicator. Volumes should grow at a time when the price is moving in the direction of an uptrend and fall when it decreases. Also, a sharp surge in volume should accompany the moment of breaking through the price level at the end of the formation of the figure.
🟢Trading strategy based on the "Cup & handle"
The entry into the position is carried out after the completion of the formation of the figure. It is recommended to wait for the price to close above the resistance line. To do this, you must constantly monitor the schedule in anticipation of the right moment.
There is also a strategy for opening a position on a pending order, in which case there is no
need to sit and wait for the completion of the figure. A pending order is placed at a level slightly above the resistance level (approximately 10 points) and is triggered if the figure is completed.
The target level for this pattern is the height of the cup, laid up from the resistance level. Therefore, we set the profit-taking level of TAKE PROFIT either at the target level or 10-15 points below it.
As for the STOP LOSS limit order, it should be placed at the level of the bottom of the handle (or slightly lower).
❗️In conclusion, I will say once again how important it is to correctly identify the "Cup and Handle" formation before you start trading on it. Carefully re-read the rules confirming this pattern. Try not to mess with the patterns formed on small timeframes. Take your time, be patient, and remember that the absence of open positions can also be considered an excellent position.
❤️ Please, support our work with like & comment! ❤️

BID AND ASK BASICS📚
🔴In all markets, there is a price at which a market participant is willing to buy an asset and a price that suits the seller. At the same time, traders intend to carry out a purchase and sale transaction only within the amount that is profitable for them.
⚠️In the foreign exchange market, the ask line is the cost of buying an asset or the price that is set by the broker in the Buy order.
⚠️Bid - accordingly, the cost at which the broker opens a sell order when accepting an application for the sale of currency from a trader.
❗️The spread is the difference between ask and bid prices. To be more precise, the spread is the difference between the best bid and ask offers for a specific asset over a certain period. Thus, the spread is dynamic, changing over time. The spread value is formed by the initial value set by the broker, as well as due to the volatility of the currency. The spread can vary from 0.1 to 100 points.
✅In the market of physical goods, a similar example can be given: a seller and a buyer, haggling, narrow the difference between prices that satisfy them, bringing them to one at which they make a deal.
✅In the foreign exchange market, the spread between prices is the commission charged by the broker. It should be borne in mind that the broker takes a commission regardless of the volume of the transaction and its result.
❤️ Please, support our work with like & comment! ❤️

5 MUST READ TRADING BOOKS 📚
Hey traders,
You frequently ask me to share a list of trading books that I personally recommend.
In this post, I gathered 5 books every trader must-read.
Please, note that in that list I included the books that changed my perception of trading. Most of them focus on the psychological aspects of trading and do not teach any particular trading strategy.
📕Trading in The Zone by Mark Douglas.
Douglas uncovers the main fallacies of newbie traders. He focuses on the psychological aspect of trading and its tremendous role in this game. Relying on studies of the human psyche the author teaches readers to beat the ingrained mental habits.
📔The Black Swan by Nassim N. Taleb.
Even though that book is not about trading, it uncovers the aspect of probabilities in life and our perception of them. Especially, Taleb focuses on very rare and extremely low probability events that humans frequently neglect in their predictions and the impact of their occurrence in our lives.
📘The Disciplined Trader by Mark Douglas.
One more book from Douglas. This paper describes the mindset of a successful trader, useful habits and traits. It is looking for reasons why most of the traders fail. The author teaches how to properly react to losing and winning trades and changing market conditions.
📙Market Wizards: Interviews with Top Traders by Jack D. Schwager.
Best traders of the entire world share useful insights of trading. Top experts in the industry talk about their journey, about their path to success and share their valuable experience.
📗Trend Following by Michael W. Covel
Trend is our friend. That is the axiom no one doubts. The only problem is that it is not that simple to follow the trend.
In this book, Covel describes a profitable and efficient trend-following trading strategy adopt.
Of course, reading these 5 books does not guarantee that you will become a consistently profitable trader but I consider them to be very impactful. I always said that a proper mindset is one of the most important things in trading and these books will help you to build it.
Did you read these books?
❤️If you have any questions, please, ask me in the comment section.
Please, support my work with like, thank you!❤️

COMPOUND INTEREST | Time is on your side📚
❗️As it turned out, not all traders are familiar with such an important concept as compound interest. Meanwhile, the use of compound interest in trading can be a very effective tool for making a profit. In short, compound interest is the accrual of interest on interest, and if in detail, then read on.
✅The formula for calculating compound interest has the form:
Compound percentage = (P (1 + g)^ n) – P, where
P – the amount originally invested;
r – interest rate;
n is the investment period.
Let's say you invested an amount of $ 10,000, every year the interest received is added to the principal amount, and new interest is accrued for a larger amount. If the investment period is 5 years, and the interest rate is 10% per annum , then after the specified period, taking into account the compound interest, you will receive a profit in the amount of:
(10000(1+0.10)^5)-10000=6105.1$
And without taking into account the compound interest, the profit for the same period will be:
1000050,10-10000=5000$
As you can see, using compound interest (or in other words reinvesting profits) brought additional income in the amount of: 6105.1-5000 = 1105.1 $.
✅It seems that the figures presented above are not impressive, but the use of compound interest in trading can truly work wonders. In what way? Let's take another look at the compound interest formula described above. It is obvious from the formula that you can increase profit by increasing any of its components. Let's not touch the amount originally invested, but play with the value of the investment period and the interest rate.
To begin with, let's imagine that we will reinvest the profit not every year, but every month. Then the investment period will be 12 5 = 60 months. The interest rate corresponding to this investment period will be equal to: 10%/12=0.833%. Let's substitute these values into the formula for calculating the compound percentage:
(10000(1+0.00833)^60)-10000=6449,8$
As you can see, under the same conditions, but with monthly reinvestment of profits, the income will already be $ 6449.8- $6105.1 =$344.7 more.
Well, if the trader's income is not 0.833% per month, but, for example, 5% monthly, then under the same conditions and for the same period, the profit will already be:
(10000(1+0. 05 )^60)-10000=176791,86$
Felt the difference, impressive, isn't it? And what if you reinvest profits not monthly, but daily? Let's figure it out. With an average yield of 5% per month, the average daily yield will be 5%/21= 0.238% (here 21 is the number of working days in a month). The investment period will be 5360=1800 days. Let's substitute the data into the compound interest formula:
(10000(1+0.00238)^1800)-10000=711617,5$
This is already 711617.5-176791.86 = 534826 $ more than with monthly reinvestment of profits. More than half a million dollars (and this with an initial investment of only ten thousand)! That's impressive. That's what compound interest is in action.
⚠️This is about theory. In practice, it is impossible to achieve a constant percentage of profit every day. Some days a trader inevitably ends up with a loss, some with a profit, and the size of these losses and profits is always different. So it is unlikely to substitute the value of the percentage of profit per day in the above formula. However, the very essence of compound interest, clearly shown above in figures, gives the trader a fairly powerful tool for earning. A trader can and should use compound interest when creating his own money management system.
❤️ Please, support our work with like & comment! ❤️

Moving Average | Two Profitable Ways to Use 📊
Hey traders,
In this post, we will discuss two efficient ways to apply the moving average(s) indicator in your trading.
Please, note that the settings for a moving average depend on many factors and can not be universal. Time frame, your style of trading and many other factors should be taken into consideration when you define the settings.
1️⃣The first very efficient way to apply moving average is to consider that to be a strong support/resistance. Such a method is appropriate for trend-following traders.
A very important condition to note applying MA as the structure is that the market should be trending: it should trade in a bullish or bearish trend, not in sideways.
📍In a bullish trend, a moving average will provide you a relatively safe point for buying the market after a pullback. Quite often after a test of MA, the price tends to bounce all the way up to a current high and even go higher to the next highs.
📍In a bearish trend, a moving average will serve as a strong resistance and quite often will indicate a completion point of a retracement leg after a strong bearish impulse.
2️⃣The second way to apply moving average is to apply a combination of 2 MAs with different settings (one with a bigger and one with a smaller length). Such a method is usually applied by counter-trend traders.
And again, a very important condition to note, is that if you want to apply this method efficiently, remember that the market must be trending, it should be bullish or bearish.
Your task will be to track an intersection of two MAs.
📍In a bullish trend, a crossing of two moving averages with a high probability will indicate a trend violation and initiation of a new bearish trend.
Such a signal usually serves as a trigger to open a short position.
📍In a bearish trend, a crossing of two moving averages will signify a violation of a bearish trend and the start of a new bullish trend.
The intersection by itself will be a signal to open a long position.
Your task as a trader is to find the most accurate inputs for MAs. With backtesting and experience, you will find the settings applicable to your trading style.
What indicator do you want to learn in the next post?
❤️If you have any questions, please, ask me in the comment section.
Please, support my work with like, thank you!❤️

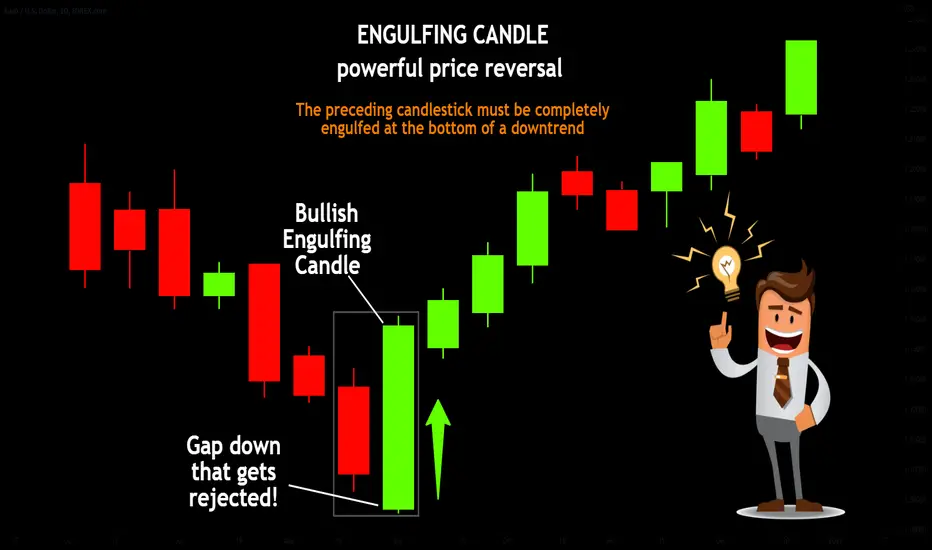
ENGULFING CANDLE | powerful price reversal📚
✅The engulfing model (external bar) is mainly a reversal pattern (although in rare cases it may indicate a continuation of the trend). It looks like two candles, the first of which is small, and the second is large, with a body larger than the entire previous candle, and directed in the opposite direction.
✅From the point of view of crowd movement, such a pattern means that the strength of the current trend is drying up (this is evidenced by the small size of the first engulfing candle). The crowd does not know in which direction to move and, figuratively speaking, is marking time. The appearance of a powerful candle that absorbed the previous one and closed in the opposite direction marks the beginning of a new, strong trend.
⚠️There are several mandatory conditions that the pattern must meet in order for its signal to provide the maximum probability of working out:
1️⃣Before the pattern itself, there must be a downtrend or an uptrend in the market. The movement may be small, but its presence is mandatory;
2️⃣The body of the second candle should be of a different color and orientation (bearish after bullish and bullish after bearish). Shadows may not be absorbed, but then the signal is considered weaker;
3️⃣The body of the second candle should have a contrasting color with respect to the body of the first. The exception is when the body of the first candle is very small (doji or close to it).
❤️ Please, support our work with like & comment! ❤️
Overextended Markets (Overbought And Oversold)1) Bollinger Bands:
Some traders will determine the market as "over-extended"
when the price is piercing above or below the Bollinger bands.
If above then the price is considered overbought and price may start to reverse.
If below then the price is considered oversold and the price may start to reverse.
2) Stochastic RSI:
some traders will determine the market as "over-extended" once the price is over the 70% line or below the 30% line.
The bottom 30% means the price might be oversold and buyers are projected to come in.
When the price is above the 70% line the market is considered overbought and sellers are projected to come in.
3) Supply And demand
When we have 3x continuation patterns in a row DBD or RBR in a row, we can draw a downward or upward aggressive trend line (momentum line).
When this happens, we consider the market overextended and call it the “elastic band effect”.
stretch out an elastic band to the breaking point and let go, the elastic band snaps back at a high-speed force and hurts.
This is the same for trading, When the market is overextended and breaks the downward or upward momentum line, we can assume the market will snap back and remove 2 if not 3 of the opposing zones that gave us the ability to draw the aggressive momentum line.
Buying or selling the pullback into the demand or supply is usually a good call if the criteria are met for a good trade.

3 Important Terms Every Trader Must Know | Trading Basics📚
Hey traders,
In this post, we will discuss 3 very important market situations that every trader must be able to recognize: breakout, retest, and fakeout.
❗️Please, note that the essential element of all these terms is structure: vertical and horizontal key levels.
📍Breakout is a situation when the market breaks the identified horizontal support or resistance, or a vertical trend line.
Breakout is a very important event that signifies the willingness of buyers/sellers to violate the structures. Violation of support signifies a strong selling pressure while a violation of resistance signifies a high buying momentum.
Usually, the structure breakout is confirmed with a candle close.
For confirmation of a breakout of support, a candle close below that is needed.
For confirmation of a breakout of resistance, a candle close above is required.
📍Retest is the situation when the price returns back to broken horizontal support or resistance, or a vertical trend line after a confirmed breakout.
For a structure breakout, high trading volumes are needed. Usually, after a breakout, the market participants are locally exhausted and a correctional movement follows. That may lead to a retest of a broken structure.
Most of the time, after a retest a strong impulse follows. For that reason, for many traders, the retest is applied for trading entries.
📍Fakeout or false breakout is the situation when the price has not enough strength to maintain its direction after a retest of a broken structure. Instead, the market returns back below/above the broken resistance/support.
Fakeout is one of the main reasons, why structure traders lose money.
One of the ways to avoid fakeout is to monitor trading volumes during a structure breakout. A volume spike is needed to confirm the strength of the market participants while low volumes most of the time signify a manipulation.
Learn to spot breakouts and false ones, and try to trade on a retest.
Let me know what do you want to learn in the next post?
❤️If you have any questions, please, ask me in the comment section.
Please, support my work with like, thank you!❤️

NZDCAD | BULL TRENDNZDCAD has given a breakout from falling trendline and retested it, confirming bullish breakout.
The pair is in good shape for bull trend as it is printing higher highs and higher lows.
The next hurdle is 50% Fib level where is got rejected.
We are expecting bulls to continue the momentum and safest entry will be on breakout.
Trade your levels accordingly.

Supply & Demand Zones - Learn To Trade Like A ProHello Traders, here's an educational post about how to trade Supply & Demand Zones.
First off I would like to say... I highly recommend that you watch some youtube videos on this topic.
I can only cover so much in one post and you will have a much better understanding of these zones after watching some videos.
Either way Supply & Demand zones are one of the most effective methods for trading and if you can learn to master them you can make a lot of money.
Supply & Demand Zones
- S&D zones are exactly what they sound like. They are zones where Supply & Demand exist... (Again, please watch some videos to understand this better)
- Basically, they are areas on the chart where there is heavy buying and selling pressure.
- At S&D zones, there is a high probability that price will get rejected from those levels.
- Knowing this we can take either a long or short trade.
- There are actual technical reasons why price should get rejected at these levels. Knowing this we have a higher probability of success.
***An important thing to note is that you don't just enter a trade every time a S&D zone is hit. You want to look for signs of reversal.
This is pretty easy to spot if you understand candlestick formations. Look for reversal candles, you can also check the shorter time frames to see if price is struggling to break the level.
That's pretty much it for the post, a visual representation is much more effective in this situation so please reference the chart.
***Once again please watch some videos. I gave you they basic info but there is still much more to learn regarding this topic.
Supply & Demand Zones are one of my favorite ways to trade so I really hope everyone enjoys this posts!
Thanks everyone and best of luck trading!

Candlestick Action | How Candles Are Formed🕯
❗️Japanese candlesticks as a technical analysis tool were invented earlier than others, but they were not widely used immediately. By the name, it is easy to guess that Japan became the "homeland": local rice traders used this method already in the 18th century. However, due to the geographical remoteness and closeness of the country from external "visitors", this type of chart gained popularity much later, when exchange life was already actively boiling in Europe and the USA.
✅What is hidden behind the candlestick chart?
🟢A candle is formed from 4 prices: opening, closing, high and low for a certain period of time. If we take a timeframe of a minute, then each candle will indicate the price movement within this minute, if an hour is inside an hour, if a day is inside a day. The distance between the opening and closing price is the "body" of the candle, and the tails show to what lows and highs the price reached. If the opening price was higher than the closing price, then the candle will be black; and vice versa: if the opening price is lower than the closing price, then the candle will be white. It turns out that candles are, in fact, the psychology of the market, they most accurately reflect the fears and hopes of its participants.
🟢The charts of Japanese candlesticks themselves are valuable for analysis: the resulting models are interpreted as models of reversal or continuation of the trend. It is also important to understand: each individual candle or a combination of candles is just a way of depicting the actions and moods of all bidders for the period we have chosen (day/week/ month, etc.). The fact is that human behavior is quite formulaic in the same situations, and that is why various methods of chart analysis are so popular with investors and traders.
🟢Looking at only one or several candlesticks, a "savvy" viewer can easily understand whether the market is set to rise or fall, change the current trend or its continuation, increase the momentum of movement or its attenuation.
⚠️It is important to understand that the behavior of individual bidders develops into a general market movement, which can be "read" using charts of Japanese candlesticks and their basic models. Therefore, your optimal investment decisions will be supported by the most effective moments of entry or exit from the position, which will significantly improve the financial result.
❤️ Please, support our work with like & comment! ❤️

ow to Apply Trailing Stop | PRICE ACTION TRADING 📚
Hey traders,
In this post, I will share with you my strategy to apply a trailing stop.
Please, note that I am applying a trailing stop only in trend-following trades and only when a trade is opened on a key level. I trade price action patterns, so the following technique will be appropriate primarily for price action traders. Moreover, my entries are strictly on a retest.
1️⃣
Spotting a price action pattern I am always waiting for its neckline breakout. (if we talk about different channels, then by a neckline we mean its trend line)
Once I see a candle close below/above the neckline, I set my sell/buy limit order on a retest.
Stop loss will strictly lie below the lows of the pattern if we buy and above the highs of the pattern if we sell.
2️⃣
Once we are in a trade, you should measure the pattern's range (distance from its high to its low based on wicks) and then project that range from the entry to the direction of the trade.
In the picture, the pattern range and its projection are the underlined blue areas.
Once the price reaches the projection of the pattern's range, you should move your stop loss to entry and make your position risk-free.
Move stop to breakeven in traders' slang.
3️⃣
Then you should let the market go.
📈If you are holding a long position you should let the market retrace and set a higher low and then a new higher high or AT LEAST an equal high. Once these conditions are met you can trail your stop and set it below the last higher low.
📉If you are holding a short position you should let the market retrace and set a lower high and then a new lower low or AT LEAST an equal low. Once these conditions are met you can trail your stop and set it above the last lower high.
Catching a trending market you should trail your stop based on new higher lows / lower highs that the price sets. Occasionally you will catch big winners.
How do you apply a trailing stop?
❤️If you have any questions, please, ask me in the comment section.
Please, support my work with like, thank you!❤️

Morning Star Pattern: how to trade?🌟
❗️The Morning Star pattern is a market reversal pattern consisting of three candlesticks that indicate bullish superiority. This pattern warns us about the weakness of the ongoing downtrend, which, in turn, suggests the beginning of an uptrend.
⚠️Traders observe the formation of the "Morning Star" pattern on the price chart, and then confirm with the help of other technical tools on the Forex currency market.
✅Morning Star pattern: Three forming candles
⏺Big Bearish Candle
⏺A small bullish or bearish candle
⏺Big Bullish Candle
The most important thing to remember is always that the market must be in a downtrend in order to trade according to the "Morning Star" pattern.
In order to confirm the downtrend, mark the lowest lows and the lowest highs.
1️⃣The big bearish candle is the first part of the Morning Star reversal pattern. This candle indicates that the bears are in full control of the market, which means that sellers continue to pressure the market.
At the moment, you should only look for sale deals, since there are no signs of a reversal yet. Here the Morning Star pattern is just beginning its formation.
2️⃣A small bullish/bearish candle is the second candle that starts with a bearish gap down. This candle indicates that sellers are unable to lower the price, despite very great efforts.
The price action ends with the formation of a rather small bullish/bearish candle (Doji candle).
If this candle is bullish, then we have an early sign of a trend reversal.
3️⃣A large bullish candle is the third candle that has the greatest significance, because here the real pressure of buyers is manifested. If the candle starts with a break, and buyers can push prices up by closing the candle even above the first red candle, this is a clear sign of a trend reversal.
✅Morning star: how to trade this pattern on Forex?
As we already know, the Morning Star pattern is a reversal pattern. As a rule, it indicates that bulls are capturing the trend, and bears are losing control.
Most beginners trade using the "Morning Star" pattern on their own, without using technical tools, or at least tips from more professional traders.
We do not recommend doing this — it is not as reliable as it may seem. Always connect this pattern with other reliable indicators, support and resistance levels, as well as trend lines.
So, in this strategy, we combined the Morning Star pattern with volume. Volume plays an important role in the formation of the model.
If the first red candle shows a low volume, then this is a good sign for us. Then, if the second candle is green and the volume is growing, this indicates buyer pressure.
After all, the volume of the third long green candle should be high. The large volume of the last candle indicates the confirmation of the upcoming trend and the entrances to purchase transactions.
If the third bullish candle has a low volume, do not pay attention to the fact that the Morning Star is forming. This volume does not indicate a bullish reversal.
To sum up: do you observe the closing of the third candle with a large volume? Open buy positions and move along with the uptrend until there are signs of a reversal.
✅Morning Star pattern: entry, take profit and stop loss
We have to open a deal when the next green candle closes. There are many ways to lock in profits.
We can close a position in any resistance zone or supply-demand zone. In this deal, we hold our positions because we have opened a deal since the beginning of a new trend.
You can also close your positions when the price approaches a significant resistance level on the higher timeframe.
⚠️Combining this pattern with volumes makes trading more reliable. Therefore, you need to place a stop loss just below the second candle.
❤️ Please, support our work with like & comment! ❤️

What is a Gap in Trading? | Different Types of Gaps Explained 📚
Hey traders,
In this article, we will discuss a very common pattern that is called gap.
In technical analysis, the gap is the difference between the closing price of the previous candlestick and the opening price of the next candlestick.
📈Gap up represents a situation when the price bounces up sharply at the moment of a transition from one candlestick to another. The price gap that appears between them is called gap up.
📉Gap down represents a situation when the price drops sharply at the moment of a transition from one candlestick to another, the price gap between the closing price of the previous candle and the opening price of the next candle is called a gap down.
From my experience, I realized that with a high probability the gap tends to be filled. For that reason, once you see a gap, consider trading opportunities around that.
Depending on the market conditions where the gap appears, there are several types of a gap to know:
1️⃣Common gap appears in a weak, calm market. When the trading volumes are low and the market participants are waiting for some trigger, or the asset reached a fair value price.
2️⃣Breakaway gap appears in a situation when the price suddenly breaks a structure (support or resistance) in a form of a gap.
Such a gap usually confirms a structure breakout.
3️⃣Runaway gap usually appears when the market is growing or falling sharply. It signifies the dominance of buyers/sellers and highly probable continuation. Usually, such gaps are not filled.
4️⃣Exhaustion gap is, in contrast, appears around major key levels and signifies a highly probable reversal. The exhaustion gap is usually confirmed by a consequent strong opposite movement that fills the gap.
Learn to recognize gaps on a chart and learn to interpret them. It will increase the accuracy of your technical analysis.
❤️If you have any questions, please, ask me in the comment section.
Please, support my work with like, thank you!❤️

Support & Resistance Levels | Trading Basis📚
❗️The concepts of support and resistance are fundamental concepts of technical analysis of financial markets. They are applicable to almost any market, be it stocks, Forex, gold or cryptocurrency.
❗️And although these concepts are easy to understand, in practice they are quite difficult to master, since the definition of levels is completely subjective, and their behavior depends on many conditions. So first of all it is important to learn to distinguish their types. To do this, you will have to familiarize yourself with a lot of graphs, and this guide will help you.
✅What is support and resistance?
🟢At the most basic level, support and resistance are simple concepts. To determine them, the maximum and minimum price indicators are displayed, acting as a kind of barrier. At the same time, the lower values of the chart represent the support level, and the upper values represent the resistance level. In fact, the level of support can be viewed from the point of view of demand, and the level of resistance – from the point of view of supply.
🟢Despite the fact that support and resistance levels are usually denoted by lines, in reality they usually look different. It should be borne in mind that markets are not governed by any physical law that does not allow indicators to go beyond a certain level. Therefore, it is more appropriate to consider support and resistance levels as areas. You can imagine these areas as ranges on the price chart, the approach to which is likely to cause increased activity of traders.
✅How Traders Use Support and Resistance levels
🟢Technical analysts use support and resistance levels to identify areas of interest on the price chart. At these levels, the main trend is likely to change its direction.
🟢Market psychology plays an important role in the formation of support and resistance levels. Traders and investors are guided by price levels that previously caused increased interest and trading activity. These areas will contribute to increased liquidity as many traders will be tracking the same price levels. Often, support and resistance zones create ideal conditions for entry or exit from a position for large traders.
🟢The concepts of support and resistance levels are key to effective risk management. Your trading opportunities may depend on your ability to consistently identify these zones. Usually, after the price reaches the support or resistance area, two possible events are possible. It either bounces off this area, or breaks through it and continues moving in the direction of the trend to the next potential support or resistance area.
🟢It is best to enter a trade when the price is near the support or resistance level, mainly because of its relative proximity to the cancellation point, where a stop loss order is usually placed. In case of a breakthrough of the area and invalidation of the transaction, traders will be able to reduce their losses, because the further the entry is from the supply or demand zone, the further the point of invalidation of the transaction.
🟢At the same time, you need to understand how these levels will change depending on changes in the situation on the chart. As a rule, a breakdown in the support area can turn it into a resistance area. Conversely, a broken resistance area may turn into a support area when it is retested. This pattern is called the support-resistance flip.
⚠️How to draw support levels correctly?
⏺Reduce the timeframe of your charts so that you can see the bigger picture.
⏺Draw the most obvious levels that tend to have the strongest price bounces.
⏺Adjust your levels to get the maximum number of touches.
❤️ Please, support our work with like & comment! ❤️

10 Trading Commandments of a Successful Trader 📜
Hey traders,
In this post, we will discuss 10 divine rules that every trader must obey:
1️⃣ - Accept that risk and losses are a necessary part of trading.
Even though most of the traders are looking for a holy grail, for a system that produces 100% win rate, in fact, losses are inevitable, they are part of the game.
No matter how good you are as a trader, occasionally, the market will outsmart you.
2️⃣ - Have a proven trading system.
Trade only with a trading strategy that you backtested, that proved its accuracy and efficiency.
3️⃣ - Concentrate on the risk, not the reward.
Cut losses, and control your risk. Remember about risk management and never neglect that.
4️⃣ - Never trade without stop loss.
Some traders say that they can easily control losses without stop loss. Don't listen to them. Always set a stop loss once you are in a trade.
5️⃣ - Have an attainable target.
Setting a stop loss remember to know where to close your trade in profit. Follow strict rules and do not let your greed take you under control.
6️⃣ - Take your emotions under control.
No matter whether you are losing, winning, or do not see any trading setups to trade, your emotions will always try to distract you.
Be cold-hearted.
7️⃣ - Always stick to your trading plan.
Never break your rules, follow your system, and do not deviate.
Your trading plan is your only map.
8️⃣ - Limit your losses, never limit your profits.
While your gains can be scalable, your risks and losses must be fixed.
9️⃣ - Treat your trading as a business.
Trading should be treated with the same discipline as a business.
Every business has a solid business plan which entails how the day-to-day running of the business is done, and this also guides the decision-making process.
🔟 - Always journal your trades.
Always keep a trading journal. Record your winners and losers, entry reasons, mistakes, failures etc. Revise and learn from your mistakes.
Of course, that list can be extended and more commandments and rules can be added. However, these 10 in my view are the most important. Print this list and let it guide you in your trading journey.
What would you add to that list?
❤️If you have any questions, please, ask me in the comment section.
Please, support my work with like, thank you!❤️

Keep your trading charts clean!🧹
✅Keeping Charts Clean: Since a trader's charting platform is his or her portal to the markets, it is important that charts improve rather than hinder a trader's market analysis. Easy-to-read charts and workspaces (the entire screen, including charts, news feeds, order entry windows, etc.) can improve a trader's situational awareness, allowing him to quickly decipher market activity and react to it. Most trading platforms allow you to largely customize the color and design of the chart, from the background color, style and color of the moving average to the size, color and font of the words that appear on the chart. Setting up clean and visually appealing charts and workspaces helps traders use indicators effectively.
✅Information overload: Many modern traders use multiple monitors to display multiple charts and order entry windows. Even if six monitors are used, you should not consider every square inch of the screen as technical indicators. Information overload occurs when a trader tries to interpret so much data that in fact they are all lost. Some people call this analytical paralysis; if too much information is presented, the trader will most likely not be able to respond. One way to avoid information overload is to exclude any extraneous indicators from the workspace; if you don't use it, lose it – this will help reduce clutter. Traders can also view charts to make sure they are not burdened with multicollinearity; if multiple indicators of the same type are present on the same chart, one or more indicators can be deleted.
✅Tips for organizing: Creating a well–organized workspace using only relevant analysis tools is a process. The set of technical indicators that a trader uses may change from time to time depending on market conditions, strategies used and trading style.
❗️On the other hand, charts can be saved if they are configured in a user-friendly form. There is no need to reformat the charts every time the trading platform closes and reopens. Trading symbols can be changed together with any technical indicators without disturbing the color scheme and layout of the workspace.
✅Recommendations for creating easy-to-read diagrams and workspaces include:
⏺Colors. The colors should be easy to view and provide great contrast so that all data can be easily viewed. In addition, one background color can be used for order entry charts (the chart that is used to enter and exit a trade), and a different background color can be used for all other charts of the same symbol. If more than one symbol is traded, you can use a different background color for each symbol to simplify data isolation.
⏺Layout. Having more than one monitor helps to create a comfortable workspace. One monitor can be used for entering orders, and the other for price charts. If the same indicator is used on several charts, it is recommended to place similar indicators in one place on each chart using the same colors. This makes it easier to find and interpret market activity on individual charts.
⏺Sizes and fonts. Bold and clear font makes it easier for traders to read numbers and words. Like colors and layout, font style is a preference, and traders can experiment with different styles and sizes to find a combination that creates the most visually pleasing result. Once convenient labels are found, fonts of the same style and size can be used on all diagrams to ensure continuity.
⚠️It is important to note that technical analysis deals with probabilities, not certainty. There is no combination of indicators that accurately predicts market movements in 100% of cases. While too many indicators or improper use of indicators can blur a trader's view of the markets, traders who use technical indicators carefully and effectively can more accurately determine trading attitudes with high probability, increasing their chances of success in the markets.
❤️ Please, support our work with like & comment! ❤️

MAIN ELEMENTS OF YOUR TRADING PLAN | Trading Basics 📝
Hey traders,
One month ago I wrote an article about the importance of a trading plan. Now it is time to discuss what should be inside your trading plan.
Before we start let me note that a trading plan is a very personal thing and depending on your personality you may have some other elements. In this article, we discuss key elements that must be in every trading plan.
🔰Trading Strategy.
I want you to realize that a trading strategy is not a trading plan. A trading strategy is simply one of its main elements.
A trading strategy defines a set of rules and market conditions that one is looking for to open a trade and then manage that.
🔰Trading Time.
Relying on your trading strategy you should know exactly when you trade. The time range must be precise and fixed. If you think that today you can trade the opening of the London session, tomorrow the Asian one, and then the US opening, I have very bad news for you.
Your trading hours must be fixed and objective.
🔰Trading Instruments.
As with your trading time, you should have a fixed trading list. A set of financial instruments that you monitor on a daily basis.
🔰Trading Journal.
You should learn to journal your trades. Just a single performance is not enough. You should note the exact market conditions that made you open the trade and many other factors that you consider to be important.
Then learn from your mistakes and improve your trading strategy based on your journal.
🔰Risk Management.
Having the best trading strategy in the world one can fail simply because of neglecting the rules of risk management.
Define your risk per trade, maximum drawdown, and biggest losing streak you can take.
Optimize your trading to keep your losses under control.
Of course, that list can be extended. We can add, for example, trading psychology into that.
As I said, a trading plan is a very personal thing and while you mature in trading it will become more and more sophisticated.
The elements that we discussed in this article are crucial for your success in trading. In my view, their absence will lead you to a failure.
What do you want to learn in the next article?
❤️If you have any questions, please, ask me in the comment section.
Please, support my work with like, thank you!❤️
