Dont predict&anticipate the market - ask indicators for hints! Hello everyone! how was the HSI trade so far?
Apologies for not updating as I was allowing myself to take a pause journaling my trade also to pay attention on my own personal growth journey. However, am continue to trade HSI in sustainable and profitable way and have had trying and test using different combination of indicators that bring quite positive results since.
Sharing this with anyone that reading this.
Please note that this is just for my own experiences and please DYODD.
For Swing Trade Test: (some steps to consider for entry set up - setting your time frame)
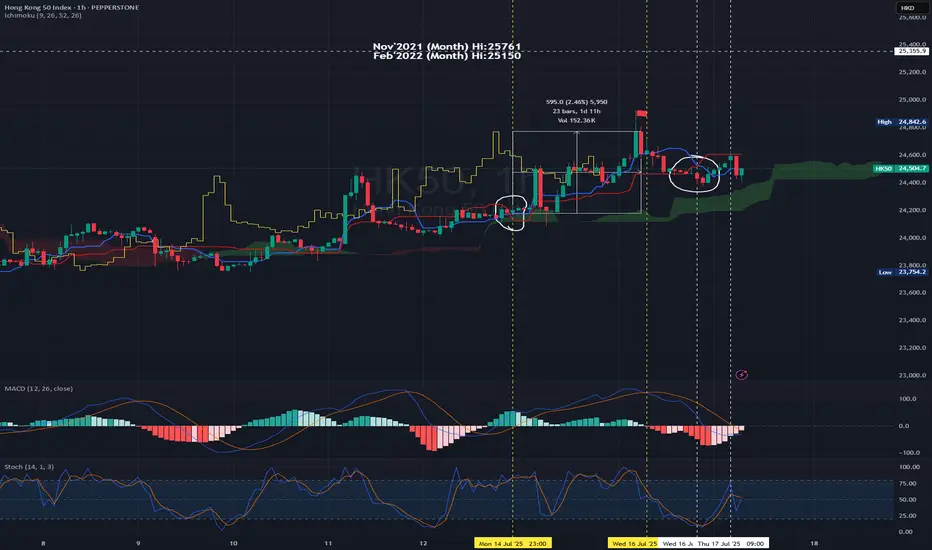
E.g using 1H Chart - 14Jul2025 23:00
MACD - entering the above zero line - it breaks above zero level on the next candle. Turned bullish confirmation.
Using Ichimoku Cloud for trend confirmation.
Once the MA9>MA26 the blue line crosses above red line (circled in white). This is a bullish confirmation and it is trading above green cloud.
You may pay attention to set your entry point.
Set Up : on the next candle open - you may open Long position - 24204.90 Set SL with R/R Ratio 1:1 or 1:1.1-1.25 (or in accordance to your risk appetite or carry out backtest and to be realistic)
Taking Profit : You may pay attention to be more aggressive to TP only when the MACD is forming DeadCross i.e 16Jul2025 11:00 (using the same timeframe chart).
For the reversed side it's the same methodology. But it's recommended to Short if and only if when the candles are closed below cloud + MACD is on the bearish zone.
So, in this case, I will not open short position as it's not the normal underlying HSI trading hour, so we wait till the underlying normal trading hour commence.
Today HK50 PEPPERSTONE:HK50 open at 24567, you may decide if you would to short and setting SL and TP.
From chart, you may open short position with R/R : 1.1.1 (TP : 24:400; SL : 24772) Entry: 24596 (the next hour candle at 10:00, of course you may cross check with shorter time frame to 'catch the high' 😂)
Trade for profit requires persistency and consistence.
There is quite a wide range to trade in between the movement.
Buy into Support Sell at resistance.
Set your TP/SL & protect your capital.
at point of writing ✍️: the Index uptrend mode is on track.
currently on D Chart -
🗝️ Resistance Level : 24600-24700
🗝️ Support Level : 24370-24400
🗝️ Strong Support Level : 24030-24300
Higher Hi🚩point marked in Chart
21May2025 -23909
11June2025 -24430
25June2025 -24531
16Jul2025 - 24842
?? ??2025 - 25907 Target
Opinion: continue Bullish and shall breaks the recent Hi of 24900 and target could break 25200-25750 pretty soon (the Gravity Line upper band).
The Index is now on the intermediate bullish trend (not far off from Gravity line and not yet touch the Gravity Upper band or beyond for D chart) - Shall publish this indicator.
From previous posts:-
W Chart:- HSI continues its Bullish mode with strong pullback! Recovery could expected to see in end Jun - early Jul'25.
14Jul2025 -
at point of writing ✍️:
Perhaps it shouldn't been said as recovery but continue the uptrend.
As we can notice from the latest chart it seems to continue its uptrend momentum even MACD have had curving down after deadcross formed 12May25.
The MACD signal line staying above zero level.
Continue the Long call for HSI with the forecast and repetitive of history the next 4-6 weeks might be a good profit to hold Long position.
🚨However, please take note that the index is moving beyond the Gravity upper brand on W chart which we should monitor closely to TP and enter again for healthy retracement.
🎯 Reminder: For long term (6-18 months) continue to accumulate China & HKG for the potential upside for the year! All retracement is a good entry point. Again, everything is impermanence. Manage your risk, position sizing. Take only the risk that you can afford.
For HSI HSI:HSI
Recent Hi : 16Jul2025 - 24867.81 (trying to test the resistance at 19March2025@24874)- this ¬6.58pts seems took quite a while to break. Let's be patience.
🔎 DYODD and don't listen to anyone.
Invest in yourself, do some study and learn along the way while you trying to verify or finding the answer if to start invest in CHN/HKG markets.
If you don't know how or where, you may ask Deepseek/Chatgpt for most reputable Trading courses nearest to you.
Let's follow your own zentradingstrategy , continue to trade; a strategy is a raft—cross the river, but do not carry it on your back forever — Stay flexible. No method is permanent. Adapt, let go, grow.
** Please Boost 🚀, FOLLOW ✅, SHARE 🙌 and COMMENT ✍ if you enjoy this idea!
Share your trading journey here to encourage the community and friends who pursing the same journey.
Hang Seng HSI
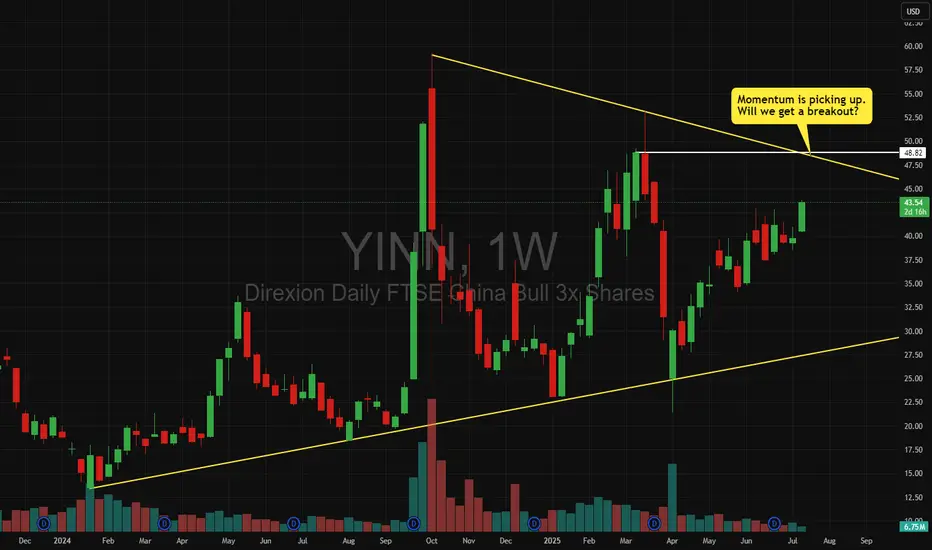
YINN - We could get a bullish breakout of the triangleMomentum seems to be picking up.
Will we a break out of the triangle?
Let's watch the $48 level.
Clean Energy: The Power That Will Shape Our FutureEnergy is the lifeblood of civilization—it fuels innovation, sustains economies, and powers every aspect of modern life. As demand skyrockets, we face a crucial decision: continue relying on fossil fuels that damage our planet or embrace clean energy solutions that pave the way for a sustainable future.
Despite geopolitical tensions, trade wars, and shifting policies around ESG and the Paris Climate Agreement, the clean energy sector remains unstoppable. While industries like digital finance, artificial intelligence, robotics, space exploration, quantum computing, and cloud infrastructure are experiencing unprecedented growth, they all hinge on one fundamental resource: energy. Without it, progress would stall.
Yet, as we race toward technological advancement, one truth remains: our planet’s well-being is inextricably linked to our energy choices. Sustainability is not just an option—it is a necessity.
The Four Elements of Clean Energy
Nature has already gifted us four forces of life—the sun, wind, water, and earth—each holding the potential to drive a clean energy revolution.
Solar Energy ☀️: Every hour, the sun showers Earth with more energy than humanity consumes in a year. Advances in photovoltaic technology are making solar power more efficient and affordable than ever. Countries leading the solar revolution—like China, Germany, and the U.S.—are setting a precedent for global energy transformation.
Wind Energy 🌬️: Harnessing the wind is one of the most effective ways to generate clean electricity. Offshore wind farms are growing at an exponential rate, proving that sustainable energy is not limited to land. The beauty of wind energy? It is limitless.
Hydropower 🌊: Water is power. Hydroelectric dams, tidal energy, and wave power offer continuous energy supply, proving to be one of the most reliable renewable sources available.
Geothermal Energy 🌍: Deep within the earth, heat energy is waiting to be tapped. Countries like Iceland have perfected the art of using geothermal power for electricity and heating, demonstrating that sustainable energy is not just a dream—it’s already reality.
Overcoming Challenges: The Resilience of Clean Energy
Yes, clean energy faces obstacles—tariff disputes, political instability, and corporate resistance. But progress is relentless. Costs of renewables are dropping, supply chains are adapting, and governments know that fossil fuels will not sustain global economies forever.
The Paris Climate Agreement keeps nations accountable, pushing for policies that support decarbonization and incentivize clean energy innovation. Meanwhile, ESG-driven investors are demanding sustainable business practices, forcing corporations to rethink their energy strategies.
Even legacy industries like oil and gas are shifting toward renewables, investing billions in solar, wind, and hydrogen technology. This is not just a trend—it is the future.
A Future Powered by Clean Energy
Imagine cities illuminated by solar grids, transportation fueled by hydrogen, and industries driven by wind power. Clean energy is not just about reducing emissions—it is about progress, prosperity, and survival.
The global energy demand is rising, but so is innovation. If space exploration, AI, robotics, and quantum computing are to thrive, clean energy must be at the core. And it will be—because the world is waking up to its necessity.
A cleaner, brighter future is not wishful thinking—it is already unfolding. The only question is: will we accelerate the transition, or hesitate in the face of change?
The time to act is now.
NASDAQ:CLNE NASDAQ:CETY NASDAQ:ICLN NASDAQ:CELS NASDAQ:GWE AMEX:PBD TVC:DXY

Hang Seng Index Pulls Back as Trade Deal Optimism FadesHang Seng Index Pulls Back as Trade Deal Optimism Fades
Yesterday, Hong Kong’s Hang Seng Index (Hong Kong 50 on FXOpen) climbed above the 23,600 mark, supported by progress made during US–China tariff negotiations.
However, today the Hang Seng Index (HSI) has dropped towards the 23,100 level, which may be explained by fading optimism that dominated the market a day earlier.
According to Reuters, Christopher Hodge, Chief Economist at investment bank Natixis, stated that “these talks will yield nothing of long-term value. Ultimately, tariffs will still be significantly higher and will weigh on US economic growth.”
Technical Analysis of the Hang Seng Index (HSI) Chart
Price movements are forming an upward trend channel (marked in blue), with the following features:
→ The price is situated in the upper half of the channel (a sign of demand), and the upper boundary appears to act clearly as resistance;
→ Yesterday’s reversal suggests that bears became active above the former support area near the 23,385 level.
In this context, it is reasonable to assume that the Hang Seng Index (Hong Kong 50 on FXOpen) may test the support zone formed by the psychological level of 23,000 and the median line of the ascending channel. If the fundamental backdrop gives markets more reasons for caution, a deeper correction towards the lower boundary of the blue channel cannot be ruled out.
This article represents the opinion of the Companies operating under the FXOpen brand only. It is not to be construed as an offer, solicitation, or recommendation with respect to products and services provided by the Companies operating under the FXOpen brand, nor is it to be considered financial advice.

HSI on the climb—ride the waves with your own strategy!6May2025
Hello everyone! how was the HSI trade so far?
From the previous updates trust everyone likely knows how the movement of the Index.
Paying attention on how it moved and the forecast of futures movement seems predicted. Of course, some times it may not go according to what you forecasted. Hence, to develop your own trade plan is essential.
From previous posts:-
MACD - Deadcross formed 20/3/2025 on D Chart.
MACD - Goldencross formed 21Apr2025 on D chart, although still within bearish zone but it did a short bull run since then; opened at 21015 on 22Apr and as of writing 22613; it gives around 1598pts ~7.6% gained.
CAPITALCOM:HK50
Fast forward to now:-
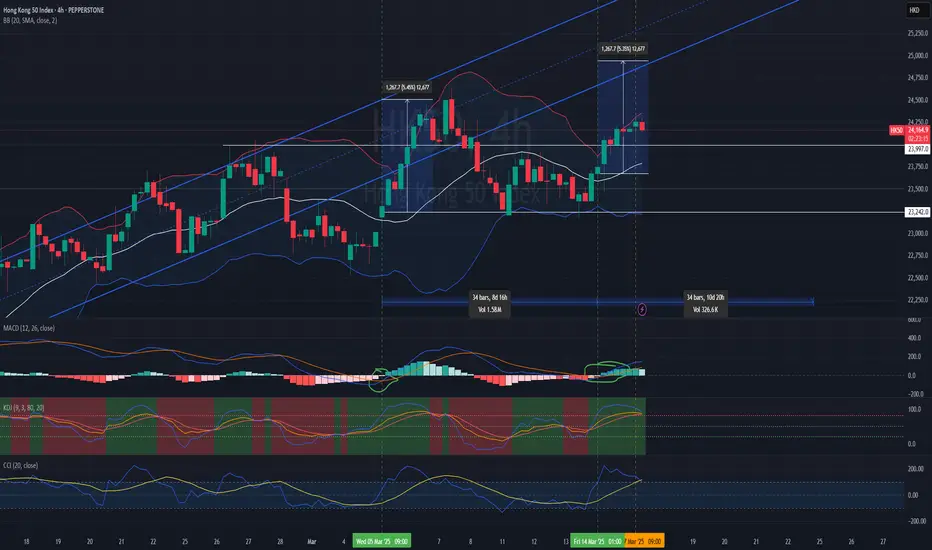
4H chart
at point of writing ✍️: the Index uptrend mode is on track again.
Trade for profit requires persistency and consistence. The constancy is kind of boring.
Buy into support Sell at resistance.
Set your TP/SL & protect your capital.
currently on D Chart -
20EMA:22065; 50EMA:22080 (both are sticking together at the moment and curving up)
🚨 as of ✍️ :
🗝️ Resistance Level : 22700-22730
🗝️ Support Level : 22360-22400
🗝️ Strong Support Level : 21950-21990
W Chart:- HSI:HSI
HSI continues its Bullish mode with strong pullback! Recovery could expected to see in end Jun - early Jul'25.
17Mar2025 -
24Mar2025 -
7Apr2025 -
6May2025 -
Continue the Long call for HSI:HSI with the forecast and repetitive of history the next 4-6weeks might be a good profit taking level; hold any long position and manage the risk as well.
Target to take profit: 24630-24910 (it may break 25000 level, and paused at 25300 strong resistance level, you may crosscheck with Month chart for the Bullish trend; last week the MACD signal line break above the zero level.)
For current markets condition, the CHN & HKG continue to be volatile with the continuing noise from tariff and on macro the numbers could be mixed.
🎯 Reminder: For long term (6-18 months) continue to accumulate China & HKG for the potential upside for the year! All retracement is a good entry point. Again, everything is impermanence. Manage your risk, position sizing. Take only the risk that you can afford.
🔎 DYODD and don't listen to anyone. Invest in yourself, do some study and learn along the way while you trying to verify or finding the answer if to start invest in CHN/HKG markets. If you don't know how or where, you may ask Deepseek/Chatgpt for most reputable Trading courses nearest to you.
Stay sharp, trade smart, and let consistency be your superpower. 📈🍵📙
Continue to trade; continue your life as it is!
Happy Trading!
** Please Boost 🚀/LIKE 👍, FOLLOW ✅, SHARE 🙌 and COMMENT ✍ if you enjoy this idea! Share your trading journey to encourage peoples who pursing the same journey.

Hang Seng Index Plunges by Around 13%Hang Seng Index Plunges by Around 13%
Hong Kong’s Hang Seng Index (Hong Kong 50 on FXOpen) tumbled by over 13% as trading resumed after the weekend with a sharp bearish gap.
According to media reports, this marked the biggest single-day drop since the 1997 Asian financial crisis.
Hang Seng Index Chart
In our analysis of the upward trend on the Hang Seng (Hong Kong 50 on FXOpen) chart a month ago, we noted that:
→ investor enthusiasm around artificial intelligence was still fuelling the rally;
→ however, the price appeared vulnerable to a correction.
We also highlighted that the outlook would largely depend on the fundamental backdrop, particularly the tariff standoff between China and the United States.
Since then, the Hang Seng Index (Hong Kong 50 on FXOpen) has fallen by around 17%, following the announcement of harsher-than-expected tariffs by President Trump, with China responding in kind.
Despite the drop, Hang Seng is outperforming peers
Despite Monday’s dramatic decline, the Hang Seng is still outperforming several other markets. As shown in the chart above, it remains in positive territory for 2025, unlike:
→ the ASX 200 (Australia 200 on FXOpen);
→ the S&P 500 (US SPX 500 mini on FXOpen);
→ and other global indices, including those in Europe and Japan.
What lies ahead?
Market sentiment remains highly sensitive to tariff-related news. For instance, Bloomberg reported that a post on social media platform X claimed President Trump was considering a 90-day pause on tariffs (excluding China), sparking hopes of a rebound.
Should Trump choose to soften the recently announced tariffs, this could act as a catalyst for a strong recovery across global equity markets.
This article represents the opinion of the Companies operating under the FXOpen brand only. It is not to be construed as an offer, solicitation, or recommendation with respect to products and services provided by the Companies operating under the FXOpen brand, nor is it to be considered financial advice.

what's next after historic plunged? what's next after historic plunged?
HSI needs to claw its way back - resistance now takes the spotlight!
🚨🚨🚨
🔎🎯 Always ask before you open a position, what's your time frame!?
Follow this principle for your trade for entry and exit so you will not lost on that particular trade. Happy trading everyone! 💰
From previous posts:-
MACD - Deadcross formed 20/3/2025 on D Chart.
4H chart:
at point of writing ✍️: the Index uptrend mode is broken where we have been reviewing the movement of the Index.
For this week trade plan: Most likely short the index for days to few weeks until get confirmation of reversal back to uptrend.
For swing trade: Buy into support Sell at resistance.
Set your TP/SL & protect your capital.
PEPPERSTONE:HK50
On 7Apr25 - special Monday, HSI dropped 13.22% ; 3021.51pts to close at 19828.30. The Index below its 20MA@22814 (currently); 50MA@22509 (currently)
This is the historic largest single day plunge since 1997 Asian Financial Crisis.
Historically, the HSI has experienced significant single-day drops during major financial crises. For instance, that was on October 28, 2008, amid the global financial crisis, the HSI fell by 12.7%, marking its biggest single-day percentage drop since 1997.
Well, human beings shape history. While it may not repeat the same way, but often returns in similar forms and familiar contexts. We are the innovative and creativity creatures on this earth, hence we are free to craft the stories eventually become history.
PEPPERSTONE:HK50
currently the 20MA:22581; 50MA:22423
🚨 as of ✍️ :
🗝️ Resistance : 20632
Resistance Level : 20143 20266
Support Level : 18830 19450
🗝️ Support : 18751
W Chart:- HSI continues its Bullish mode with strong pullback! Recovery could expected to see in end Jun - early Jul'25.
17Mar2025 -
24Mar2025 -
7Apr2025 -
For current markets condition, the CHN & HKG can be volatile with the continuing noise from tariff.
🎯 Reminder: For long term (6-18 months) continue to accumulate China & HKG for the potential upside for the year! All retracement is a good entry point.
🔎 DYODD and don't listen to anyone. Invest in yourself, do some study and learn along the way while you trying to verify or finding the answer if to start invest in CHN/HKG markets. If you don't know how or where, you may ask Deepseek/Chatgpt for most reputable Trading courses nearest to you.
Let's follow our own zentradingstrategy , continue to trade and zen with 📙 and 🍵 for profits.
** Please Boost 🚀/LIKE 👍, FOLLOW ✅, SHARE 🙌 and COMMENT ✍ if you enjoy this idea! Share your trading journey to encourage trading and investment buddies.

HSI testing resistance levels —will it break through or bounced?25/03/2025
🚨🚨🚨
HSI resistance is being tested for short-term!
Investors tend to take profit towards quarter end.
HSI:HSI
MACD - Deadcross formed 20/3/2025.Resistance 24750-24600 level.
4H chart: PEPPERSTONE:HK50
at point of writing ✍️: the Index uptrend mode is paused and moving out of bound from the uptrend channel.
MACD : moving below zero line - Bearish mode.
KDJ: below 30 level in the bearish zone. Hopefully the divergence cycle completing soon for a strong reversal.
BB - ranging at lower BB; mid-line:23986 (this is your 🗝️ level for your long/short TP/SL level)
Set your TP/SL and let the markets works.
For this week trade plan: Most likely short the index for days to few weeks until get confirmation of trendline back to uptrend channel. Buy into support Sell at resistance. Set your TP/SL.
🚨 as of ✍️ :
Support/Resistance Levels :
22979
23030
23242(23374)
23526
23997
24385
24586
24648
24945
🗝️🗝️🗝️Level: 23526-23620
HSI continues its Bullish mode.
W Chart:-
17Mar2025 -
24Mar2025 -
📰 another -ve news, but this might be distraction. 🚨
www.tradingview.com
Shares in Hong Kong slumped 487 points or 2.0% to 23,417 on Tuesday morning, reversing gains from the prior session amid concerns over U.S. recession risks and China’s deflation threat.
www.tradingview.com
** Hong Kong's benchmark Hang Seng Index declined 2.2%, and the Hang Seng Tech Index
HSTECH lost 3.5%.
For current markets condition, the CHN & HKG can be volatile with the continuing noise from tariff.
🎯 Reminder: For long term (6-18 months) continue to accumulate China & HKG for the potential upside for the year! All retracement is a good entry point.
🔎 DYODD and don't listen to anyone. Invest in yourself, do some study and learn along the way while you trying to verify or finding the answer if to start invest in CHN/HKG markets. If you don't know how or where, you may ask Deepseek/Chatgpt for most reputable Trading courses nearest to you.
Let's follow our own strategy and zen with 📙 and 🍵 for profits.
** Please Boost 🚀/LIKE 👍, FOLLOW ✅, SHARE 🙌 and COMMENT ✍ if you enjoy this idea! Share your trading journey to encourage the trading buddies.

Beginning of the Uptrend for Stock #01Beginning of the Uptrend for Stock #01: 9988 (BABA)
The price has broken out of a consolidation range that lasted approximately two years, supported by a normal volume distribution.
The stock has risen to meet the Fibonacci Extension resistance level of 161.8 at a price of 144 HKD. Currently, it is forming a sideways consolidation pattern on the smaller timeframe, establishing a base structure viewed as re-accumulation.
The 6-month target is set at the Fibonacci Extension level of 261.8, which corresponds to a price of 189 HKD. This target aligns with a price cluster based on the valuation from sensitivity analysis, using the forward EPS estimates for 2025-2026 as a key variable for calculations, along with the standard deviation of the price-to-earnings ratio.
Wait for the Right Moment to Accumulate Shares within the Consolidation Range
Purchase near the support level of the range when the price pulls back. Look for a candlestick reversal pattern as a signal to add to your position.
However, should the price break down to the lower consolidation range, the stock would lose its upward momentum, potentially leading to a prolonged period of consolidation or a deeper pullback to around 90 HKD.
Always have a plan and prioritize risk management.

HK2359 Bullish Wave 3In the second half of 2024, the stock accumulated energy and cooperated with the policy to make a beautiful rise, and then fell back to the 0.382 Fibonacci retracement line and fluctuated repeatedly. I believe the next wave of rise is coming!
I will buy intraday, the yellow line is the support level, about 51.1 (this is a relatively safe entry price), and the first target profit stop level is 72.45 (Fibonacci retracement line 1.000)
I am very optimistic about this stock. When there is a decline, I will give priority to replenishing positions at the 0.382 Fibonacci retracement line instead of leaving the market quickly

HSI charging forward, but watch that resistance!Helloy everyone,
Yesterday the Index performed quite well; bullish.
Trying to go back to the uptrend channel.
PEPPERSTONE:HK50
at point of writing ✍️:
MACD - Deadcross formed. Sell/Short at resistance level 24730-24650
BB - 23953(lower BB) mid-line:24350 (this is your 🗝️ level for your long/short TP/SL level)
Quote from 17/3/2025 post
For this week trade plan: Buy into support Sell at resistance. Set your TP/SL.
🚨 as of ✍️ :
🗝️ Level : 22979-23242(23374)- 23997- 24385 - 24586 - 24648 - 24945
To retest 24385 again.
Set your TP/SL, let the market do its thing, and ride the trend with confidence! Manage your risk/reward (r/r).
HSI continues its Bullish mode.
HSI:HSI
W Chart:-
📰 another +ve news, but this might be distraction. 🚨
www.tradingview.com
🎯 Reminder: Continue to accumulate China & HKG for the potential upside for the year! All retracement is a good entry point.
🔎 DYODD and don't listen to anyone. Invest in yourself, do some study and learn along the way while you trying to verify or finding the answer if to start invest in CHN/HKG markets. If you don't know how or where, you may ask Deepseek/Chatgpt for most reputable Trading courses nearest to you.
** Please Boost 🚀/LIKE 👍, FOLLOW ✅, SHARE 🙌 and COMMENT ✍ if you enjoy this idea! Share your trading journey to encourage the trading buddies.
While wait for the markets cook, you may zen with 📙 and 🍵because stress won’t make the candles move! 🚶
Happy Trading!

Was the break over? HSI bulls are back on the field and ready?Hello everyone, happy Monday!
Last week movement, HSI retraced consecutive 4 trading days and slight recover on Friday yet closed with loss 271pts; -1.12% for the week of 10 Mar 2025. However, YTD it has logged an increased of +4216.69pts; +21.02%. HSI:HSI
MACD - Goldencross was marked in Green (5Mar25; 14Mar25)
BB - Currently trading within upper BB channel.the Mid-line 4H chart at 23789 at point of writing ✍️.
For this week trade plan:
Buy into support Sell at resistance. Set your TP/SL.
🚨 as of ✍️ :
🗝️ Level : 22979-23242(23374)- 23997- 24385 - 24586 - 24648 - 24945
To retest 24385 again.
The Index continues its Bullish mode.
With some catalyst news to support Long call.
www.tradingview.com
🎯 Reminder: Continue to accumulate China & HKG for the potential upside for the year! All retracement is a good entry point.
🔎 DYODD and don't listen to anyone. Invest in yourself, do some study and learn along the way while you trying to verify or finding the answer if to start invest in CHN/HKG markets. If you don't know how or where, you may ask Deepseek/Chatgpt for most reputable Trading courses nearest to you.
** Please Boost 🚀/LIKE 👍, FOLLOW ✅, SHARE 🙌 and COMMENT ✍ if you enjoy this idea! Share your trading journey to encourage the trading buddies
The Index seems hits the ceiling ;trade cautiously!Hello everyone, is Friday! Last trading of the week! This week has been a challenging one.
Hope everyone stick to the trading plan.
Trade plan is the same, buy into support and sell at resistance based on your trade tf.
4H Chart PEPPERSTONE:HK50
This morning the MACD seems has reversal sign although the GoldenCross form below zero line ,at least showing the end of the bear, monitor to confirm it's not a fake reversal. 🚨
As the D chart showed the Index still out of uptrend channel again as mentioned from previous post, as long as the Index out of the upper trend channel then the pullback is inevitable for the next wave.
However longer tf, it's still bullish which created higher high for thr W Chart. HSI:HSI
it would be great if this week could close 24669(last week Hi). But unlikely, what do you think?
Happy trading everyone.
** Please Boost 🚀/LIKE 👍,FOLLOW 🔔 SHARE 🔁 and COMMENT ✍️ if you enjoy this idea! Share your trading journey toencourage the trading buddies.

What's next for HSI? Hello everyone, how was the Monday strong pullback?
my short break did not stop the participation of the index slope down ski 😂 😂 😂
Hope everyone stick to the trading plan.
Trade plan is the same, buy into suppysel at resistance based on your trade tf.
4H Chart
Today probably a reversal happens but it could still in retracement mode., trade cautiously.🚨
As the D chart showed after the Monday 477pts plunged pushed the Index out of uptrend channel again as mentioned from previous post, as long as the Index out of the upper trend channel then the pullback is inevitable for the next wave.
However longer tf, it's still bullish which created higher high for thr W Chart.
it would be great if this week could close 24669(last week Hi)
Happy trading everyone and zen with 📚 and 🍵 once your SL/TP set.
** Please Boost 🚀/LIKE 👍,FOLLOW 🔔 SHARE 🔁 and COMMENT ✍️ if you enjoy this idea! Share your trading journey toencourage the trading buddies.

Hang Seng Index Reaches Three-Year HighHang Seng Index Reaches Three-Year High
A month ago, while analysing the uptrend in the Hang Seng index (Hong Kong 50 on FXOpen), we noted that:
→ Positive sentiment was driven by the success of the DeepSeek startup, boosting Chinese tech stocks and mobile operators.
→ Price movements formed a bullish structure based on Fibonacci proportions.
→ Analysts predicted the uptrend could persist until the second half of March.
Today, the Hang Seng index (Hong Kong 50 on FXOpen) surged above the 24,500 level for the first time since February 2022. According to Reuters, investor enthusiasm for artificial intelligence continues to fuel the rally.
Technical Analysis of the Hang Seng Chart
New price data support the construction of a large-scale upward channel (marked in blue).
From a bullish perspective:
→ The median line of the blue channel has shifted from resistance to support (as indicated by arrows).
→ The price remains within the intermediate purple ascending channel.
From a bearish perspective:
→ The last two candlesticks show long upper wicks—an indication that sellers are active, possibly locking in profits.
→ The RSI indicator is forming a bearish divergence.
Given these factors, the price appears vulnerable to a pullback. However, the future trajectory will largely depend on fundamental factors, particularly the ongoing tariff tensions between China and the United States.
Trade on TradingView with FXOpen. Consider opening an account and access over 700 markets with tight spreads from 0.0 pips and low commissions from $1.50 per lot.
This article represents the opinion of the Companies operating under the FXOpen brand only. It is not to be construed as an offer, solicitation, or recommendation with respect to products and services provided by the Companies operating under the FXOpen brand, nor is it to be considered financial advice.

oh wow, seems the Index has the wheel to run!Hello everyone! Happy Friday!
News📰 : anticipate more positive news to come (of course mixed with some -ve for retracement) 🔮
Look at the HSI D Chart
- posted 28Feb2025
- posted 3Mar2025
- 7March2025 at point of writing; the index trading above the support level of 23500 (the 28Feb2025 Hi); it tried to go back to uptrend channel and staying above! (broke on 28Feb2025).
Monitor the Trading volume: finance.yahoo.com
Avg past 3 months : 77.909Bn (+19.18% for the past avg vol); this imply the fund flow is abundance, hopefully this continues! Although the vol is slightly less than the last Oct 2024.
Look at the 4H chart
PEPPERSTONE:HK50
The HSI last Dec 2021 Hi @ 24385 is being tested again today!
Now, what's next? 25147, btw now and then Next level that we are looking at to break (oh wow! we need to add in past Higher Hi):
22840-22900
23241-23275-23314- 23471 (need to break above this level to change back to uptrend movement, else probably is gonna be sideways, continue to monitor and confirm)
23952-24101
24385
24586
24747
24800
25147
🚨 as of ✍️ :
Resistance : 24385 - 24586 - 24800. Let's monitor; this level is now being tested and see if breaks and staying above.
🗝️ support level
22750 -23535 (this level being tested few times; it's now became strong support level). Don't think this can easily broke down.
MACD - Goldencross was marked in Green (5Mar25)
KDJ - Remained at Bullish green zone since 4Mar25, the CFD is now in a short bullrun cycle.
BB - Still within lower BB channel and gap up trading at upper BB channel/
the Mid-line 4H chart at 22960-975 was corrected from 23320.
Trade Plan : 23477-24385 - 24751
Buy into support & Sell at resistance
the 1H showing it's now bullrun on the 2nd half of today. Ride on the waves and locked in your profits.
🚨🚨🚨 Locked your profits and watch out for reversal for retracement!
Monitor the 1H,4H movement with confirmation using MACD & KDJ indicator.
Set your tf, have your entry and exit plan!
Pay attention to the Goldencross/DeadCross; practice makes perfect.
Let's follow our own strategy and zen with 📙 and 🍵 for profits.
Happy Trading everyone!
🎯 Start to accumulate China & HKG for the potential upside for the year! All retracement is a good entry point.
🔎 DYODD and don't listen to anyone. Invest in yourself, do some study and learn along the way while you trying to verify or finding the answer if to start invest in CHN/HKG markets.
HKEX:2800 - 22.90-22.82 if it happens to retrace back to this level, otherwise anytime NOW is entry point! It's confirmed by the 200MA (above in W chart) ; also the W chart MACD GoldenCross. Cross-check it; if need helps let us know.
HKEX:2823 - 13.17-14.75 can start to open position and start accumulate, is allowed to wait for confirmation once it breaks 14.75 level. But you will be getting at higher cost...
HKEX:2801 - open position at price : 23.73-23.80 or anytime NOW! if ever retraced back to 23.36-23.66 accumulate more.
HKEX:3067 - open position now, add position when it retraced to 11.63,,11.33 or below. If you have missed, you may tk position still good to start at 11.85,11.99,12.15
** Please Boost 🚀/LIKE 👍, FOLLOW ✅, SHARE 🙌 and COMMENT ✍ if you enjoy this idea! Share your trading journey to encourage the trading buddies

is the Trumph speech boost the Index? n is Wednesday the humpdayHello everyone! How was yesterday trade? Hope everyone stick to the strategy set the SL/TP for your day trade.
News📰 : as expected and anticipate more positive news this week 🔮
www.tradingview.com
**China shares waver, HK bounces as Beijing vows more support for consumption, AI**
HSI +1.30% at this news published.😂
Look at the HSI D Chart
- posted 28Feb2025
at point of writing; the index closed below key support level of 22900-23000 (the strong level of 23000 which is the 10MA level, the uptrend is broken 28Feb25); as mentioned this level has been retest 3 times, let's continue to monitor.
However, today the Index open Hi. So trade ⚠ cautiously. Don't chase Hi.
Trading volume: finance.yahoo.com
Date Volume
Mar 3,2025 4,338,200,000
Feb 28, 2025 6,578,300,000
Feb 27, 2025 6,257,000,000
Feb 26, 2025 5,138,100,000
Feb 25, 2025 4,449,800,000
Monthly
Mar 1 2025 - 4,338,200,000 (as of todate)
Feb 1 2025 - 93,960,700,000 (+7.53% from prev month)_correction
Jan 1 2025 - 52,385,800,000
Dec 1 2024 - 56,349,200,000
Avg past 3 months : 77.909Bn (+19.18% for the past avg vol); this imply the fund flow is abundance, hopefully this continues! Although the vol is slightly less than the last Oct 2024.
Look at the 4H chart
PEPPERSTONE:HK50
The HSI last Oct Hi @ 23241 has been broken, this level could be the resistance level for the Index to break the next level Hi. The HK50 last Oct Hi @ 23258.
Now, what's next?
As updated:-
Next level that we are looking at to break:
20985
21336-21350
22020-22535, 22840-22900
23241-23275-23314- 23471 (need to break above this level to change back to uptrend movement, else probably is gonna be sideways)
23952-24101
24385
🚨 as of ✍️ :
it stays above 22535(retest 3 times and this might formed very strong support level).
🗝️ support level :
22990 broken :22340-22750 (this level being tested 3 times 17,20Feb & 4Mar; last tested at 22535.3)
MACD - Deadcross was marked in Green, continue to curving down (4h Chart)
KDJ - Reverse to Bullish green zone on 4Mar25; the CFD continue to trading the upwards trend till now.
BB - Still within lower BB channel and gap up trading at upper BB channel/
the Mid-line 4H chart at 22960-975 was corrected from 23320.
Trade Plan: might pullback to 23020 to fill the gap. Range : 23025-23258
Buy into support : 22880-22960(confirm with indicators)
Sell at resistance : 23150, 23190, 23372/400, 23454,23512(it soared to hit ,this morning)
Monitor the 1H,4H movement with confirmation using MACD & KDJ indicator.
Set your tf, have your entry and exit plan!
Pay attention to the Goldencross/DeadCross; practice makes perfect.
Let's follow our own strategy and zen with 📙 and 🍵 for profits.
Happy Trading everyone!
🎯 Start to accumulate China & HKG for the potential upside for the year! All retracement is a good entry point.
🔎 DYODD and don't listen to anyone. Invest in yourself, do some study and learn along the way while you trying to verify or finding the answer if to start invest in CHN/HKG markets.
HKEX:2800 - 22.90-22.82 if it happens to retrace back to this level, otherwise anytime NOW is entry point! It's confirmed by the 200MA (above in W chart) ; also the W chart MACD GoldenCross. Cross-check it; if need helps let us know.
HKEX:2823 - 13.17-14.75 can start to open position and start accumulate, is allowed to wait for confirmation once it breaks 14.75 level. But you will be getting at higher cost...
HKEX:2801 - open position at price : 23.73-23.80 or anytime NOW! if ever retraced back to 23.36-23.66 accumulate more.
HKEX:3067 - open position now, add position when it retraced to 11.63,,11.33 or below. If you have missed, you may tk position still good to start at 11.85,11.99,12.15
** Please Boost 🚀/LIKE 👍, FOLLOW ✅, SHARE 🙌 and COMMENT ✍ if you enjoy this idea or need help! *

Looks like HSI got a morning energy boost is not a Weakday!3/3/2025
Hello everyone! Happy Monday today is not a Weakday but a wonderful weekday start of the week 🫰 🫶
News📰 : this was from 28Feb2025
www.tradingview.com
N this is this morning 3Mar2025 - what do you think? I suspect more good news will come this week. 🔎🔮
www.tradingview.com
Look at the HSI D Chart
- posted 25Feb2025
- posted 26Feb2025
- posted 27Feb2025
- posted 28Feb2025
at point of ✍️; the index closed near the key support level of 22900-23000 (the strong level of 23000 which is the 10MA level); as mentioned this level has been retest 3 times, let's continue to monitor.
Trading volume: finance.yahoo.com
Date Volume
Feb 28, 2025 6,578,300,000
Feb 27, 2025 6,257,000,000
Feb 26, 2025 5,138,100,000
Feb 25, 2025 4,449,800,000
Feb 24, 2025 5,264,600,000
Monthly
Mar 1 2025 - 93,960,700,000 (+7.53% from prev month)
Feb 1 2025 - 87,382,400,000
Jan 1 2025 - 52,385,800,000
Dec 1 2024 - 56,349,200,000
Avg past 3 months : 77.909Bn (+19.18% for the past avg vol); this imply the fund flow is abundance, hopefully this continues! Although the vol is slightl less than the last Oct 2024.
Look at the 4H chart
PEPPERSTONE:HK50
The last Oct Hi @ 23241 has been broken, this level could be the resistance level for the Index to stay above for the next level.
Now, what's next?
As updated:-
Next level that we are looking at to break:23330, 23525, 23990, 24101, 24385.
🚨 as of ✍️ :it seems it stay above the key support level of 22990.
🗝️ support level : 23500 (broken) , 23175 (broken), 22990 (testing), 22741
MACD - last marked WAS deadcross and curving down as marked in YELLOW. After 8 bars-it reversed as marked in GREEN. and NOW it formed Deadcross again (as marked in YELLOW)
KDJ - Remained in bearish red zone with chance that it could reverse upwards.
BB - Still within lower BB channel and testing to break the BB mid-line for 4H chart at 23330.
Today Trade Plan: 22785-23504
Buy into support : 22900 ,23,005, 23169,23283 (confirm with the indicator if it's on the bullish zone)
Sell at resistance : 23400, 23353, 23335 (short/TP with shorter timeframe bearish zone, cross-check and wait for confirmation.)
Monitor the 1H,4H movement with confirmation using MACD & KDJ indicator.
Set your tf, have your entry and exit plan!
Pay attention to the Goldencross/DeadCross; practice makes perfect.
Let's follow our own strategy and zen with 📙 and 🍵.
Happy Trading everyone!
🎯 Start to accumulate China & HKG for the potential upside for the year! All retracement is a good entry point.
🔎 DYODD and don't listen to anyone. Invest in yourself, do some study and learn along the way while you trying to verify or finding the answer if to start invest in CHN/HKG markets.
HKEX:2800 - 22.90-22.82 if it happens to retrace back to this level, otherwise anytime NOW is entry point! It's confirmed by the 200MA (above in W chart) ; also the W chart MACD GoldenCross. Cross-check it; if need helps let us know.
HKEX:2823 - 13.17-14.75 can start to open position and start accumulate, is allowed to wait for confirmation once it breaks 14.75 level. But you will be getting at higher cost...
HKEX:2801 - open position at price : 23.73-23.80 or anytime NOW! if ever retraced back to 23.36-23.66 accumulate more.
HKEX:3067 - open position now, add position when it retraced to 11.63,,11.33 or below. If you have missed, you may tk position still good to start at 11.85,11.99,12.15
** Please Boost 🚀/LIKE 👍, FOLLOW ✅, SHARE 🙌 and COMMENT ✍ if you enjoy this idea or need help! *

HSI clocked out early, TP sit back and relax wait for next move!
Hello everyone! Today one of the web hot topic - all the 7 stars align and there must be something happen!
What do you think?
"Bulls took profits, bears took chances—HSI took a nap before the next round!" 😴📈📉
Here you go...now come with this news 📰
www.tradingview.com
**Shares in Hong Kong plunged 309 points or 1.3% to 23,415 on the last trading day of February, marking a second session of losses.
The Hang Seng fell further from its highest in over three years, set earlier in the week, and was on track for its first weekly drop in seven weeks, with all sectors posting sharp losses.
Still, markets were on course for solid monthly gains, up around 15% so far, marking a third month of rises as hopes mounted that China’s 2025 Two Sessions meeting next week will outline key policy priorities, including potential support measures for the economy.**
Look at the HSI D Chart
- posted 25Feb2025
- posted 26Feb2025
- posted 27Feb2025
- posted 28Feb2025 at point of writing; the index broke the key support level of 22900-23000 (the strong level of 23000 which is the 10MA level; let's monitor closely next week the new start for the month and see this level can be maintained. (this level has been retest 3 times)
Trading volume: finance.yahoo.com
Date Volume
Feb 27, 2025 6,257,000,000
Feb 26, 2025 5,138,100,000
Feb 25, 2025 4,449,800,000
Feb 24, 2025 5,264,600,000
Monthly
Feb 1 2025 - 87,382,400,000
Jan 1 2025 - 52,385,800,000
Dec 1 2024 - 56,349,200,000
Avg past 3 months : 65.3Bn ; current as of todate / month volume > past 3 mnths avg (i.e 57.98bn)
Look at the 4H chart (main chart)
PEPPERSTONE:HK50
The last Oct Hi @ 23241 has been broken hence retracement is not a surprised!
With the month closing today, the strong pullback is inevitable for institute and whale to take profit.
Please trade cautiously today! 🚨 🚨 🚨
Now, what's next?
As updated:-
Next level that we are looking at to break and steadily staying above this level - 23525, 23990, 24101, 24385
🚨 as of ✍️ it seems break the first support level this morning- and let's see if it could rebound today else it will go down ⬇ 👇 to 23175-22990 level, then 22741.
🗝️ support level : 23500 (broken) , 23175 (broken), 22990 (testing), 22741
MACD - last marked WAS deadcross and curving down as marked in YELLOW. After 8 bars-it reversed as marked in GREEN. and NOW it formed Deadcross again (as marked in YELLOW)
KDJ - Now reversed turned into bearish red zone. It remained in bearish zone.
BB - It is now entered lower BB channel and testing to break the lower BB and create new Lo.
Today Trade Plan: 23000-23504
Buy into support : 22795- 22900 (confirm with the indicator if its on reversal mode otherwise stayaway)
Sell at resistance : 24040,23454,23250 (short and TP within shorter timeframe, cross-check and wait for confirmation)
Monitor the 1H,4H movement with confirmation using MACD & KDJ indicator.
Set your tf, have your entry and exit plan!
Pay attention to the Goldencross/DeadCross; practice makes perfect.
Let's follow our own strategy and zen with 📙 and 🍵.
Happy Trading everyone!
🎯 Start to accumulate China & HKG for the potential upside for the year! All retracement is a good entry point.
🔎 DYODD and don't listen to anyone. Invest in yourself, do some study and learn along the way while you trying to verify or finding the answer if to start invest in CHN/HKG markets.
HKEX:2800 - 22.90-22.82 if it happens to retrace back to this level, otherwise anytime NOW is entry point! It's confirmed by the 200MA (above in W chart) ; also the W chart MACD GoldenCross. Cross-check it; if need helps let us know.
HKEX:2823 - 13.17-14.75 can start to open position and start accumulate, is allowed to wait for confirmation once it breaks 14.75 level. But you will be getting at higher cost...
HKEX:2801 - open position at price : 23.73-23.80 or anytime NOW! if ever retraced back to 23.36-23.66 accumulate more.
HKEX:3067
** Please Boost 🚀/LIKE 👍, FOLLOW ✅, SHARE 🙌 and COMMENT ✍ if you enjoy this idea or need help! *

Not every run is a marathon— it needs pit stop! Hello everyone!
Here you go...now come with this news 📰
Market Chatter: China Plans 400-Billion-Yuan Capital Injection for Banks -- 💰💰💰?
www.tradingview.com
Look at the HSI D Chart
- posted 25Feb2025
- posted 26Feb2025
- posted 27Feb2025 at point of writing; the index seems doing quite well since open this morning,
trying to stay above the support level 💣💣💣23500 (and strong level of 23000 which is the 10MA level, if break below this level the Index bullrun end, but it's unlikely as it has been retest 3 times)
Trading volume: finance.yahoo.com
Date Volume
Feb 27, 2025
Feb 26, 2025 5,138,100,000
Feb 25, 2025 4,449,800,000
Feb 24, 2025 5,264,600,000
Monthly
Feb 1 2025 - 81,125,400,000
Jan 1 2025 - 52,385,800,000
Dec 1 2024 - 56,349,200,000
Avg past 3 months : 63.28Bn ; current month Feb volume > 3 mnths avg
Look at the 4H chart
PEPPERSTONE:HK50
The last Oct Hi @ 23241 has been broken hence retracement is not a surprised!
Now, what's next? This is tough question 🙋 - Next level that we are looking at to break and steadily staying above this level - 23525, 23990, 24101, 24385
🚨if it breaks below 23454-23500 (& not rebound) it could go down ⬇ 👇 to 23250-23175
🗝️ support level : 23500, 23175, 22741 t
MACD - last marked WAS deadcross and curving down as marked in YELLOW. After 8 bars-it reversed as marked in GREEN.
KDJ - Now reversed turned into bearish red zone.
BB - continue moving above the mid line of BB, this morning touches the mid-line; so be cautious 🚨🚨🚨
Today Trade Plan: 23454-24050
Buy into support : 23454 -23550 (TP :23600-23775)
Sell at resistance : 23800-24050 (TP : 23525-23454)
Monitor the 1H,4H movement with confirmation using MACD & KDJ indicator.
Set your tf, have your entry and exit plan!
Pay attention to the Goldencross/DeadCross; practice makes perfect.
Let's follow our own strategy and zen with 📙 and 🍵.
Happy Trading everyone!
🎯: start to accumulate China & HKG for the potential upside for the year! All retracement is a good entry point.
🔎 DYODD and don't listen to anyone. Invest in yourself, do some study and learn along the way while you trying to verify or finding the answer if to start invest in CHN/HKG markets.
HKEX:2800 - 22.90-22.82 if it happens to retrace back to this level, otherwise anytime NOW is entry point! It's confirmed by the 200MA (above in W chart) ; also the W chart MACD GoldenCross. Cross-check it; if need helps let us know.
HKEX:2823 - 13.17-14.75 can start to open position and start accumulate, is allowed to wait for confirmation once it breaks 14.75 level. But you will be getting at higher cost...
HKEX:2801 - open position at price : 23.73-23.80 or anytime NOW! if ever retraced back to 23.36-23.66 accumulate more.
HKEX:3067
** Please Boost 🚀/LIKE 👍, FOLLOW ✅, SHARE 🙌 and COMMENT ✍ if you enjoy this idea or need help! *

Rebound lik a champ, monitor the vol c if the guests left early?Hello everyone! How was your zentradingstrategy? Hope everyone embrace with the retracement.
Sell on news? or Buy the dip?
What did we noticed on yesterday news? pfft..Distraction, distraction...
but here you go for today 😂😂😂: www.tradingview.com
**Shares in Hong Kong surged 520 points or 2.3% to 23,555 on Wednesday, shifting from a weak session the day before amid robust gains across all sectors.**
Look at the HSI D Chart
- posted 25Feb2025
- 26Feb2025 at point of writing; the index seems doing quite well since open this morning, trying to stay above the support level 22990.
Yesterday trading volume: finance.yahoo.com
Date Volume
Feb 26, 2025
Feb 25, 2025 4,449,800,000
Feb 24, 2025 5,264,600,000
Look at the 4H chart
PEPPERSTONE:HK50
The last Oct Hi @ 23241 has been broken hence retracement is not a surprised!
MACD - last marked WAS deadcross and curving down as marked in YELLOW. After 8 bars-it reversed as marked in GREEN.
KDJ - WAS at bearish zone curving down; and now reversed and turned bullish in green zone.
BB - now moving above the mid line of BB from yesterday ranging within the mid-line.
22990 resistance level now reversed as SUPPORT level. Hopefully the retracement is completed. Let's monitor especially the volume see if this is just a rehearsal.
Today Trade Plan: 23150-23670 (ahemmm...trust you can do the math 😂)
Buy into support : 23150 -23175 (TP :23600-23630)
Sell at resistance : 23465-23670 (TP : 23450-23500)
Monitor the 1H,4H movement with confirmation using MACD & KDJ indicator.
Set your tf, have your entry and exit plan!
Pay attention to the Goldencross/DeadCross; practice makes perfect.
Let's follow our own strategy and zen with 📙 and 🍵.
Happy Trading everyone!
Reminder : start to accumulate China & HKG for the potential upside for the year! All retracement is a good entry point.
HKEX:2800 - 22.90-22.82 if it happens to retrace back to this level, otherwise anytime NOW is entry point! It's confirmed by the 200MA (above in W chart) ; also the W chart MACD GoldenCross. Cross-check it; if need helps let us know.
HKEX:2823 - 13.17-14.75 can start to open position and start accumulate, is allowed to wait for confirmation once it breaks 14.75 level. But you will be getting at higher cost...
HKEX:2801 HKEX:3067
** Please Boost 🚀/LIKE 👍, FOLLOW ✅, SHARE 🙌 and COMMENT ✍ if you enjoy this idea or need help! 😍 **

A little dip? Just the market testing if the game still on!Hello everyone!
Sell on news?
www.tradingview.com
**Hong Kong stocks fell 315 points or 1.4% to 23,030 in Tuesday morning trade, marking the second session of sharp losses amid broad sector falls, notably consumers and tech.Traders retreated from riskier assets after the US intensified curbs on Chinese investments and proceeded with tariffs on Canada and Mexico.**
Is this piece of sh *** news helps in trading? 🤐 🤐 🤐
#sticktoyourplan
#trustwhatyoutrust
#followyourowntradingplan
Build your own #zentradingstrategy news can be distraction to your judgements!
Look at the HSI D Chart
Look at the 4H chart
PEPPERSTONE:HK50
The last Oct Hi @ 23241 has been broken hence retracement is not a surprised!
MACD - formed deadcross and curving down as marked in yellow circle.
KDJ - at bearish zone curving down.
BB - it broke down uptrende channel trading in lower BB channel
22990 support level turned resistance level now. If it able to break and stay above this level this week then this is a healthy pull back. Let's monitor.
Today Trade Plan: 22500-23250 (~830pts)
Buy into support : 22600 -22900 (TP :22950-23130)
Sell at resistance : 23000-23100 (TP: 22900-22930)
PEPPERSTONE:HK50
1h Chart
Check MACD & KDJ - wait for the reversal confirmation before taking your swing long position.
Monitor the 1H,4H movement with confirmation using MACD & KDJ indicator.
Set your tf, have your entry and exit plan!
Pay attention to the Goldencross/DeadCross; practice makes perfect.
Let's follow our own strategy and zen with 📙 and 🍵.
Happy Trading everyone!
Reminder : start to accumulate China & HKG for the potential upside for the year! All retracement is a good entry point.
HKEX:2800 - 22.90-22.82 add position
HKEX:2823 HKEX:2801 HKEX:3067
** Please Boost 🚀/LIKE 👍, FOLLOW ✅, SHARE 🙌 and COMMENT ✍ if you enjoy this idea!**

HSI took off like a rocket...confirmed bullish24/02/2025
HSI took off like a rocket… then remembered it forgot its wallet and came back for a quick retrace!" 🚀📉
Next target : 24385
HSI 1W Chart
Look at that! ignore the news, the movement and volume
finance.yahoo.com
Goldencross for the week of 3Feb2025 - with trading volume jumped from 3.69bn to 15.12bn.
And the subsequent week volume keeping at >20bn level (for the week of 10Feb & 17Feb)
Let's monitor if this week keeping the same level of volume for the 3rd week.
finance.yahoo.com
we noticed the trading volume increased from 4.42Bn to 6.1673bn last Friday 21Feb25
www.tradingview.com
** The Hang Seng Composite Index on information technology firms and the Hang Seng Tech Index slip 0.5% and 0.1% respectively, while Hang Seng Index adds 0.4%
** Stock up 76.9% YTD
HSI:HSI
The last Oct Hi @ 23241 has been broken today!
MACD, KDJ and BB remained at bullish zone.
Key support level: 22990,22668,22446
Key resistance level : 23675,24167,24385
Look at the 1h chart - posted
PEPPERSTONE:HK50
Today Trade Plan:
Buy into support : 23300-23500
Sell at resistance : 23650-23700 (TP:23630)
Monitor the 1H,4H movement with confirmation using MACD & KDJ indicator.
Set your tf, have your entry and exit plan!
Pay attention to the Goldencross/DeadCross; practice makes perfect.
Let's follow our own strategy and zen with 📙 and 🍵.
Happy Trading everyone!
Reminder : start to accumulate China & HKG for the potential upside for the year! Today retracement is a good entry point.
HKEX:2800 HKEX:2823 HKEX:2801 HKEX:3067
** Please Boost 🚀/LIKE 👍, FOLLOW ✅, SHARE 🙌 and COMMENT ✍ if you enjoy this idea!**
