Bears. Wait some more.Very uncharacteristic of a mark down so far. Take profit, close half the position or move your SL to 24850 and let the market play itself out. If there is one more up move to go, it should be quick, ending with a buying climax.
Hang Seng HSI


HSI/HK50: 25% correction & best level to RELOAD/BULLS(NEW)Why get subbed to to me on Tradingview?
-TOP author on TradingView
-15+ years experience in markets
-Professional chart break downs
-Supply/Demand Zones
-TD9 counts / combo review
-Key S/R levels
-No junk on my charts
-Frequent updates
-Covering FX/crypto/US stocks
-24/7 uptime so constant updates
HSI/HK50: 25% correction & best level to RELOAD/BULLS(NEW)
IMPORTANT NOTE: speculative setup. do your own
due dill. use STOP LOSS. don't overleverage.
🔸 Summary and potential trade setup
::: HSI/HK50 weekly chart review
::: massive H*S setup in progress
::: 25% correction up next
::: runaway BEAR gap previously
::: signals more downside mid-term
::: PT is 19 000 within 4-10 weeks now
::: weak chart and no upside until S/R
::: right now you can only SHORT IT
::: correction can last 4-10 weeks
::: 19 000 best reload BULLS later after corr
::: good luck traders
🔸 Supply/Demand Zones
::: N/A
::: N/A
🔸 Other noteworthy technicals/fundies
::: TD9/Combo update: N/A
::: Sentiment: BEARS
::: Sentiment outlook short-term: BEARISH

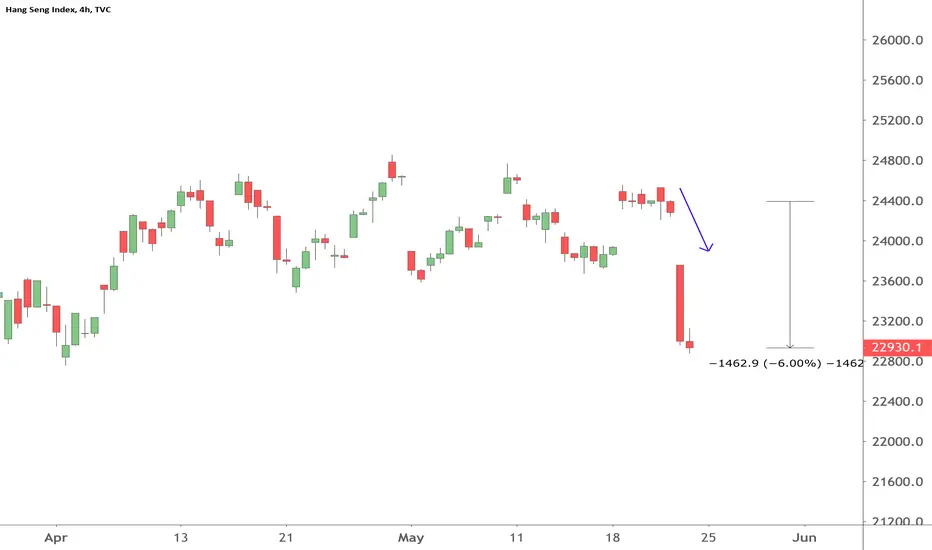
HSI UpdateTop did come albeit 2 days late, important or not, we will know in next few days. Ideally, i would like to hv seen more distribution between 25k-26k but as pointed out in previous posts, there was high volume selling in the last move up from 22400 so it was bound to run out of gas real soon.
Pullbacks should be capped below 24500. Definitely dont want to see 24800 tested anytime soon. 22900-22400 will be key and if the markdown has started, this area needs to be quickly overcome perhaps with an acceleration gap.
I am not of a view that it is the start of deflationary crash as many expect and fear. NOT YET at least. Refer to my 23 May post, "Markdown or Shakeout?" linked below.
Quickly down to 20k and back to 25k-26k :D. One can dream.

HSI - A upward breakoutHang seng index has a bullish trend and real breakout of the range 22750-24850. HSI may test the supporting level 24800 at this moment and continue a upward trend.

Top in place.Fed midweek so gotta give it some room. Expect it to accelerate below 24k.
For detailed thoughts on this short, kindly refer to previous posts.
Regards

Hang Seng Index Long Set UpBased on market structure and momentum, HSI will head north for quite a time.

Important TOP just ahead.
Didn't get the pullback before run for new highs as anticipated in the last analysis but on the flip side it means very little left to distribute. A pullback would have meant more to distribute above but now it looks like a quick up and back down.
We have 7 weeks of distribution mainly between 23750 - 24250(See previous posts)
Without volume, the last few days may seem like a start of a strong uptrend but zoom in and it appears very much like a SL hunt. Trends can't start without first accumulation/distribution and i see very little accumulation below for it to keep going for long.
Initial plan was to go short at 25300-500 but not sure if we will get there so i will look for reversal signs as soon as it gets above 24800. Target 20500 - 20000.
Some news will follow real soon as always but markets only move when those who control them are ready to move.

Hang Seng outlookPrice continues higher, soon should be approaching resistance zone and 50% fib level as economies around the world are opening and demand returns.
Once that level breaks, we can buy and target the 61.8% level below 26000.
Intraday early entries possible on smaller time frames.
Please support the idea and share your thoughts on HSI!
Good Luck and Stay Healthy!

Hengan Intl Group Ltd (1044 - HK) - ABC wave patternHengan Intl Group Ltd (1044 - HK) is in ABC zigzag down movement, which is actually the part of (B) down sequence after (A) wave leading diagonal. It is now in 3rd wave down of C wave of (B), which is invalidate if it crosses the invalidation level. In weekly time frame it is choppy.

Tencent Holdings Ltd (700 - HK) - ABC wave patternTencent Holdings Ltd (700 - HK) is in ABC zigzag wave pattern and moving up in C wave up. It is in 1st wave of C, which is about to end soon and 2nd will correct it down. Watch the invalidation level closely. In weekly time frame it is a very strong stock of HSI and in the 3rd wave of 5th wave impulse, which is further subdividing as extended wave.

Strong Head WindsWe did gap up and didn't fill, trapping the late sellers but high volume selling in this up move. Unlikely that accumulation below was enough to carry it to new HIGHS in one go.
It can come crashing down at any moment but if it can get to 25300-500, that will be a very good short opportunity.
Regards

HSI follows the predicted trend + new possibility of gains aheadAs predicted in our April 6 post, HSI reached minute wave i and as minute wave ii has completed, new possibility of gains are available at minute wave iii with the most probable first target at 28,284. If the index crosses below 22,500, this analysis should be reviewed. FOLLOW SKYLINEPRO TO GET UPDATES.

$BIDU: Trumps First Target to DeslistThe rally at the end of this Friday's close was systemic. It was the news that the U.S. president (after the markets were already in anticipation as he had tweeted there would be significant news). The press conference was not positive. The things that came out of it was both anticipated and expected, which is what the markets are operating on right now. They anticipated that the U.S. would begin to win back exceptions from Hong Kong as a semi-autonomous trading partner because of Chinas move to consolidate power under grounds of national security. There was also mention of delisting Chinese companies on the American stock exchanges, which would be huge for companies such as $BIDU.

Interesting Monday ahead
All set for a very interesting Monday's opening.
Channel support held on for whole week while the sellers kept up the pressure and are now just above the accumulation zone. Gap up will trap the sellers and may not fill in near term with price quickly marching towards 25k. Gap down will open the door towards first the gap at 21882 and then towards march low at 20968.
If Monday opens near the current prices then watch out for trap(First move usually being a trap)
Volume was high whenever price came back in the accumulation zone which is often the case prior to a significant move.
Short term = Neutral,
Medium Term = Bullish,
Long Term = Bearish.

HSI to extend downside for Fibonacci targetSimple chart, simple Fibonacci, simple target to the downside for the Fibonacci target.
MACD is support of the downdraft.
Apparently Trump is going to have a release on US actions, and surely will be returned with China’s response.
Trigger for downside there...

Which is The Hang Seng 50 Going? (HSI) WAVE 5 Down!!!
Hang Seng China 50 Index is a pan-China stock market index to represent the top 50 China-based companies in the stock exchanges of Hong Kong, Shanghai and Shenzhen, which covers A share (shares circulated in mainland China), H share (shares circulated in Hong Kong from the mainland China incorporated company), Red Chip (shares circulated in Hong Kong from the companies incorporated outside mainland China with state-owned background) and P Chip (shares circulated in Hong Kong from the companies with private background)

Markdown or shakeout?
Markets are controlled by very few. They manipulate as they please. They own everything. banks, hedge funds, media, governments. They are the culprits behind social unrest, Wars, Pandemics. No new law is passed without their approval. They have mastered the art of deceiving the masses and they are looking to further enslave the common. Big changes are on the way for which they will create global chaos the likes never seen before by mankind. Many things will be blamed as reasons. Do what they may but a Supreme power watches. Tyrants days are numbered.

Hang Seng OversoldLooks to me like this is going to be the determining factor for Tuesday open....
Hang Seng is oversold, I would expect it to bounce off support Sunday and Monday, which would mean a gap up Tuesday morning.
Of course, the virus thing is unpredictable and if China shuts everything down again we could see a double bottom. Not to mention they're trying to clamp down on Hong Kong which usually tanks the Hang Seng (it's the Hong Kong index after all), so there is the possibility that it goes severely oversold.

Trade Ideas Position: USDCAD BatBullish Bat at HOP level, yes you hear me right, a valid setup for this trend trading opportunity. A really nice checkback on the setup, trade engaged.

Trade Ideas Position : USDCAD BatA bullish bat pattern spotted by the HPC, right now all I need to do is to be patient and wait for the check back on the blue arrow to engage the trade on this ranging market.

Hang Seng Index - HSI - 7 to 10% of growth in next 15 daysHSI has recently finished primary wave 2 down and its now tracing the beginning phase of a long primary wave 3 up. The current wave countindicates we are in a minute wave 3 up that should most probably elevate prices up to 1 to 1.618 of wave 1. This means 7 to 10% in the next 15 days. FOLLOW SKYLINEPRO TO GET UPDATES.
