HSI approaching support, potential for a bounce!HSI is approaching its 1st support at 26692.3 where it could potentially bounce to its resistance at 1st resistance at 30293.5.
Disclaimer:
Trading CFDs on margin carries high risk.
Losses can exceed the initial investment so please ensure you fully understand the risks.
Hang Seng HSI

HSI approaching support, potential for a bounce!HSI is approaching its 1st support at 26692.3 where it could potentially bounce to its resistance at 1st resistance at 30293.5.
Disclaimer:
Trading CFDs on margin carries high risk.
Losses can exceed the initial investment so please ensure you fully
understand the risks.

HSI bounced from support, potential for a further rise!HSI bounced off its support at 26692.3 where it could potentially rise further to its 30293.5.
Disclaimer:
Trading CFDs on margin carries high risk.
Losses can exceed the initial investment so please ensure you fully
understand the risks.

HSI bounced from support, potential for a further rise!HSI bounced off its support at 26692.3 where it could potentially rise further to its 30293.5.
Trading CFDs on margin carries high risk.
Losses can exceed the initial investment so please ensure you fully
understand the risks.

HSI bounced from support, potential for a further rise!HSI bounced off its support at 26692.3 where it could potentially rise further to its 30293.5.

HSI Approaching Support, Prepare For A Bounce
HSI is bouncing off its 1st support(100% Fibonacci extension , 61.8% Fibonacci retracement , horizontal pullback support) where it could potentially bounce to its resistance at (61.8% Fibonacci retracement , horizontal swing high resistance).
ichimoku cloud is also showing support where a corresponding bounce could occur.

HSI Approaching Support, Prepare For A BounceHSI is bouncing off its 1st support(100% Fibonacci extension , 61.8% Fibonacci retracement , horizontal pullback support) where it could potentially bounce to its resistance at (61.8% Fibonacci retracement , horizontal swing high resistance).
ichimoku cloud is also showing support where a corresponding bounce could occur.

LONG HSI Approaching Support, Prepare For A Bounce
HSI is approaching its 1st support(100% Fibonacci extension , 61.8% Fibonacci retracement , horizontal pullback support) where it could potentially bounce to its resistance at (61.8% Fibonacci retracement , horizontal swing high resistance).
ichimoku cloud is also showing support where a corresponding bounce could occur.

HSI Approaching Support, Prepare For A Bounce
HSI is approaching its 1st support(100% Fibonacci extension , 61.8% Fibonacci retracement , horizontal pullback support) where it could potentially bounce to its resistance at (61.8% Fibonacci retracement , horizontal swing high resistance).
ichimoku cloud is also showing support where a corresponding bounce could occur.

ALIBABA Bullish 5-0 harmonic pattern analysis Aim for reversal at green boxes.
Time segmented volume Indicator was used.

HSI, Hang Seng Index: Continuous downward-> SellD1:
- Tendency: Downward
- Below support W1
- Weakening
-> Waiting pullack, test resistance W1
=> Given signal on D1: Sell

LONG HSI is approaching its support at 27240.6
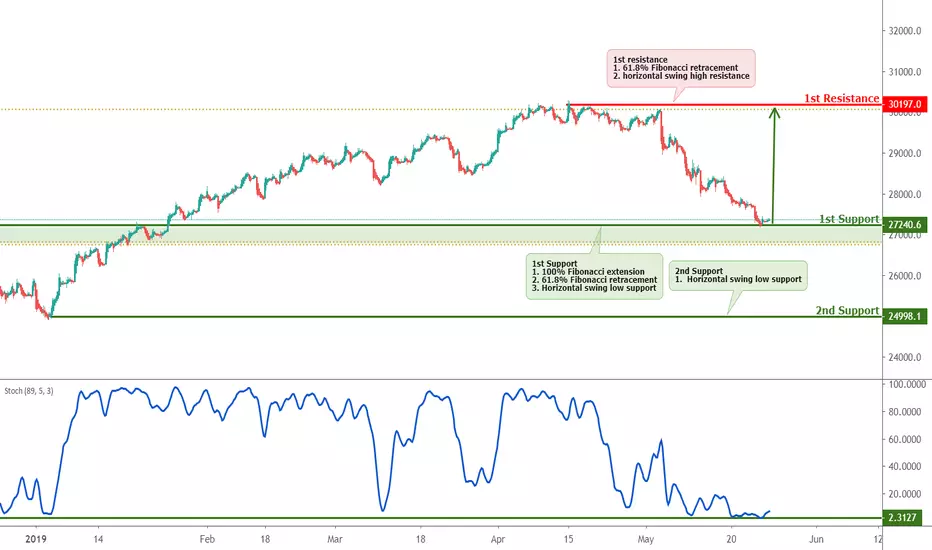
HSI is approaching its support at 27240.6 (100% Fibonacci extension , 61.8% Fibonacci retracement , horizontal pullback support) where it could potentially bounce to its resistance at 30197.0(61.8% Fibonacci retracement , horizontal swing high resistance).
Stochastic (89, 5, 3) is approaching its support where a corresponding bounce could occur.


Tencent Dropping In The Next Few DaysTencent would be dropping in the next few days to the nearest support
Resistance:
1st Resistance: $380
Supports:
1st Support: $300
2nd Support $290

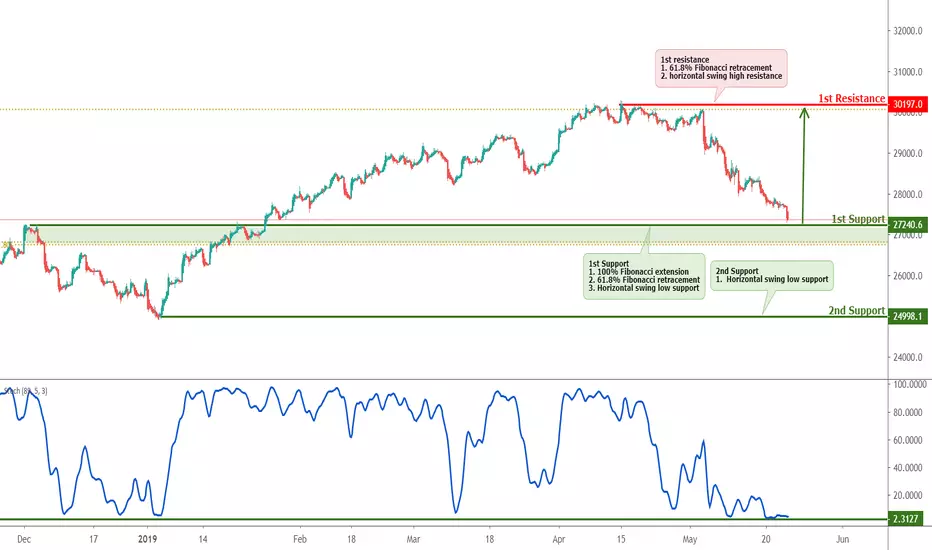
HSI is approaching its support at 27240.6 (100% Fibonacci extensHSI is approaching its support at 27240.6 (100% Fibonacci extension , 61.8% Fibonacci retracement , horizontal pullback support) where it could potentially bounce to its resistance at 30197.0(61.8% Fibonacci retracement , horizontal swing high resistance).
Stochastic (89, 5, 3) is approaching its support where a corresponding bounce could occur.
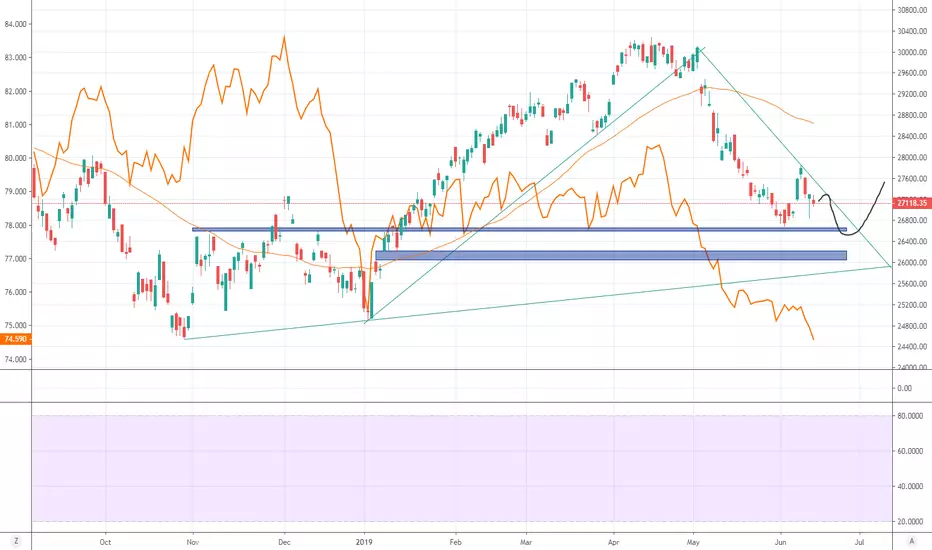
HSI Approaching Support, Prepare For A Bounce
HSI is approaching its support at 27240.6 (100% Fibonacci extension , 61.8% Fibonacci retracement , horizontal pullback support) where it could potentially bounce to its resistance at 30197.0(61.8% Fibonacci retracement , horizontal swing high resistance).
Stochastic (89, 5, 3) is approaching its support where a corresponding bounce could occur.
HSI Approaching Support, Prepare For A Bounce
Buy above. Stop loss at. Take profit at.
Reason for the trading strategy (technically):
HSI is approaching its support at 27240.6 (100% Fibonacci extension, 61.8% Fibonacci retracement, horizontal pullback support) where it could potentially bounce to its resistance at 30197.0(61.8% Fibonacci retracement, horizontal swing high resistance).
Stochastic (89, 5, 3) is approaching its support where a corresponding bounce could occur.

Hang Seng bearishEnded last week with a daily that bearishly engulfed the prior 3 days and it's rally back towards its all time high stopped right around the .618. I'd have to call that a dead cat. Also a hanging man at the top where the rally ended along with an island. Currently losing this fib level as we speak. looks bad.


China A50 trend analysis Assumption : completion of C wave, range bound market.
Indicators used: time segmented volume, 20/50/200 EMA, DMA

Hang Seng HSI perfect bearish Butterfly161% reached perfectly and failed ...
Target is 50% retracement and then 100%
