HSI approaching resistance, potential drop! HSI is approaching our first resistance at 27358.5 (100%, 61.8% fibonacci extension, 38.2% fibonacci retracement, horizontal swing high resistance) where a strong drop might occur below this level pushing price down to our major support at 26079.8 (horizontal pullback support, 50% fibonacci retracement).
Stochastic (89,5,3) is also approaching resistance where we might see a corresonding drop in price.
Hang Seng HSI

HSI approaching resistance, potential drop! HSI is approaching our first resistance at 26587 (61.8% fibonacci extension, 76.4% fibonaccci retracement, horizontal swing high resistance) and a strong drop might occur below this level pushing price down to our major support at 25541 (61.8% fibonacci retracement, 61.8% fibonacci extensison).
Stochastic (89,5,3) is also approaching resistance and we might see a corresponding drop in price should it react off this level.
Trading CFDs on margin carries high risk.
Losses can exceed the initial investment so please ensure you fully understand the risks


HSI approaching support, potential bounce! HSI is approaching our first support at 25147 (76.4% fibonacci retracement, 61.8% fibonacci extension, horizontal swing low support) and a strong bounce might occur above this level pushing price up to our major resistance at 26176 (horizontal swing high resistance , 61.8% fibonacci retracement).
Stochastic (89,5,3) is also approaching support and we might see a corresponding bounce in price should it react off this level.
Trading CFDs on margin carries high risk.
Losses can exceed the initial investment so please ensure you fully understand the risks

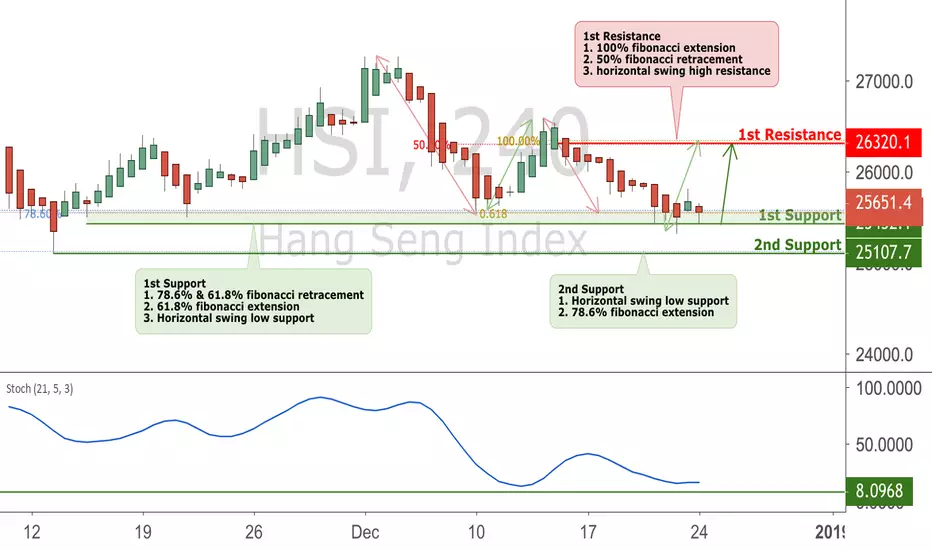
HSI Bounced Off Support, Potential For A Further Rise!Hang Seng Index bounced off our first support at 25432 (horizontal swing low support, 61.8% Fibonacci extension , 78.6%, 61.8% fibonacci retracement , horizontal swing low support) where a further rise could occur above this level pushing price up to our major resistance at 26320 (100% fibonacci extension , 50% fibonacci retracement, horizontal swing high resistance). Stochastic (21,5,3) is bounced off its support and we might see a further rise in price above this level.

HSI Testing Support, Potential Bounce!Hang Seng Index is testing our first support at 25432 (horizontal swing low support, 61.8% Fibonacci extension , 78.6%, 61.8% fibonacci retracement , horizontal swing low support) where a strong bounce might occur above this level pushing price up to our major resistance at 26320 (100% fibonacci extension , 50% fibonacci retracement , horizontal swing high resistance). Stochastic (21,5,3) is approaching support and we might see a corresponding bounce in price above this level.
HSI approaching support, potential bounce! HSI is approaching our first support at 25562 (78.6%, 61.8% fibonacci retracement, 61.8% fibonacci extension, horizontal swing low support) where a strong bounce might occur above this level pushing price up to our major resistance at 26619 (61.8% fibonacci retracement, 61.8% fibonacci extension, horizontal swing high resistance).
Stochastic (89,5,3) is approaching support and we might see a corresponding rise in price should it bounce off this level.
Trading CFDs on margin carries high risk.
Losses can exceed the initial investment so please ensure you fully understand the risks.

HSI continued 0.618 rejection + pinbar1. Still bearish momentum as shown in RSI
2. Pin Bar formed
3. Rejection from 0.618 levels
4. Price action bearish as price could not be maintained above structure.

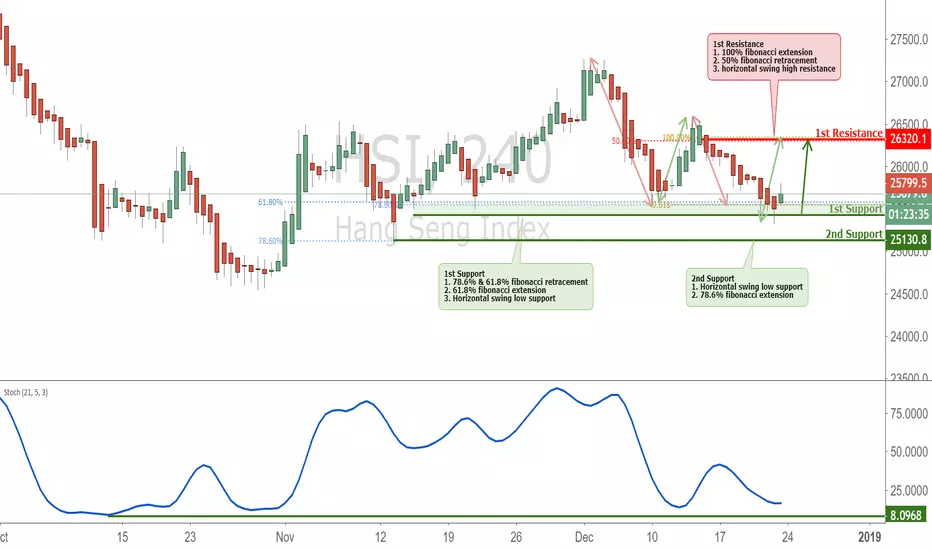
HSI approaching support, potential bounce!Hang Seng Index is approaching our first support at 25432 (horizontal swing low support, 61.8% Fibonacci extension , 78.6%, 61.8% fibonacci retracement, horizontal swing low support) where a strong bounce might occur above this level pushing price up to our major resistance at 26327 (100% fibonacci extension , 50% fibonacci retracement, horizontal swing high resistance). Stochastic (21,5,3) is approaching support and we might see a corresponding bounce in price above this level.
Trading CFDs on margin carries high risk.
Losses can exceed the initial investment so please ensure you fully understand the risks.

HSI approaching support, potential bounce! HSI is approaching our first support at 25562 (78.6%, 61.8% fibonacci retracement, 61.8% fibonacci extension, horizontal swing low support) and a strong bounce might occur above this level pushing price up to our major resistance at 26619 (61.8% fibonacci retracement, 61.8% fibonacci extension, horizontal swing high resistance).
Stochastic (34,5,3) is also approaching support and we might see a corresponding bounce in price should it react off this level.
Trading CFDs on margin carries high risk.
Losses can exceed the initial investment so please ensure you fully understand the risks

HSI approaching support, potential bounce!Hang Seng Index is approaching our first support at 25562 (horizontal swing low support, 61.8% Fibonacci extension, 78.6%, 61.8% fibonacci retracement ) where a strong bounce might occur above this level pushing price up to our major resistance at 26619 (61.8% fibonacci extension, 61.8% fibonacci retracement, horizontal swing high resistance). Stochastic (34,5,3)is approaching support and we might see a corresponding bounce in price above this level.
Trading CFDs on margin carries high risk.
Losses can exceed the initial investment so please ensure you fully understand the risks.

Rejection from Fibbs and trendline1. Good RR with stoploss above structure
2. Pin bar rejection from the fibb level
3. Volume is low on the pullback
4. Rejection from trend line.
5. Lower close of previous low in 1hour time frame. Good reason for entry

HSI testing resistance, potential drop! Price is testing our first resistance at 26619 61.8% fibonacci retracement, 61.8% fibonacci extension, horizontal swing high resistance) where a strong drop might occur pushing price down to our major support at 25562 78.6%, 61.8% fibonacci retracement, 61.8% fibonacci extension, horizontal swing low support).
Stochastic (34,5,3) is also approaching resistance where we might see a corresonding drop at this level.
Trading CFDs on margin carries high risk.
Losses can exceed the initial investment so please ensure you fully understand the risks.

Hong Kong HSI will test upward trend line2018.12.06 Hong Kong HSI will test upward trend line, if HSI cross below upward trend line, will have more chance to go lower.


HSI approaching resistance, potential drop! HSI is approaching our first resistance at 27336 (100% fibonacci extension, 78.6% fibonacci retracement, horizontal swing high resistance) and a strong drop might occur pushing price down to our major support at 25050 (61.8% Fibonacci extension, 76.4% Fibonacci retracement, Horizontal swing low support).
Stochastic (89,5,3) is also approaching resistance and we might see a corresponding drop in price should it react off this level.
Trading CFDs on margin carries high risk.
Losses can exceed the initial investment so please ensure you fully understand the risks.

Hang Seng IndexThe Hang Seng index should have a sharp wave 4 rebound as wave 2 is a sideway movement. we should aim for 27200-28000 target.
then a wave 5 again. so wait for the sweet spot for sell or buy into to the rebound now.

Hang Seng reversalI'm gonna let this G20 bullish mania settle a bit and see how these indices react to these gap ups before making a move but this looks like a clear cut reversal head and shoulders coming off an island bottom. Looks bullish. Might miss some of the move if it keeps running from here but if it actually ends up being a valid reversal there will be plenty of profit getting in a bit late.

HSI approaching resistance, potential drop! HSI is approaching our first resistance at 26619 (Horizontal swing high resistance, 61.8% fibonacci retracement, 61.8% fibonacci extension) and a strong drop might occur below this level pushing price down to our major support at 24316 (horizontal swing low support, 61.8% fibonacci retracement, 61.8% fibonacci extension).
Stochastic (34,5,3) is also approaching resistance and we might see a corresponding drop in price should it react off this level.
Trading CFDs on margin carries high risk.
Losses can exceed the initial investment so please ensure you fully understand the risks

HSI ShortsPrice is revisiting previous swing high levels. Although resistance is around 26400, price can definitely continue to increase further before coming down. Thus it is only logical to place your Stop Loss above the previous Swing Highs. The Stop Loss level of 26800 is part of my strategy. If you are following this trade, do not adjust the stop loss. Rather, adjust your lot sizing instead. This is one of the very few Low Risk, High Reward Trade. Personally I have increasing my risk for 1% to 5% (thus 5x the usual profits).
Trade with care everyone and have a good week ahead. If you find my trades and analysis helpful, please visit my Patreon to support me :)
