Am I wrong about a CRASH?Another 2000 more point drop will confirm a strong bear. Within a short span of time it is called a crash.Within a longer span of time, it is called a bear.
Hang Seng HSI

Extrem mid to long term bearish view on HSIBear is here.
HSI Suppose it goes according to the proposed head and shoulders pattern, the next target would be over 5000 points downwards. I will update once per week.

2018 Feb. 08 - Forecast the R/S levels of the rebound2018 Feb. 08 - Forecast the R/S levels of the rebound

China Blue Chips: BTFDMCHI tracks the big China blue chips
China and Japan possibly oversold from the last week of selloffs.
N225 and HSI
Now that the DJI, IXIC and SPX have found a bottom (hopefully) expect Asia to bounce.
Got in at 70, looking to sell over the week at 76-78

HSI is crashing, isn't it? How much more can it drop?Here is our forecasting report for HangSeng Index (HSI) on 6 February 2018. Enjoy.
Good trading
NinjaSingapore
6 February 2018
DISCLAIMER
Our research materials are provided for information purposes only. They should not be used or considered as an offer to sell or a solicitation of an offer to buy any securities. The research materials are prepared for general circulation and general information only. They do not take into account the specific investment objectives, investment knowledge and experience and financial situation of any recipient. Investors seeking to buy or sell any securities discussed or recommended in our research materials, should seek independent financial advice relating thereto and make his/her own appraisal of the tax or other financial merits of the investment.
Any opinions expressed are subject to change without prior notice. Our research materials are based on information from various sources believed to be reliable. Although all reasonable care has been taken to ensure that such information is not misleading, we make no guarantee, representation or warranty, expressed or implied as to its accuracy, adequacy or completeness. We do not accept any liability whatsoever for any direct, indirect or incidental, special or consequential loss of any kind arising out of the use or reliance on the information in our research materials.

HSI Daily Update (30/1/18)Indices across the board are facing strong downwards movement.
HSI just break through the support zone, next support will be at 32000.
Reachable soon...
Disclaimer:
The information contained in this presentation is solely for educational purposes and does not constitute investment advice.
The risk of trading in securities markets can be substantial. You should carefully consider if engaging in such activity is suitable for your own financial situation.
SonicR Mastery team is not responsible for any liabilities arising from the result of your market involvement or individual trade activities

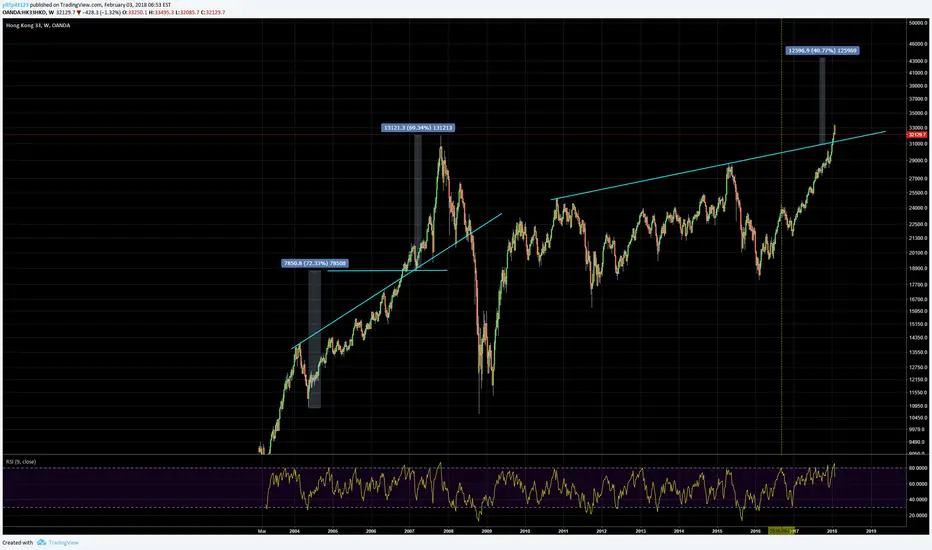
HSI backtest breakout price should able to backtest the breakout and as like in previous mega bull phrase, further high if the trendline hold ?
HSI channel top- approaching channel top, similar to SPX/NDX/Shanghai composite ... very close to big inflection point so bull has to aware

TECENT made an all-time high today. What's next? Tecent (700) is a major component stock in Hang Seng Index (HSI). The index made another new high today and it's interesting to note that Tecent has equally made an all-time high today at $449 since its low at $365.20 on 6 December 2017.
Investors like you may be wondering how high potentially this stock can go. From a technical outlook, this stock has an upward bias. Based on our forecast, if the bullish momentum continues, we could potentially see this stock testing $460 as its first target. If the stock continues its bullish move, then we could potentially see the next target be $520. It may sound crazy honestly but this is purely based on our forecasting methodology. So we are happy to prepare a forecasting report on this stock and we will monitor its move closely.
Good trading
NinjaSingapore
17 Jan 2018
DISCLAIMER
Our research materials are provided for information purposes only. They should not be used or considered as an offer to sell or a solicitation of an offer to buy any securities. The research materials are prepared for general circulation and general information only. They do not take into account the specific investment objectives, investment knowledge and experience and financial situation of any recipient. Investors seeking to buy or sell any securities discussed or recommended in our research materials, should seek independent financial advice relating thereto and make his/her own appraisal of the tax or other financial merits of the investment.
Any opinions expressed are subject to change without prior notice. Our research materials are based on information from various sources believed to be reliable. Although all reasonable care has been taken to ensure that such information is not misleading, we make no guarantee, representation or warranty, expressed or implied as to its accuracy, adequacy or completeness. We do not accept any liability whatsoever for any direct, indirect or incidental, special or consequential loss of any kind arising out of the use or reliance on the information in our research materials.

HSI hit a 10-year high on 15 Jan 2018 but what's next?Hang Seng Index (HSI) has hit a 10-year high today at 31733 but eventually closed in a bearish candle at 31338.
The index has been going up and up since the beginning of 2018 and finally it turned into a semi-long bearish candle.
Investors like you may be wondering the index will resume its uptrend since the recent low of 28134 on 7 December 2018. From a technical outlook, this index remains in an upward bias. Based on our forecast, however, we will be watching for retracement at two key levels - the first one will be at 31360 and if this level does not provide the necessary support, the next level will be 30000 which is also the psychological level of this index. We will monitor these levels closely and see whether the index will potentially resume its move to the upside.
Good trading
NinjaSingapore
15 Jan 2018
DISCLAIMER
Our research materials are provided for information purposes only. They should not be used or considered as an offer to sell or a solicitation of an offer to buy any securities. The research materials are prepared for general circulation and general information only. They do not take into account the specific investment objectives, investment knowledge and experience and financial situation of any recipient. Investors seeking to buy or sell any securities discussed or recommended in our research materials, should seek independent financial advice relating thereto and make his/her own appraisal of the tax or other financial merits of the investment.
Any opinions expressed are subject to change without prior notice. Our research materials are based on information from various sources believed to be reliable. Although all reasonable care has been taken to ensure that such information is not misleading, we make no guarantee, representation or warranty, expressed or implied as to its accuracy, adequacy or completeness. We do not accept any liability whatsoever for any direct, indirect or incidental, special or consequential loss of any kind arising out of the use or reliance on the information in our research materials.

HSI HangSENG at key fib levelsHSI HangSENG at key fib levels .. Beware of sharp profit taking or selloff


HSI Short Position CallingGiven the Hang Seng prices about to reach its high point, I call a short for this upcoming week. While there is potential for some long term gains, I believe an extremely short position is conservatively the best calling. That would maximize losses and still bring some profits just looking at the technical analysis of past charting patterns. Also it still looks extremely bearish given it is a strong buy. I would predict the best strategy would be a short over long holding for expected positive correlations. Overall though, it is extremely highly investible.

HSI bearish view
If it was true that 2018 is a bearish year for emerging markets, then I predict the HSI will go as the figure indicates.

Hang Seng Index - channel-riding up the channel and price rejected at channel top 302ish
-Cash gap in 2007 top at 309-313, future has already filled the gap due to fat finger
- it becomes a mystery if cash price will fill the gap in future
- however, need to see more bar to confirm bearish, a double top/lower high will be a tradable short

HSI 38000 target?Triangle break .. pullback breakout point sooner later then epic move ?
14x PE vs US 25x PE ... why ? becoz Shanghai A share is too weak ... tightening in China ~ so it is the black swan !


The Global Stock Market (excluding US) is OverboughtThe Global Stock Market's (excluding US) Monthly RSI is Entering Overbought Territory. While not as extreme as VT, I would be careful about going long here in developed markets or emerging markets. For a while longer, I expect it will outperform the US but I think it will for in upcoming months. The ECB is planning (that may change if stocks or especially bonds fall) cutting back on its quantitative easing as is China. This drop in stimulus and liquidity will likely cause a downturn in European and Chinese markets. EDZ (3x bear) and EDC (3x bull) are leveraged emerging markets etfs. DPK (3x bear) and DZK (3x bull) are leveraged developed markets etfs.

up with a bangafter closing at 29018 yesterday , the index gaped up with great momentum this morning and broke the high two days ago
now it would only be safe to go short again if the hourly bar closes below 29214 ( 29190 for futures).
if this level holds, hsi could go all the way to 2943x-295xx

ICBC HK Stocks Daily Update (15/8/17)Trenches below supporting the price
We have a resistance preventing the price from moving upwards.
Once 5.8 is clear, it would easily fly.
Disclaimer :
This analysis not include personal feeling/opinion, and pure base on technical analysis
Trading foreign currencies can be a challenging and potentially profitable opportunity for investors. However, before deciding to participate in the Forex market, you should carefully consider your investment objectives, level of experience, and risk appetite. Most importantly, do not invest money you cannot afford to lose.
please inform me with post a comment if it reach some critical point/break pattern, reach target/reach stop level.
or if there is any question about this analysis/need new update.
Because im not monitoring this chart all time.


the big picturemaybe the big trend looks sth like that
just guessing
Anyway I never trade based on Elliott wave only
This is just for fun :)
