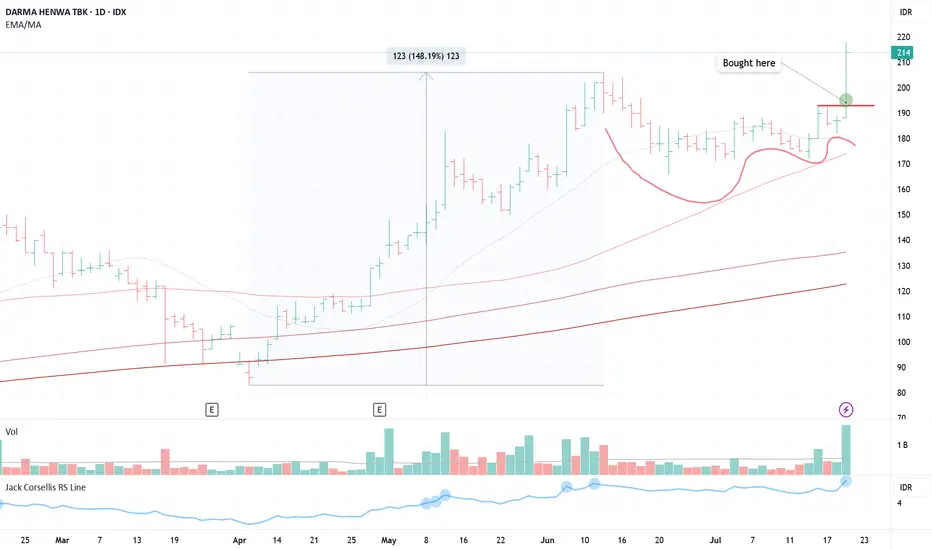
$DEWA (VCP - 6W 19/6 3T)Position update: July 21, 2025.
Key factors:
1. Confirmed stage 2 uptrend.
2. A textbook Volatility Contraction Pattern (VCP) with a clearly defined, low-risk entry point.
3.Currently forming a VCP following a prior price surge of nearly 150%, demonstrating strong momentum.
4. The stock moves on its own drummer, rallying close to 150% while the broader market advanced just 23%.
5. Displays high relative strength, outperforming sector and index benchmarks.
6. Volume has dried up, indicating less supply coming to the market.
7. Significant volume expansion on the breakout.
Considerations: Despite a favorable technical setup, risk should be managed diligently given the stock's sharp ascent and potential for profit-taking. Establishing stop-loss levels and monitoring market conditions is essential.
This is another quintessential VCP breakout with a clear pivot entry and minimal risk. I’m starting to see increased traction in the market now—a very positive sign to scale up trading size.
HTF
ANJT - POWER PLAYPosition Update: May 6, 2025
Key factors:
1. Low-risk entry point.
2. It has a very tight correction area.
3. A strong sign of continuation of upward momentum.
4. Corrects below 4% during this pause, indicating big institutions' reluctance to sell their positions.
5. High relative strength, outperforming the general market.
5. The stock is moving on its own universe and marching to its own drummer.
6. Volume diminishes during the correction, indicating less supply coming to the market.
7. The general market is in the early stages of a bull campaign.
8. Huge volume on the breakout
Consideration: Not many traction in the market so far.
This is a classic Power Play setup, featuring two viable entry points. My initial position was taken on April 14 from the low cheat and added big on a very clear pivot point today. I’m looking forward to seeing further constructive price action moving forward.

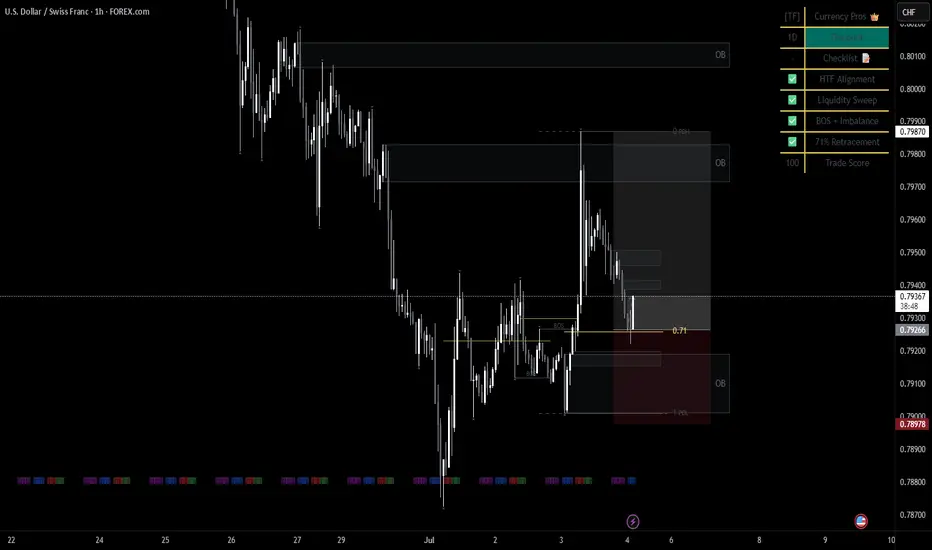
BUY USDCHFa few confirmations that influenced this trade. BOS, 71 fib & HTF alignment. I believe this will play out beautiful by Monday. lets goooooo
Layout TestHello World
HTF - 1h timeframe on left
LTF - 10s timeframe on right
FVG zones and Volume Profile
Key Levels

NVDA to $240 by 2026NASDAQ:NVDA is bullish still, anyone can see that, however I wanted to find some targets once it's in price discovery mode, well the golden pocket happpens to be $240 ($225-$250)
on weekly trend is confirmed extremely bullish so I'll continue holding and NASDAQ:NVDA should break $240 before 2026
Even a buy signal went off at the bottom in April. Let's see how much gas NASDAQ:NVDA has after it breaks the famous $150 resistance level

EURUSD 3-7 Mar 2025 W10 - Weekly Analysis- EU Rate - US NFP WeekThis is my Weekly analysis on EURUSD for 3-7 Mar 2025 W10 based on Smart Money Concept (SMC) which includes the following:
Market Sentiment
Weekly Chart Analysis
Daily Chart Analysis
4H Chart Analysis
Economic Events for the Week
Market Sentiment
The EUR/USD pair faces a slightly bearish bias this week, driven by key economic events, geopolitical risks, and trade uncertainties.
Key Events to Watch:
🔹 ECB Interest Rate Decision (March 6) – Markets expect a 25 bps rate cut to 2.50%. A dovish ECB could pressure the euro, while any hints of a pause may provide support.
🔹 U.S. Non-Farm Payrolls (March 7) – Forecast at +133K jobs, with unemployment steady at 4.0%. Weak data could weigh on the USD, while stronger payrolls and wage growth may boost it.
🔹 Trump’s Tariffs & Trade War Risks – New U.S. tariffs on Mexico, Canada, and China take effect March 4, with potential auto tariffs on Europe looming. These policies favor the dollar by driving risk-off sentiment.
🔹 Geopolitical Tensions – U.S.-Ukraine relations deteriorated after a public Oval Office clash between Trump and Zelenskiy. Further instability could impact investor confidence and increase safe-haven demand for the USD.
Trading Strategy:
✅ Bearish Scenario: A dovish ECB, strong U.S. NFP, and escalating trade risks could push EUR/USD down.
✅ Bullish Scenario: If the ECB signals a rate-cut pause and U.S. jobs data disappoint, EUR/USD may test 1.055–1.06 .
Overall, the fundamental backdrop leans in favor of the USD, but volatility is expected, especially around the ECB and NFP releases. Traders should stay alert to geopolitical developments and tariff announcements that may shift sentiment.
Weekly Chart Analysis
1️⃣
🔹Swing Bearish
🔹Internal Bearish (Pullback Phase)
🔹In Swing Discount
🔹Swing Continuation Phase (Pro Swing + Pro Internal)
2️⃣
🔹INT structure continuing bearish with iBOS following the Bearish Swing. (End of 2023 till end of 2024 was a pullback phase after the first bearish iBOS)
3️⃣
🔹After the bearish iBOS we expect a pullback, price tapped into Monthly Demand and the liquidity below Nov 2022 which is above the weekly demand formed with the initiation of the bearish iBOS pullback phase.
🔹Price made a bullish CHoCH which indicated that the liquidity was enough as per previous weeks analysis to initiate a pullback phase for the bearish iBOS.
🔹Price pulled back after the Bullish CHoCH to the Weekly Demand formed and showed reaction after volatile week.
🔹With the previous week Bearish close, weekly is consolidating between 1.05xx and 1.02xx
🔹Still the recent Bullish Fractal and Demand holding but failed to break the high (1.0533) so there is a probability to target the low 1.0285/10 and could extend to continue the Bearish INT Structure with iBOS.
Daily Chart Analysis
1️⃣
🔹Swing Bearish
🔹INT Bearish
🔹Swing Continuation Phase (Pro Swing + Pro Internal)
2️⃣
🔹Following the Bearish Swing BOS, INT Structure continuing bearish tapping the weekly demand zone.
3️⃣
🔹After the failure to close below the Weak INT Low, price continued bullish sweeping the liquidity above Dec 30 and mitigating a Daily supply zone within the INT Structure Premium Zone.
🔹With the mitigation of the Daily supply, price created a Bearish CHoCH signaling the end of the Pullback Phase of the INT structure and the start of the Bearish move targeting the Weak INT Low.
🔹Price failed for the 2nd time to close below the Weak INT Low after mitigating the Daily Demand formed from the failure to close below the Weak INT Low which triggered aggressive Bullish reaction and mitigating the Daily Supply Zone formed from the recent Bearish CHoCH.
🔹After Supply mitigation, price continued Bearish following the Bearish INT Structure continuation phase.
🔹With the Weekly is consolidating the Daily consolidation range showing that we are failing to continue Bullish and with the recent Bearish CHoCH we are back to the Bearish INT Structure continuation and we may target the Weak INT Low (At least 1.0285).
🔹Price could pullback to the recent Daily Supply before continuing down.
🔹Expectation is set to Bearish with cautious of the Liq. built above 1.05333 and the range we are in.
4H Chart Analysis
1️⃣
🔹Swing Bullish (Reached Swing Extreme Demand)
🔹INT Bearish (Adjusted my INT structure to align with the previous Bullish move)
🔹Complex Swing INT Structure
2️⃣
🔹As the Swing is Bullish, expectations were set to continue Bullish targeting the Weak Swing High and create a Bullish BOS after the Deep Pullback to the Swing Demand.
🔹During the Swing Bullish Continuation after the Deep Pullback, INT Structure kept holding Bullish to fulfill the Bullish continuation phase.
🔹With price reaching the Swing Extreme Premium zone and the expectation of breaking the Weak Swing High, price failed 2 times and with the 3rd attempt it created a Bearish iBOS. This indicated that the Swing INT structure is Complex and the Daily/Weekly TFs are still in play.
3️⃣
🔹After the Bearish iBOS, we expect PB, there is no clear POI for price to initiate PB except the Liq. at 1.03730 which was swept on Friday and 1.03173 before mitigating the last clear 4H Demand.
🔹With the recent Bearish iBOS, the PB could start at anytime. The Liq. swept from 1.0373 could provide that PB otherwise we will continue Bearish till the clear 4H Demand (Which I doubt that it could provide the continuation) but with LTF shifting Bullish, we can follow that.
Economic Events for the Week

Our Cycle Analysis is in Play - What's Next on HTF? 🚀 Bitcoin Cycle Update – What’s Next?
This setup is purely based on my higher timeframe (HTF) analysis, which I’ve shared before. If you’ve been following along, you already know the drill—I covered this in my last video breakdown on TradingView:
📽 Cycle Analysis Video:
📌 Tracking Idea: Bitcoin Cycle Analysis -
Positioning & Market Outlook
We loaded our final spot buys months ago and have been scaling out since November—not fully out, but we’ve booked profits on the majority of our Bitcoin and altcoin holdings over the last three months.
💰 Spot Bag Adds: BTC Spot Buys -
Now, I’m still tracking a 3-Drive pattern for this cycle’s top. A previous 3-Drive setup on the daily was invalidated after choppy price action and sideways movement, but I’m still pursuing the same idea—just on the weekly and monthly timeframes now.
🔹 Key Zone: FWB:73K – $69K (Major SR level I’ve been watching)
🔹 Yealy Pivot Zone -
🔹 Time-Based Bias: Still refining my time analysis—so take it with a grain of salt 😅
USDT Dominance & Key Confluences
One of the biggest confirmations I’m watching is USDT Dominance. I had been tracking an FVG around 4.9x%, which held for a week before breaking:
📈 USDT Dominance Chart:
Right now, the focus is on trendline resistance & Fibonacci retracement levels. If USDT.D breaks higher, the idea is invalid, and I’ll simply keep riding my shorts.
Execution Plan – How I’m Playing This
This setup is strictly for spot buys. If you remember the last cycle, we accumulated BTC during the FTX crash at $18K and only added longs when we spotted a clear inverse head & shoulders setup.
🎯 This time, I’m placing spot bids & waiting for clear reactions.
🔹 Looking for WICKS into demand, NOT sideways chop.
🔹 If price chops, I EXIT—simple as that.
🔹 I’ll consider leverage positions ONLY when we see strong reactions.
I’ll keep this idea updated just like before. At the end of the day, we’re all speculators—no one can predict the market, only manage risk and play probabilities.
⚠ Risk Management: DO NOT RISK MORE THAN 5% OF YOUR PORTFOLIO ON THIS SETUP.
📢 Disclaimer: I am not a financial advisor. This is NOT financial advice—just sharing my thoughts and analysis. Do your own research before making any investment decisions.

EURUSD 24-28 Feb 2025 W9 - Weekly Analysis - US GDP / PCE Week!This is my Weekly analysis on EURUSD for 24-28 Feb 2025 W9 based on Smart Money Concept (SMC) which includes the following:
Market Sentiment
Weekly Chart Analysis
Daily Chart Analysis
4H Chart Analysis
Economic Events for the Week
Market Sentiment
Inflation Data Dominates
Hotter-than-expected U.S. CPI/PPI initially fueled inflation fears, but signs of moderation in underlying PPI components raised hopes for softer PCE data next week.
Investors see a growing chance of Fed rate cuts in late 2025, limiting USD strength.
Tariff Noise vs. Market Calm
Trump’s tariff threats (e.g., reciprocal steel/aluminum duties) were largely dismissed as negotiation tactics, easing fears of an immediate trade war.
Markets expect delays in implementation, reducing near-term volatility.
Geopolitical Progress Supports Risk Sentiment
Reports of progress in Ukraine-Russia peace talks (e.g., territory swaps) reduced safe-haven demand for the USD, indirectly boosting the Euro.
Stabilizing energy prices and supply chains further supported the Eurozone outlook.
Central Bank Divergence
The Fed remains cautious, emphasizing data dependency, while the ECB signals potential rate cuts later in 2025.
Short-term EUR resilience stems from reduced trade-war risks and improving Eurozone economic data.
Focus on Upcoming Catalysts
This week PCE inflation report (Fed’s preferred gauge) will test disinflation optimism.
Weak U.S. retail sales/industrial production amplified concerns about slowing growth, weighing on the USD.
Key Takeaways
Bullish Drivers:
Progress in geopolitical tensions.
Softening inflation expectations ahead of PCE data.
Tariffs seen as negotiation tools, not immediate threats.
Bearish Risks:
A hot PCE report reviving Fed hawkishness.
Sudden tariff escalations or breakdowns in peace talks.
Overall Sentiment:
Cautiously bullish for EUR/USD this week, with upside hinging on sustained risk appetite and confirmation of disinflation trends.
Weekly Chart Analysis
1️⃣
🔹Swing Bearish
🔹Internal Bearish (Pullback Phase)
🔹In Swing Discount
🔹Swing Continuation Phase (Pro Swing + Pro Internal)
2️⃣
🔹INT structure continuing bearish with iBOS following the Bearish Swing. (End of 2023 till end of 2024 was a pullback phase after the first bearish iBOS)
3️⃣
🔹After the bearish iBOS we expect a pullback, price tapped into Monthly Demand and the liquidity below Nov 2022 which is above the weekly demand formed with the initiation of the bearish iBOS pullback phase.
🔹Price made a bullish CHoCH which indicated that the liquidity was enough as per previous weeks analysis to initiate a pullback phase for the bearish iBOS.
🔹Price pulled back after the Bullish CHoCH to the Weekly Demand formed and showed reaction after volatile week.
🔹With the previous week solid Bullish close, the Demand did hold and there is a high probability that price could continue Bullish to facilitate the INT structure pullback phase.
🔹If price to continue Bullish, price will be targeting the liquidity above Dec 2024, INT Structure EQ (50%) at 1.06933 to target the Weekly Supply in premium before continuing down to target the Weak INT Low.
🔹Expectations is for price to continue Bullish if it managed to break 1.05333 27 Jan High to facilitate the INT structure pullback.
Daily Chart Analysis
1️⃣
🔹Swing Bearish
🔹INT Bearish
🔹Swing Continuation Phase (Pro Swing + Pro Internal)
2️⃣
🔹Following the Bearish Swing BOS, INT Structure continuing bearish tapping the weekly demand zone.
3️⃣
🔹After the failure to close below the Weak INT Low, price continued bullish sweeping the liquidity above Dec 30 and mitigating a Daily supply zone within the INT Structure Premium Zone.
🔹With the mitigation of the Daily supply, price created a Bearish CHoCH signaling the end of the Pullback Phase of the INT structure and the start of the Bearish move targeting the Weak INT Low.
🔹Price failed for the 2nd time to close below the Weak INT Low after mitigating the Daily Demand formed from the failure to close below the Weak INT Low which triggered aggressive Bullish reaction and mitigating the Daily Supply Zone formed from the recent Bearish CHoCH.
🔹After Supply mitigation, price continued Bearish following the Bearish INT Structure continuation phase.
🔹Previous week I mentioned “if the Daily formed a Bullish CHoCH (Currently above the recent mitigated Supply) this will shift my outlook to the Weekly Scenario of a deep pullback of the Weekly INT Structure to at least the Structure EQ (50%). MTF required to shift Bullish to confirm”. And with that happened I’d shifted to Bullish expectation and there is expectations of a deep pullback within the Daily Bearish INT structure.
🔹The expected targets for the current bullish move is 1st to sweep the liquidity above the equal highs (17 Dec & 27 Jan) 2nd Break of the Strong INT High to facilitate the Daily Bearish Swing pullback and the Weekly Bearish INT pullback.
🔹Currently Supply is failing and Demand is holding confirms the short-term Bullish scenario and setting my expectations for continuing Bullish. Price had pulled back to the recent Daily Demand and continued Bullish.
4H Chart Analysis
1️⃣
🔹Swing Bullish (Reached Swing Extreme Demand)
🔹INT Bearish (Reached Extreme Supply)
🔹INT-INT Bullish (Reached EQ (50%)
🔹Swing Continuation
2️⃣
🔹With the deep pullback to the Bullish Swing extreme discount and mitigating the 4H/Daily demand zones, price turned Bullish forming a Bullish CHoCH.
🔹The current Bullish move from Swing extreme discount to current price level having 2 scenarios (Previously I’d the following 2 scenarios where now I favors the 2nd scenario due to the impulsive nature of the move):
Scenario 1: Pullback for Bearish INT Structure and with the recent Bearish CHoCK and Minor Demand zones are failing, I expect Bearish continuation to target the Weak INT Low which aligns with the Daily/Weekly Bearish Structure/Move. (Counter Swing – Pro Internal)
Scenario 2: Bullish Swing continuation to target the Weak Swing High. Which requires to have Demand holding and Supply failing. The first sign required to confirm this scenario will be the current Demand which price is currently at to hold and we form a Bullish CHoCH. (Pro Swing – Counter Internal)
🔹As expected yesterday, price managed to continue Bullish after reaching the INT-INT structure EQ (50%) in a solid impulsive move aligns with the Swing continuation move.
3️⃣
🔹Still expectation is set to continue Bullish targeting the Weak Swing High as long LTFs holds Bullish structures. Also, In my mind I’m not neglecting the current Bearish 4H INT structure and we already reached that structure extreme where we are getting the current corrective Bearish OF.
Economic Events for the Week

EURUSD 17-21 Feb 2025 W8 - Weekly Analysis -EU ZEW - US FOMC/PMIThis is my Weekly analysis on EURUSD for 17-21 Feb 2025 W8 based on Smart Money Concept (SMC) which includes the following:
Market Sentiment Weekly Chart AnalysisDaily Chart Analysis4H Chart AnalysisEconomic Events for the WeekRelated PostsLatest Weekly Analysis
Market Sentiment
Inflation Data Mix
U.S. CPI and PPI came in hotter than expected, signaling lingering inflation pressures.
However, softer underlying PPI components linked to the Fed’s preferred PCE metric raised hopes for a moderation in inflation next week.
Fed Policy Expectations
Investors are cautiously optimistic about potential Fed rate cuts later in 2025, despite the Fed’s current "wait-and-see" stance.
A softer PCE report next week could solidify bets on easing monetary policy, supporting risk assets like the Euro.
Trump’s Tariff Strategy
Markets dismissed Trump’s reciprocal tariff threats as negotiation tactics rather than a prelude to a trade war.
Investors expect delays in implementation, reducing immediate fears of economic disruption.
Geopolitical Optimism
Progress in Ukraine-Russia peace talks (e.g., territory swap discussions) eased global risk aversion, weakening the USD’s safe-haven appeal.
Reduced geopolitical tensions benefit the Eurozone economy, indirectly lifting the Euro.
Central Bank Divergence
The ECB may cut rates further in 2025, but improving Eurozone data and reduced trade-war risks provide short-term EUR support.
The Fed’s cautious tone limits USD upside, creating a balanced tug-of-war.
Short-Term Bias
Cautiously bullish for EUR/USD, driven by optimism over delayed tariffs, geopolitical progress, and hopes for softer inflation.
Key Risks:
A hot PCE report reviving Fed hawkishness.
Sudden tariff escalations or breakdowns in peace talks.
This balance of factors suggests choppy but upward-leaning trading for EUR/USD.
Weekly Chart Analysis
1️⃣
🔹Swing Bearish
🔹Internal Bearish
🔹In Swing Discount
🔹Swing Continuation Phase (Pro Swing + Pro Internal)
2️⃣
🔹INT structure continuing bearish with iBOS following the Bearish Swing. (End of 2023 till end of 2024 was a pullback phase after the first bearish iBOS)
3️⃣
🔹After the bearish iBOS we expect a pullback, price tapped into Monthly Demand and the liquidity below Nov 2022 which is above the weekly demand formed with the initiation of the bearish iBOS pullback phase.
🔹Price made a bullish CHoCH which indicated that the liquidity was enough as per previous weeks analysis to initiate a pullback phase for the bearish iBOS.
🔹Price pulled back after the Bullish CHoCH to the Weekly Demand formed and showed reaction after volatile week.
🔹With the previous week solid Bullish close, the Demand did hold and there is a high probability that price could continue Bullish to facilitate the INT structure pullback phase.
🔹If price to continue Bullish, price will be targeting the liquidity above Dec 2024, INT Structure EQ (50%) at 1.06933 to target the Weekly Supply in premium before continuing down to target the Weak INT Low.
🔹Expectations is for price to continue Bullish if it managed to break 1.05333 27 Jan High to facilitate the INT structure pullback.
Daily Chart Analysis
1️⃣
🔹Swing Bearish
🔹INT Bearish
🔹Swing Continuation Phase (Pro Swing + Pro Internal)
2️⃣
🔹Following the Bearish Swing BOS, INT Structure continuing bearish tapping the weekly demand zone.
3️⃣
🔹After the failure to close below the Weak INT Low, price continued bullish sweeping the liquidity above Dec 30 and mitigating a Daily supply zone within the INT Structure Premium Zone.
🔹With the mitigation of the Daily supply, price created a Bearish CHoCH signaling the end of the Pullback Phase of the INT structure and the start of the Bearish move targeting the Weak INT Low.
🔹Price failed for the 2nd time to close below the Weak INT Low after mitigating the Daily Demand formed from the failure to close below the Weak INT Low which triggered aggressive Bullish reaction and mitigating the Daily Supply Zone formed from the recent Bearish CHoCH.
🔹After Supply mitigation, price continued Bearish following the Bearish INT Structure continuation phase.
🔹Previous week I mentioned “if the Daily formed a Bullish CHoCH (Currently above the recent mitigated Supply) this will shift my outlook to the Weekly Scenario of a deep pullback of the Weekly INT Structure to at least the Structure EQ (50%). MTF required to shift Bullish to confirm”. And with that happened I’d shifted to Bullish expectation and there is expectations of a deep pullback within the Daily Bearish INT structure.
🔹The expected targets for the current bullish move is 1st to sweep the liquidity above the equal highs (17 Dec & 27 Jan) 2nd Break of the Strong INT High to facilitate the Daily Bearish Swing pullback and the Weekly Bearish INT pullback.
🔹Currently Supply is failing and Demand is holding confirms the short-term Bullish scenario and setting my expectations for continuing Bullish. Price could pullback to the recent Daily Demand before continuing Bullish.
4H Chart Analysis
1️⃣
🔹Swing Bullish
🔹INT Bearish
🔹Reached Swing Extreme Demand
🔹Swing Continuation
2️⃣
🔹With the deep pullback to the Bullish Swing extreme discount and mitigating the 4H/Daily demand zones, price turned Bullish forming a Bullish CHoCH.
🔹The current Bullish move from Swing extreme discount to current price level having 2 scenarios (Previously I’d the following 2 scenarios where now I favors the 2nd scenario due to the impulsive nature of the move):
Scenario 1: Pullback for Bearish INT Structure and with the recent Bearish CHoCK and Minor Demand zones are failing, I expect Bearish continuation to target the Weak INT Low which aligns with the Daily/Weekly Bearish Structure/Move. (Counter Swing – Pro Internal)
Scenario 2: Bullish Swing continuation to target the Weak Swing High. Which requires to have Demand holding and Supply failing. The first sign required to confirm this scenario will be the current Demand which price is currently at to hold and we form a Bullish CHoCH. (Pro Swing – Counter Internal)
🔹With the recent moves, Supply is failing and Demand is holding solidifying the scenario that the Bullish 4H Swing continuation in play.
🔹Price swept Liq. above 30 Jan on 4H and Daily where I’d noted in the previous days analysis which can provide a decent pullback. (Bearish CHoCH is required to confirm the Sweep of Liquidity. Otherwise, it’s not enough and price will continue from the recent 4H Demand formed).
3️⃣
🔹Expectations is set to continue Bullish to target the Weak 4H Swing High to facilitate to the Daily and Weekly expected Bullish move.
Economic Events for the Week

EURUSD 10-14 Feb 2025 W7 - Weekly Analysis - US CPI/PPI/PowellThis is my Weekly analysis on EURUSD for 10-14 Feb 2025 W7 based on Smart Money Concept (SMC) which includes the following:
Market Sentiment
Weekly Chart Analysis
Daily Chart Analysis
4H Chart Analysis
Economic Events for the Week
Market Sentiment
Mixed Labor Market Signals
The February 7 NFP report showed 143K new jobs (below expectations of 170K), signaling potential cooling in the labor market. However, strong wage growth (0.5% MoM, 4.1% YoY) and a 4% unemployment rate (down from 4.1%) suggest lingering inflationary pressures.
Markets may interpret this as a "Goldilocks" scenario: cooling job growth could delay Fed rate hikes, but elevated wage inflation keeps stagflation risks alive.
Tariff Volatility and Trade Uncertainty
Trump’s tariffs (10% on China, delayed 25% on Canada/Mexico) dominate market psychology. While tariffs are a negotiation tool, their sudden implementation and reversal create uncertainty. For example:
Automotive and energy sectors face direct risks due to integrated North American supply chains.
Consumer goods (e.g., electronics, produce) may see price hikes, amplifying inflation fears.
Retaliatory measures from China add to global trade tensions.
Week major news events
Fed’s Powell testifies
ECB Lagarde Speech
US CPI, PPI and Retail Sales
EU GDP
Given the forecasts and the recent NFP report showing slower job growth, market sentiment could be cautious. If the CPI and PPI readings come in higher than expected, it could reinforce concerns about inflation and lead to USD Strength. Investors might seek safe-haven assets.
Conversely, if the CPI and PPI readings are in line with or lower than expectations, it could provide some relief to the markets and support a more positive sentiment which will lead to Weaker USD.
Weekly Chart Analysis
1️⃣
🔹Swing Bearish
🔹Internal Bearish
🔹In Swing Discount
🔹Swing Continuation Phase (Pro Swing + Pro Internal)
2️⃣
🔹INT structure continuing bearish with iBOS following the Bearish Swing. (End of 2023 till end of 2024 was a pullback phase after the first bearish iBOS)
3️⃣
🔹After the bearish iBOS we expect a pullback, price tapped into Monthly Demand and the liquidity below Nov 2022 which is above the weekly demand formed with the initiation of the bearish iBOS pullback phase.
🔹Price made a bullish CHoCH which indicated that the liquidity was enough as per previous week analysis to initiate a pullback phase for the bearish iBOS.
🔹Price pulled back after the Bullish CHoCH to the Weekly Demand formed and showed reaction after a volatile week.
🔹Price still looking bearish to target the Weak INT low to target the Weekly unmitigated demand. Ultimately targeting the Swing Weak Low.
🔹Noticing that the Bearish INT Low didn’t pullback to at least the INT Structure EQ (50%) so there is a chance that price could hold the current Weekly Demand to fulfil the i-BOS pullback phase which will require MTF to confirm this scenario.
🔹Expectation is set to Bearish continuation targeting the Weak INT Low and the unmitigated Weekly Demand.
Daily Chart Analysis
1️⃣
🔹Swing Bearish
🔹INT Bearish
🔹Swing Continuation Phase (Pro Swing + Pro Internal)
2️⃣
🔹Following the Bearish Swing BOS, INT Structure continuing bearish tapping the weekly demand zone.
3️⃣
🔹After the failure to close below the Weak INT Low, price continued bullish sweeping the liquidity above Dec 30 and mitigating a Daily supply zone within the INT Structure Premium Zone.
🔹With the mitigation of the Daily supply, price created a Bearish CHoCH signaling the end of the Pullback Phase of the INT structure and the start of the Bearish move targeting the Weak INT Low.
🔹Price failed for the 2nd time to close below the Weak INT Low after mitigating the Daily Demand formed from the failure to close below the Weak INT Low which triggered aggressive Bullish reaction and mitigating the Daily Supply Zone formed from the recent Bearish CHoCH.
🔹After Supply mitigation, price continued Bearish following the Bearish INT Structure continuation phase.
🔹Expectations is price to continue Bearish to target the Weak INT Low and hopefully we get a confirmed close which is fulfilling the Weekly target of continuing Bearish.
🔹Notice that if the Daily formed a Bullish CHoCH (Currently above the recent mitigated Supply) this will shift my outlook to the Weekly Scenario of a deep pullback of the Weekly INT Structure to at least the Structure EQ (50%). MTF required to shift Bullish to confirm.
4H Chart Analysis
1️⃣
🔹Swing Bullish
🔹INT Bearish
🔹Reached Swing Extreme Demand
🔹Swing Continuation
2️⃣
🔹With the deep pullback to the Bullish Swing extreme discount and mitigating the 4H/Daily demand zones, price turned Bullish forming a Bullish CHoCH.
🔹The current Bullish move from Swing extreme discount to current price level having 2 scenarios:
Scenario 1: Pullback for Bearish INT Structure and with the recent Bearish CHoCK and Minor Demand zones are failing, I expect Bearish continuation to target the Weak INT Low which aligns with the Daily/Weekly Bearish Structure/Move. (Counter Swing – Pro Internal)
Scenario 2: Bullish Swing continuation to target the Weak Swing High. Which requires to have Demand holding and Supply failing. The first sign required to confirm this scenario will be the current Demand which price is currently at to hold and we form a Bullish CHoCH. (Pro Swing – Counter Internal)
3️⃣
🔹Expectations is set to Bearish to target the Weak INT Low as long LTFs are staying Bearish.
Economic Events for the Week

EURUSD 3-7 Feb 2025 W6 - Weekly Analysis - Tariffs Impact & NFP This is my Weekly analysis on EURUSD for 3-7 Feb 2025 W6 based on Smart Money Concept (SMC) which includes the following:
Market Sentiment
Weekly Chart Analysis
Daily Chart Analysis
4H Chart Analysis
Economic Events for the Week
Market Sentiment
On February 1, 2025, President Donald Trump announced the imposition of tariffs on imports from Canada, Mexico, and China, effective immediately. The tariffs include a 25% levy on goods from Canada and Mexico, and a 10% tariff on Chinese imports. These measures are intended to address issues such as illegal immigration, drug trafficking, and trade imbalances.
The Federal Reserve is closely monitoring the situation to assess the potential economic impact of the new tariffs. The primary concerns include:
Inflation: The tariffs are expected to raise the cost of imported goods, which could contribute to higher inflation rates. This development may influence the Fed's monetary policy decisions, potentially leading to adjustments in interest rates to manage inflationary pressures.
Economic Growth: The increased costs for businesses and consumers may dampen economic growth. The Fed will need to balance the risks of slowing growth with the potential for rising inflation when considering future policy actions.
In summary, the imposition of tariffs on Canada, Mexico, and China has introduced significant uncertainty into the markets. Investors are concerned about the potential for increased costs and supply chain disruptions, while the Federal Reserve is evaluating the implications for inflation and overall economic growth.
Weekly Chart Analysis
1️⃣
🔹Swing Bearish
🔹Internal Bearish
🔹In Swing Discount
🔹Swing Continuation Phase (Pro Swing + Pro Internal)
2️⃣
🔹INT structure continuing bearish with iBOS following the Bearish Swing. (End of 2023 till end of 2024 was a pullback phase after the first bearish iBOS)
3️⃣
🔹After the bearish iBOS we expect a pullback, price tapped into Monthly Demand and the liquidity below Nov 2022 which is above the weekly demand formed with the initiation of the bearish iBOS pullback phase.
🔹Price made a bullish CHoCH which indicates that the liquidity was enough as per previous week analysis to initiate a pullback phase for the bearish iBOS.
🔹Price currently looking to target the liquidity built up during September 2024 and maybe reaching the Weekly supply zone (In INT structure Premium).
🔹Price had tapped into the Weekly Demand formed from the Bullish CHoCH last week. Is this demand enough to initiate the INT Pullback or with the current market sentiment and USD expectation to strength in the short-term we will continue Bearish following the Bearish Swing and INT Structures to target the Weak INT Low and Weak Swing Low?
🔹Expectations for price react from the current Weekly demand and then target the Weak INT Low to target the Weak Swing Low.
Daily Chart Analysis
1️⃣
🔹Swing Bearish
🔹INT Bearish
🔹Swing Continuation Phase (Pro Swing + Pro Internal)
2️⃣
🔹Following the Bearish Swing BOS, INT Structure continuing bearish tapping the weekly demand zone.
3️⃣
🔹After the failure to close below the Weak INT Low, price continued bullish sweeping the liquidity above Dec 30 and currently mitigating a Daily supply zone within the INT Structure Premium Zone.
🔹With the mitigation of the Daily supply, price created a Bearish CHoCH signaling the end of the Pullback Phase of the INT structure and the start of the Bearish move targeting the Weak INT Low.
🔹Currently price tapping into a Daily/Weekly Demand Zones which could provide some bounce / or reversal for price to continue up (Depends on market Sentiment and if tariffs will trigger Risk-Off and USD Strength or it’s already priced in from last week strength in USD).
🔹Expectation is set to Bearish and more LTF development required to have a clear view.
4H Chart Analysis
1️⃣
🔹Swing Bullish
🔹INT Bearish
🔹Reached Swing EQ
🔹Swing Pullback
2️⃣
🔹Price managed to create a Bearish iBOS indicating that the Swing Pullback started.
🔹After the iBOS, we expect a Pullback.
3️⃣
🔹Price currently tapping into the Daily/Weekly demand which could provide a short-term pullback (waiting for at least a Bullish CHoCH to confirm).
🔹Expectation is set to have a reaction from the Daily / 4H Demand zone to facilitate the pullback (Aligns with the Daily/Weekly expectations) then we will continue bearish to facilitate the Daily / Weekly expectations of bearish move.
Economic Events for the Week

EURUSD 27-31 Jan 2025 W5 - Weekly Analysis - EU&US Interest RateThis is my Weekly analysis on EURUSD for 27-31 Jan 2025 W5 based on Smart Money Concept (SMC) which includes the following:
Market Sentiment
Weekly Chart Analysis
Daily Chart Analysis
4H Chart Analysis
Economic Events for the Week
Market Sentiment
Weaker Dollar Sentiment: A softer tone on tariffs reduced market fears of escalating trade wars. This decreased safe-haven flows into the USD, as such rhetoric often bolsters the dollar's demand during heightened global uncertainties.
Improved Global Trade Outlook: Easing trade tensions generally supports global economic activity, benefitting risk-sensitive assets like the euro. The USD could weaken as investors seek higher-yielding opportunities outside the U.S.
Market Expectations for the Federal Reserve: If the U.S.-China trade relationship stabilizes, it could lower inflationary pressures caused by tariffs, potentially leading to a more dovish tone from the Federal Reserve. This would further weaken the dollar.
Lagging Economic Growth in Europe: While the euro could see short-term gains, its long-term strength depends on the eurozone’s ability to address its economic challenges. Structural issues in major economies like Germany and Italy could cap the euro’s upside.
Upcoming important news: EUR & USD Interest rate decision, FOMC Meeting and PCE.
Weekly Chart Analysis
1️⃣
🔹Swing Bearish
🔹Internal Bearish
🔹In Swing Discount
🔹Swing Continuation Phase (Pro Swing + Pro Internal)
2️⃣
🔹INT structure continuing bearish with iBOS following the Bearish Swing. (End of 2023 till end of 2024 was a pullback phase after the first bearish iBOS)
3️⃣
🔹After the bearish iBOS we expect a pullback, price tapped into liquidity below Nov 2022 which is above the weekly demand formed with the initiation of the bearish iBOS pullback phase.
🔹Price made a bullish CHoCH which indicates that the liquidity was enough as per previous week analysis to initiate a pullback phase for the bearish iBOS.
🔹Price currently looking to target the liquidity built up during September 2024 and maybe reaching the Weekly supply zone (In INT structure Premium).
🔹Expectations of price to continue bullish to sweep the liquidity/mitigate supply zone while putting in consideration that we can have a pullback after the bullish CHoCH to weekly newly demand formed.
Daily Chart Analysis
1️⃣
🔹Swing Bearish
🔹INT Bearish
🔹Swing Continuation Phase (Pro Swing + Pro Internal)
2️⃣
🔹Following the Bearish Swing BOS, INT Structure continuing bearish approaching the weekly demand zone.
3️⃣
🔹After the failure to close below the Weak INT Low, price continued bullish sweeping the liquidity above Dec 30 and currently mitigating a Daily supply zone within the INT Structure Premium Zone.
🔹The current Daily supply zone could provide an intraday pullback to daily demand formed to continue bullish and target the INT High as this is the weekly liquidity currently to be targeted. Also, I put in consideration that the structure is bearish and we should be continuing down to target the Weak INT low. But I want to see more development on LTF to confirm this scenario.
🔹Expectations is set to continue bullish with cautious on the bearish scenario.
4H Chart Analysis
1️⃣
🔹Swing Bullish
🔹INT Bullish
🔹Swing Continuation after BOS
2️⃣
🔹INT structure continuing bullish after the bullish BOS. We expect that at anytime the Swing Pullback will start.
🔹Currently price at a Daily Supply Zone that can initiate at least INT Structure Pullback and may extend to Swing Pullback to at least Swing EQ (50%)/Daily and Weekly Demand.
3️⃣
🔹Expectation is price to initiate a pullback for the Bullish INT structure and then continue bullish from demand to target the Daily INT High/Weekly Liquidity.
🔹More development required on LTFs/Intraday Analysis.
Economic Events for the Week

EURUSD 20-24 Jan 2025 W4 - Weekly AnalysisThis is my Weekly analysis on EURUSD for 20-24 Jan 2025 W4 based on Smart Money Concept (SMC) which includes the following:
Market Sentiment Weekly Chart AnalysisDaily Chart Analysis4H Chart AnalysisEconomic Events for the Week
Market Sentiment
Interest Rate Differentials: The widening gap between US and Eurozone interest rates favors the USD. Higher US yields attract capital flows, supporting the USD against the euro.
Inflation Trends: While inflation in the Eurozone remains subdued, the US continues to grapple with sticky inflation, keeping the Fed cautious about easing policy. This divergence further supports the USD.
Energy Prices: Elevated energy prices, driven by geopolitical tensions or supply disruptions, could weigh on the Eurozone’s trade balance and economic growth, adding pressure to the euro.
Weekly Chart Analysis
1️⃣
🔹Swing Bearish
🔹Internal Bearish
🔹In Swing Discount
🔹Swing Continuation Phase (Pro Swing + Pro Internal)
2️⃣
🔹INT structure continuing bearish with iBOS following the Bearish Swing. (End of 2023 till end of 2024 was a pullback phase after the first bearish iBOS)
3️⃣
🔹After the bearish iBOS we expect a pullback, price tapped into liquidity below Nov 2022 which is above the weekly demand formed with the initiation of the bearish iBOS pullback phase.
🔹Expectations is for price to start a pullback phase from the Weekly demand zone / or from the liquidity sweep from the Nov 2022 low (Require Daily/4H confirmation).
Daily Chart Analysis
1️⃣
🔹Swing Bearish
🔹INT Bearish
🔹Swing Continuation Phase (Pro Swing + Pro Internal)
2️⃣
🔹Following the Bearish Swing BOS, INT Structure continuing bearish approaching the weekly demand zone.
3️⃣
🔹After the receint iBOS, price pulled back to EQ (50%) of the INT Structure but currently failed to create a new iBOS with a Bullish CHoCH forming a new Demand.
🔹Expectations is not clear as we could start a deep pullback to intiate the Weekly Pullback Phase required or the current failure to creare a new Bearish iBOS is just a pause in market for more bearish move to at least the Weekly Demand. More development required from LTFs.
4H Chart Analysis
1️⃣
🔹Swing Bearish
🔹Swing Continuation Phase (Pro Swing + Pro Fractal)
2️⃣
🔹After the Bearish BOS, price pulled back to the Swing EQ (50%) tapping into a Daily and a 4H Supply that caused a Bearish CHoCH and forming a Supply that price is contained within it.
3️⃣
🔹Price is currently ranging between Supply and Demand which clearly makes price indecisively have a clear direction. More developments required on LTFs to have a clear expectation.
Economic Events for the Week

Tesla’s Golden Zone Bounce: Are We Heading to $460?Tesla has shown remarkable price action after sweeping the sell-side liquidity on the monthly chart at $152.49. Price tapped into the Golden Zone (OTE) and closed strongly above the sell-side level. This confluence, combined with robust candle closures, signals potential upside momentum.
Key Levels to Watch:
Immediate Target:
Price is aiming for the $460 range, marking a full swing move.
Retracement Zone:
If a retracement occurs, look for a pullback into the High-Probability Fair Value Gap (FVG) near $300.61. This zone could act as a strong support for another leg upward.
Conclusion:
Short-term: Price targets $460.
Medium-term: Watch for retracement into $300.61 before further upside potential.
DYOR (Do Your Own Research)!

NZD/USD Insight: High-Probability Targets for the Week AheadAnalysis:
From the HTF Weekly Chart, NZD/USD highlights critical price action after a long-term sell-side liquidity raid at the equal lows. A recent bullish candle close above the last down candle and the swept lows suggests potential upward momentum, confirming a likely retracement or continuation higher.
Key Levels to Watch:
Immediate Target:
- Buyside liquidity at 0.60364 (minimum target).
Potential Reversal Zones:
- Bearish breaker at 0.61600, reinforced by a Fair Value Gap (FVG) at 0.61077, making this
breaker a high-probability resistance zone.
Downside Potential:
- If price reacts at the bearish breaker, anticipate a move lower targeting sell-side liquidity at
0.57720, which aligns with the higher timeframe structure.
Price dynamics will heavily depend on how price reacts to intermediate levels, particularly the bearish breaker and its confluence with the FVG.
Conclusion:
- Short-term: Expect price to reach 0.60364.
- Medium-term: A reaction at 0.61600 could lead to a reversal targeting 0.57720.
- Always trade with confirmation at these key zones.

DXY: High-Probability Retracement SetupThe DXY has been forming higher highs, signaling bullish momentum. Currently, the market appears to be making a short-term retracement into a daily bullish order block (OB) at 105.174, which aligns with a high-probability setup, further supported by a fair value gap (FVG) just above it.
Confirmation of this retracement transitioning into expansion will occur if a daily candle taps into the OB and closes above the PD array. If this scenario unfolds, the next target is the buy-side liquidity (BSL) at 108.060, marking a significant level for potential upside momentum.
Keep an eye on the daily closures for validation, and always align entries with confluences for optimal risk management.

Intraday Shorts to HTF longsCaught intraday shorts on NY open to lower prices.
Because we're overall bullish on the HTF we could possibly see prices go lower.
However, we have to note that price has yet to mitigate and fill imbalances from the initial bearish move from last week's close.
Plenty of intraday opportunities to get into a HTF swing in the coming days.

BTC 4 Seasons CycleWhat I came up with is that in the bullphase Bitcoin tops out in Winter/Spring 🟦/🟩
Last cycle we had a double top but you would only miss out on 4-8% while saving yourself the headache of a 50% drop in summer 🟥
In the bearphase we bottom usually in Fall/Winter 🟧/🟦
I dont know how people can call for 48-55k or something else it would take us another year then until Winter to get back up and top out and to drop in 4-6 Months in Summer to the bottom its not usual for Bitcoin to do that.
It takes Bitcoin around 350 to 400 Days to hit the bottom you can see it in the picture below

PANI - POWER PLAYPosition Update: October 16, 2024
Key factors:
1. Low-risk entry point.
2. The stock offers two entry points with a very tight risk.
3. A power play on top of another power play, this is a strong sign of continuation of upward momentum.
4. Corrects 18% during this pause, indicating big institutions' reluctance to sell their positions.
5. High relative strength, outperforming the general market.
5. The stock is moving on its own universe and marching to its own drummer.
6. Volume diminishes during pauses, indicating less supply coming to the market.
7. The general market is in the early stages of a bull campaign.
Consideration: Breakouts are not accompanied by substantial volume.
This is a classic Power Play setup, featuring two viable entry points: a low cheat and the handle. My initial position was taken on October 11 from the low cheat. I’m looking forward to seeing further constructive price action moving forward.

PTRO - POWER PLAYPosition Update: October 22, 2024
Key factors:
1. Low-risk entry point.
2. The pause formed a small cup and handle.
3. It surged over 100% within eight weeks.
4. Corrects only 15% during on the pause, indicating big institutions' reluctance to sell their positions.
5. High relative strength, outperforming the general market.
5. The stock is moving on its own universe and marching to its own drummer.
6. Volume diminishes during pauses, indicating less supply coming to the market.
7. The general market is in the early stages of a bull campaign.
8. Huge volume on the breakout.
Consideration: Despite a favorable technical setup, risk should be managed diligently given the stock's sharp ascent and potential for profit-taking. Establishing stop-loss levels and monitoring market conditions is essential.
This is a textbook Power Play setup. I’m looking forward to seeing further constructive price action moving forward.

SMDM - POWER PLAYI have my position today
September 9, 2024
The reasons:
1. Low-risk pivot point
2. The stock offers a very tight entry in a power play setup
3. It surged over 250% in less than eight weeks
4. Corrects only 8% during this pause, indicating big institutions unwilling to sell their positions
4. High relative strength, outperforming the general market
5. The stock is moving on its own universe and marching to its own drummer
6. Volume dries up during the pause
7. The general market is in its bull campaign
Flaw:
1. Squats below breakout level on the closing
2. No real volume on breakout
It is a textbook Power Play setup, outstanding prior moves with very little sell-off on its correction. I like to see if it can hold up and reset its pivot area for another proper entry.

Bitcoin’s Next Move: Bullish Momentum Building Toward 67,000 USDThe price has reacted to a higher-timeframe Order Block after completing a PO3 cycle, and has also completed an MMSM cycle. Currently, it's forming an MMBM. The target is set for prices above 67,000 USD.

FET/USDT 15mNYSE:FET is one of the leading AI projects in the crypto space, earlier this year it saw a meteoric rise in price up to $3.5. Since then price has dropped around 80% to a local low of $0.70, now recently price has grown and broken the daily downtrend rising to a local high of $1.44 +105% from the lows creating a dilemma for traders...
From previous price action we know that NYSE:FET is capable of huge moves, it's a fundamentally sound project with a strong narrative behind it. Finding a good entry to buy FET if sidelined or add to a position if already positioned can be tricky so these are my thoughts:
- HTF FET has broken the daily downtrend is is looking to reverse. Altcoins have been at the mercy of Bitcoin so it requires BTC to behave too. After an -80% correction a lot of the downside risk has already played out.
- LTF we have seen a strong recovery, if you has bought local lows at $0.70 you would have outperformed the entire drawdown of the last 6 months (assuming equal position size). So the feeling of FOMO can start to creep in at these levels.
- The chart shows potential points of entry on the LTF, obviously we may continue to drawdown, it's always a possibility but we have seen signs of strength and therefore opportunities to go LONG.
- Local range low @ $1.273 is the option with the best return out of the 3. Clearly strong support that was the base for the last local rally.
- Current level is an interesting one because it incorporates a LTF diagonal resistance trendline that would be bullish if broken. This combined with a range support line (0.25) could be a good option for a LTF entry.
- The final option is the 0.5/ Midpoint entry. This would mean flipping the 15m 200EMA bullish and reclaiming the midpoint making it the safest of the 3 entries but least rewarding, offering +6% return instead of 9% & 13% respectively.
With all this in consideration, NYSE:FET is one of the better altcoin options in the markets current state. IMO we still don't have a clear market direction just yet and so being nimble with positions is a must, but it does feel like the worst is over and if that is the case then a position in FET could be positive for a portfolio.
