Hyperliquid Correction Exposed, $16.6-$22.5 Range To Be TestedAfter a strong rise there is always a strong correction and I will call this normal market behavior.
Hyperliquid entered the TOP20 altcoins by market capitalization and now sits at #11. Amazing feat.
In a matter of 65 days, between 7-April and 11-June, HYPEUSDT grew a very nice 373%.
A correction can take prices back below the 0.618-0.786 Fib. retracement support range. Which means between $16.7 and $22.5.
As usual, after the bearish wave is over, we can expect a new wave of growth. This one should unravel fast.
Thank you for reading and for your continued support.
Additional details can be found on the chart.
Namaste.
Hype

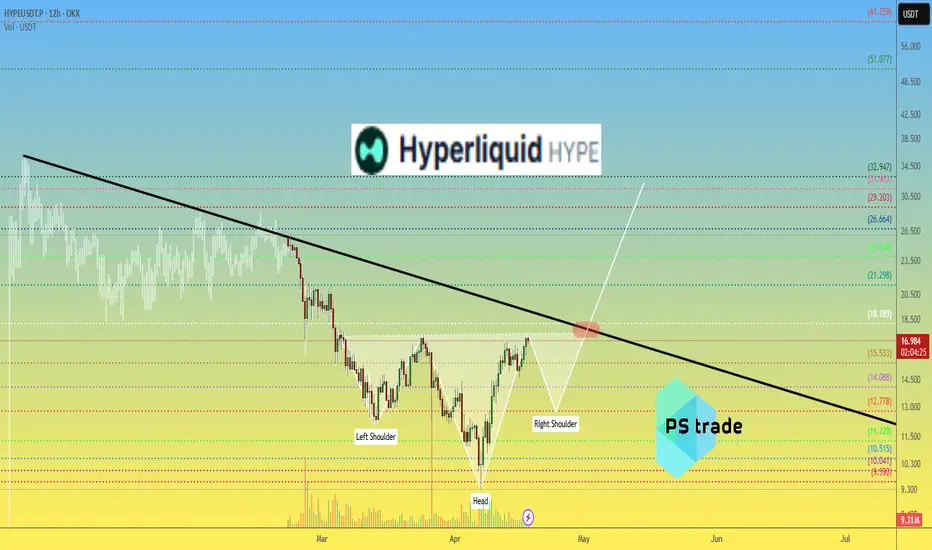
Hyperliquid HYPE price analysis🧐 This idea regarding the price of #HYPE is based more on our "intuition", as the project's tokenomics are excellent:
there will be no major coin unlocks this year, and 97% of the commission income of the #hyperliquid exchange will be directed towards the repurchase of its own token.
🤖 We previously managed to “predict” the growth of the #HypeUSDT price, so maybe our forecast will come true again) 👇
❗️ But this is by no means a call to shorts!
This idea is more about the opportunity to buy #Hype for $22-23 for your investment portfolio.
_____________________
Did you like our analysis? Leave a comment, like, and follow to get more

HYPE/USDT – Symmetrical Triangle BreakoutHYPE/USDT – Symmetrical Triangle Breakout
HYPEUSDT has broken out of a symmetrical triangle pattern, which often signals a strong upcoming move. If the breakout holds above the structure with consistent volume, we could see a continuation toward higher targets.
Symmetrical triangles are neutral patterns, but a breakout to the upside usually indicates bullish momentum building up.
Key levels to monitor:
– Breakout confirmation zone
– Immediate resistance above
– Retest of the triangle (if it happens)
Keep an eye on it — if HYPE sustains above the breakout level, a solid upward move may follow.

HYPE Precision Trading — Pattern, Patience, ProfitHYPE has shown strong performance since early April, maintaining a clear uptrend. Currently, the market is consolidating in a range between $30 and $40 and it’s setting up for something interesting. Let’s break it down and map the next high-probability trade setup.
Potential Gartley Harmonic Pattern Forming
A valid Gartley pattern may be developing, with point D potentially forming around the $29 level. This zone offers solid confluence for a high-probability long setup.
🟢 Long Setup – Gartley Harmonic Pattern Completion at around $29
Confluences around $29–$28.3:
0.786 Fib retracement of XA
Trend-based Fib Extension 1:1
Negative -0.618 Fib as take-profit level for prior short
Anchored VWAP (0.666 band multiplier) acting as dynamic support
200/233 EMA/SMA support on the 4H TF
FVG + liquidity pool resting just below $30
Setup Details:
Entry Zone: Trend-based Fib Extension 1:1 or laddered between $30–$28.3
Stop Loss: Below $27.5 (adjust depending on where point D forms)
Target: 0.618 of CD leg ≈ $34.4
R:R ≈ 1:3.5
🔴 Short Setup – look for rejection at $36
0.618 Fib retracement from previous move (ideal short entry)
Invalidation: Break above $38.2 (above point C)
Take Profit: $30-$29
R:R ≈ 1:3
🧠 Educational Insight:
Harmonic patterns offer precise entries and targets by aligning Fibonacci levels with market structure. When combined with tools like Anchored VWAP and liquidity analysis, they become powerful tools for swing trading.
Summary:
HYPE continues to respect structure beautifully, offering repeated swing setups in the 10%–20% range. With clear fib symmetry and predictable behaviour, it remains one of the more technically sound altcoins.
Stay patient. Wait for the pattern to complete. As always — don’t chase. Let the trade come to you.
_________________________________
If you found this helpful, leave a like and comment below! Got requests for the next technical analysis? Let me know.

$HYPE - Short-term OutlookKUCOIN:HYPEUSDT | 4h
Price already retested the supply zone at $38
Local support is around $32, however, not sure if we'll get a bounce at this level.
If CRYPTOCAP:BTC sweeps the 100k-99k lows, KUCOIN:HYPEUSDT could revisit $30–27 range

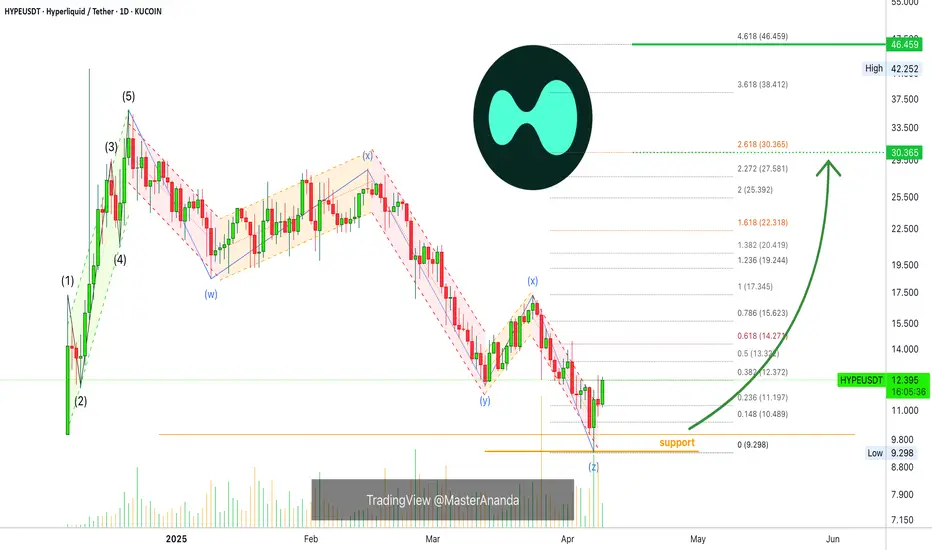
Hyperliquid: Your Altcoin ChoiceLow volume lower low and high volume reversal candle.
Here we do not have six months of data but the chart looks pretty clear. It is simple to read.
I can spot two perfect 5-waves pattern, one going down and another one going up.
Going down is the second one, the correction, and the session that hit a new bottom ended up as a higher low based on the close. That is, the low in December 2024 is $10. The low 7-April is $9.3 but the close happened at $11.5. ($11.5 higher than $10 ).
This can be a bullish signal.
Today's candle trades higher than the 13-March low. A full green candle.
After going down, the market tends to reverse and go up. The action is bullish on the short-term and this is a short-term chart.
Hyperliquid is good as long as it trades above support.
"Support" is clearly depicted orange on the chart.
I used this chart setup to open a short-term based trade.
The main targets are 145% & 270% as shown on the chart.
Thank you for reading and for your continued support.
You are appreciated.
Namaste.
Check if it can hold the price above 26.37
Hello, traders.
If you "Follow", you can always get new information quickly.
Have a nice day today.
-------------------------------------
Hyperliquid token is a decentralized exchange token.
It forms the Hyperliquid Ecosystem.
To see if Hyperliquid can survive in the coin market in the future, we will have to see if the ecosystem expands.
---------------------------------------------
(HYPEUSDT 1D chart)
We need to see if the price can be maintained by rising above the Fibonacci ratio 1 (35.51).
If so, the next target range is expected to be around the Fibonacci ratio 1.618 (51.70).
-
The HA-High indicator on the 1D chart is formed at the 26.37 point.
Therefore, if it falls, we need to check if it is supported near the HA-High indicator on the 1D chart.
The current volume profile section is formed over the 19.59-23.19 section.
Therefore, if it falls to the maximum, it is expected that the 19.59-23.19 section will act as a strong support.
-
(30m chart)
Since the chart was created not long ago, it is difficult to analyze the chart over a long period of time.
Therefore, when trading these coins (tokens), it is recommended to trade mainly in short-term trading (day trading) or increase the number of coins (tokens) corresponding to the profit by increasing the number of coins (tokens).
-
The basic trading strategy is to buy when it receives support near the HA-Low indicator and sell when it meets the HA-High indicator.
However, if it is supported and rises near the HA-High indicator, there is a possibility of a stepwise upward trend, so you should think about how to proceed with a split transaction.
If it is resisted and falls near the HA-Low indicator, there is a possibility of a stepwise downward trend, so you should also think about a response plan for this.
-
In any case, you can see that it must rise above 33.89 to continue the upward trend.
Therefore, the key is whether it can rise with support near 33.17-33.89.
Currently, OBV > OBV EMA, so when it rises above the High Line, you should check whether it can maintain the price by rising above the 33.17-33.89 range.
-
Thank you for reading to the end.
I hope you have a successful transaction.
--------------------------------------------------
- This is an explanation of the big picture.
(3-year bull market, 1-year bear market pattern)
(3-year bull market, 1-year bear market pattern)
I will explain more details when the bear market starts.
------------------------------------------------------

HYPEUSDT relevant support zonesDo not have much to say about it.
This is trending very well.
Supports are marked on the chart. As it lands on a support, it provides a long trade opportunity.
The lower the support zone on the chart, the price hits, stronger bounce and higher probability for a long trade it presents.
I will load heavy on spot if it hits any of the weekly support, specially WS2 in future.

$HYPE - Key SupportKUCOIN:HYPEUSDT | 1D
Price has swept the high and is now entering price discovery.
The key zone to watch now is the $27–$30 range — previously a resistance cluster.
A successful support flip of $27–$30 would confirm strength and likely open up upside targets to $50-$54

Hyperliquid (HYPE) Structural Breakout: Target $60+ HYPE just broke out from a major downtrend on the weekly chart and it’s looking strong.
I’m targeting $60 as a realistic level this year, and there’s a good chance HYPE makes it into the T op 10 crypto market cap if this momentum holds.
Here’s why I’m bullish:
Price broke out of the falling channel and closed above $25 weekly resistance.
Strong buying volume shows big players are stepping in, especially after that accumulation zone between $9 and $18.
Based on Fib extension, $60 lines up perfectly as the next major target and a psychological resistance level.
The Hyperliquid narrative is strong. Positioned as a real on-chain CEX alternative with solid user growth and rising TVL.
My trade setup:
Entry around $20 to $26.
First target at $37.5, final target at $60.
Stop loss if price closes below $18 weekly (that would kill the bullish case for me).
This isn’t financial advice , just sharing how I’m seeing the market.
Always manage your risk and don’t FOMO in at the top.

$HYPE: The Return of the King or Another FakeoutThe $HYPE/USDT chart just broke through key resistance levels with a massive green thrust, pushing past $21.89 and rocketing above $25.50 — levels we haven’t seen since February.
Here’s why this breakout matters:
✅ Reversal Confirmation:
We’ve been in a textbook downtrend from February through early April, but notice the clean series of higher lows and higher highs building over the past month. This isn’t just a bounce — it’s a structural trend shift.
✅ Dynamic Resistance Flipped:
Both the $21.89 and $17.43 dynamic resistances (marked on the chart) were cleanly smashed and are now acting as support. This flip is crucial because it shows buyers aren’t just testing — they’re claiming territory.
✅ Volume and Candle Strength:
Look at the size of those recent green bars: big-bodied candles, minimal wicks, aggressive closes. That’s momentum money stepping in.
✅ Sentiment Surge:
The ticker is literally called GETTEX:HYPE , but this is real hype — we’re watching the market front-run the rest of retail, setting up for a potential FOMO wave once we breach $27–$28 (Yearly High region).
But Here’s the Caution:
⚠️ We’re entering a high-liquidity hunting zone between $25.50 and $28. This is where algorithms often bait breakout traders, whip back, and refill lower.

TradeCityPro | HYPE: Bullish Momentum Builds Near Resistance👋 Welcome to TradeCity Pro!
In this analysis, I’m going to review the HYPE coin for you. The Hyperliquid project is one of the DEX projects in the crypto space that also functions as a Derivatives platform, and it currently holds the highest 24-hour volume among all DEXs.
🔍 The token for this project, with the symbol HYPE, has a market cap of $7.23 billion and is ranked 20th on CoinMarketCap.
⏳ 4-Hour Timeframe
In the 4-hour timeframe, as you can see, this coin is in an uptrend with an ascending trendline, and it’s currently encountering resistance at 21.48.
📈 If the price stabilizes above this zone, a new bullish wave can begin, with the next resistance being at 22.799.
✔️ You can enter a long position using the 21.48 breakout trigger. Buying volume has increased significantly, which raises the chances of this level breaking.
📊 For short positions and a potential bearish trend in this coin, the first trigger would be a rejection from the 21.48 resistance. If the price gets rejected at this level, the likelihood of breaking the trendline increases.
⭐ A break of the trendline itself can also serve as a trigger. Breaking this trendline would eliminate bullish momentum in the market, and a breakdown below the 39.29 level on the RSI would further support bearish momentum.
🔽 The main short position can be opened upon breaking the 19.552 level. This is a very strong support, and if the price closes below it, it could drop further to 17.88.
👀 Overall, the long setup on this coin looks quite logical, and if the 4-hour candle closes as is and doesn’t turn out to be a fakeout, it could be a great entry opportunity.
📝 Final Thoughts
This analysis reflects our opinions and is not financial advice.
Share your thoughts in the comments, and don’t forget to share this analysis with your friends! ❤️

$Hype to new lows? GETTEX:HYPE looks like it's forming a double top here below key resistances.
If we end up falling lower here, and get to the bottom of the channel, I think that price is likely to break down from the channel and hit one of the lower supports before we start the next bullish move.
Let's see how it plays out over the coming weeks.

We see greater potential in AlgorandWe see greater potential in Algorand, but we can't say with certainty that it will rise during this bull run. I believe the projects behind Algorand have a strong impact and could trigger significant hype. We're approaching a breakout point that could lead to another move upward. If we break through the $0.47 level, we would turn bullish and could expect the beginning of a hype cycle.

Hyperliquid HYPE price analysisLooking at the OKX:HYPEUSDT.P chart, we can assume that the cryptocurrency market is likely to start #Hype's in May.
🔼 The capitalization of the #Hyperliquid project is already quite large in the current realities - $5.6 billion, so the forecast for x2 growth is quite optimistic-realistic.
And so, all the key levels are on the chart!)
🥚 Have a nice Easter holiday
_____________________
Did you like our analysis? Leave a comment, like, and follow to get more
Hyperliquid Surged 12% Today Gearing For Another Leg-upThe price of Hyperliquid surged 12% today amidst the general crypto market dip. According to data from Lookonchain monitoring, about 2 hours ago, a whale deposited 6 million CRYPTOCAP:USDC into Hyperliquid and went long on CRYPTOCAP:ETH at a price of $1,624.44 with a 5x leverage.
This data signifies a growing interest in the Hyper liquid Dex. Similarly, data from Defilama shows about $277.3 million locked in Total Value Locked (TVL) in the Hyperliquid ecosystem and this is for a project that is just 5 months from token lunch.
With the Resistant and support point already marked, should GETTEX:HYPE coin break above the $17 resistant zone, the $20 pivot will be feasible. However, failure to break above the resistant point could resort to a selling spree to the $9 support resorting to the break below the Moving averages respectively as that is the only nearest possible support point for $HYPE.
What is Hyperliquid?
Hyperliquid represents a cutting-edge blockchain platform, specifically designed to enhance the efficiency and performance of decentralized finance (DeFi) applications. At its core, Hyperliquid introduces a novel Layer 1 (L1) blockchain that is meticulously engineered from the ground up to optimize performance and scalability.
Hyperliquid Price Data
The Hyperliquid price today is $15.97 USD with a 24-hour trading volume of $141,575,547 USD. Hyperliquid is up 1.87% in the last 24 hours. The current CoinMarketCap ranking is #23, with a live market cap of $5,333,694,243 USD. It has a circulating supply of 333,928,180 HYPE coins and a max. supply of 1,000,000,000 HYPE coins.

Will This Descending Wedge Push HYPE to 22.5?If we take a closer look at the price structure, the orange and blue arrows show that BITGET:HYPEUSDT is in an overall uptrend. Meanwhile, the white arrow represents a minor pullback—just a ripple within the bigger trend.
When we connect the orange to the white, and then the white to the blue arrow, we can spot a descending broadening wedge formation. Given the current bullish structure, this pattern is more likely acting as a continuation rather than a reversal.
After the pattern is completed, the key level to watch is the resistance around 16.62, which comes from the white arrow's high. This level will decide whether price can break through and continue its bullish momentum toward the target zone at 20.52 – 22.55, or if sellers will step in and cause a rejection.
In case of a rejection, we might see some sideways movement as the market consolidates before making the next move.

HYPERLIQUID LIQUIDATION SYSTEM EXPLOITED#HYPE is facing price declines following rumours of a malicious actor siphoning funds from the pool and taking advantage of the liquidation process.
While decentralised finance offers incredible opportunities, the actions of a single individual can lead to significant losses as investors pull their capital.
Let's hope Hyperliquid can enhance their security measures to prevent such incidents in the future.
$HYPE Long Trade IdeaIt’s worth noting that certain alts are showing resilience. It’s likely that some alts, such as HYPE, won’t fall below their previous lows
Scaling into long here at cmp $12, with stop just below $9.80
Targets:
tp1 - $14.5
tp2 - $17.8
tp3 - $20.3

Hyperliquid is in a downtrend looking for a bottom. HYPE is still in a downtrend and despite the recent events and FUD the price didn't make a lower low. This doesn't mean it can't but it should be a sign of strength at this level. A proper choch would confirm a change in the direction of the trend. Watch list material.
Full TA: Link in the BIO

HypeusdSuperior dex thesis remains valid
Hlp fud X2 now makes this a non consensus trade so it has a much higher likelyhood of playing out.
Dex perp volume still consuming a large amount of the cex perp volumes despite the fud and open attacks from centralised exchange. Clearly their relevance is feeling threatened by the new on chain hyper performance dex still by far the best place to trade in the market.
High volumes means high buybacks from assistance fund
Staking tiers go live April 30th and there's now spot btc and spot eth trading with the lowest fees in the market to support the bullish thesis.
Hlp attack was well handled with investors being protected and any other handling would have resulted in a bankrun given centralised exchanges were revenge listing jelly to push the manipulation squeeze higher.
Non consensus trade means there's much less long leveraged liquidity to drag the price down and some short liquidity to push the price into a bullish trend.
See how it plays out I guess..

Trading opportunity for HYPEUSDTBased on technical factors there is a Buy position in :
📊 HYPEUSDT
🔵 Buy Now
🪫Stop loss 11.400
🔋Target 16.750
📏 R/R 2
💸RISK : 1%
We hope it is profitable for you ❤️
Please support our activity with your likes👍 and comments📝

HYPE is still in a downtrend. Is it over?HYPE is still in a downtrend after the clear 3 waves down. The price is currently in dip discovery and the question is the downtrend over? A Choch will provide evidence of a possible reversal. Without it, the trend is your friend.
Full TA: Link in the BIO
