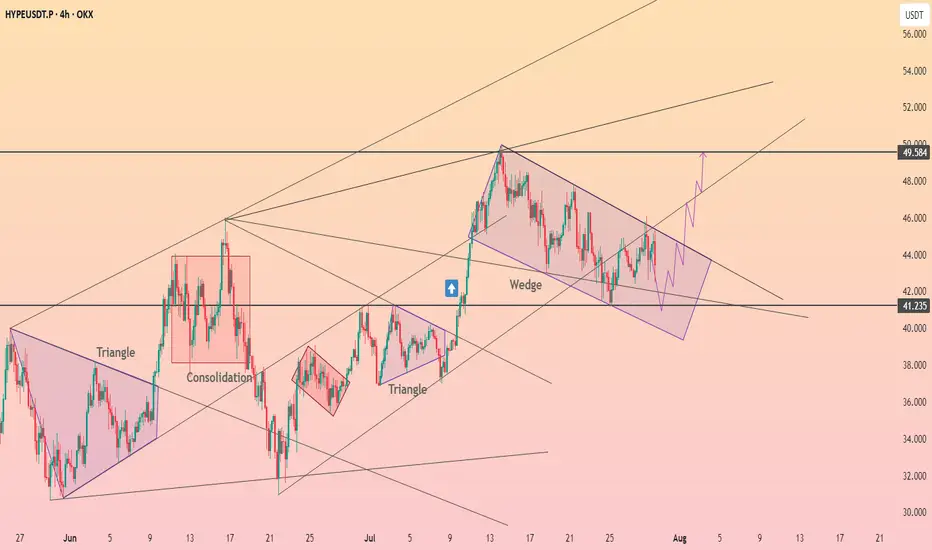
Hyperliquid reached the upper limit of the wedge ┆ HolderStat$BINANCE:HYPEUSDT is currently trading within a falling wedge after a sharp bullish move. Price is consolidating near key support around 41.2, showing signs of pressure building for a potential breakout. A clean break above the wedge resistance may open the path toward 49.5, aligning with the higher trend channel projection.
Hyperliquid
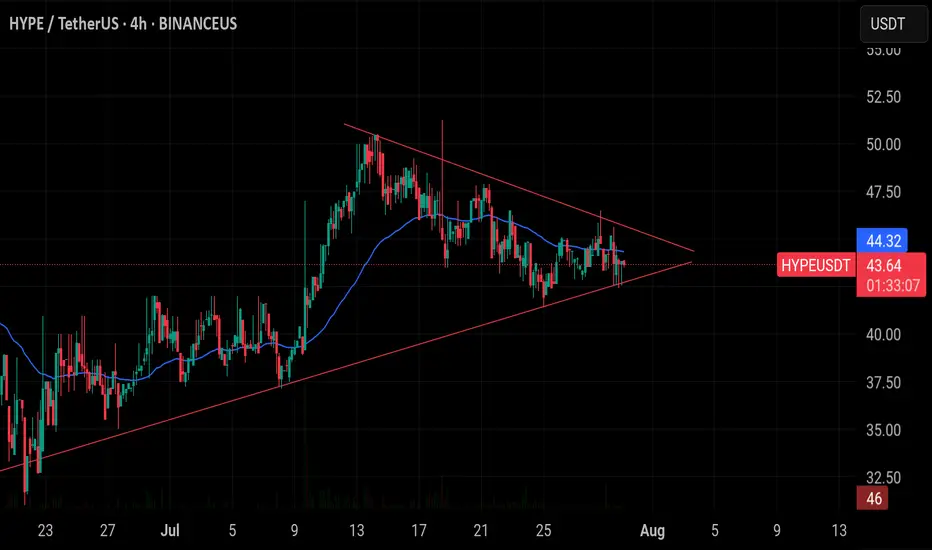
$HYPE/USDT is sitting at the edge of a triangle.$HYPE/USDT is sitting at the edge of a triangle. If it breaks above $44, it could jump to $52. But if it falls and close 4h candle below $42, the setup will fail.
Memecoin is risky but profitable...Hello friends🙌
Given the channel's failure on the weekly time frame, there is now a good opportunity to buy in the price reversal or price correction, of course, with capital and risk management.
🔥Follow us for more signals🔥
*Trade safely with us*

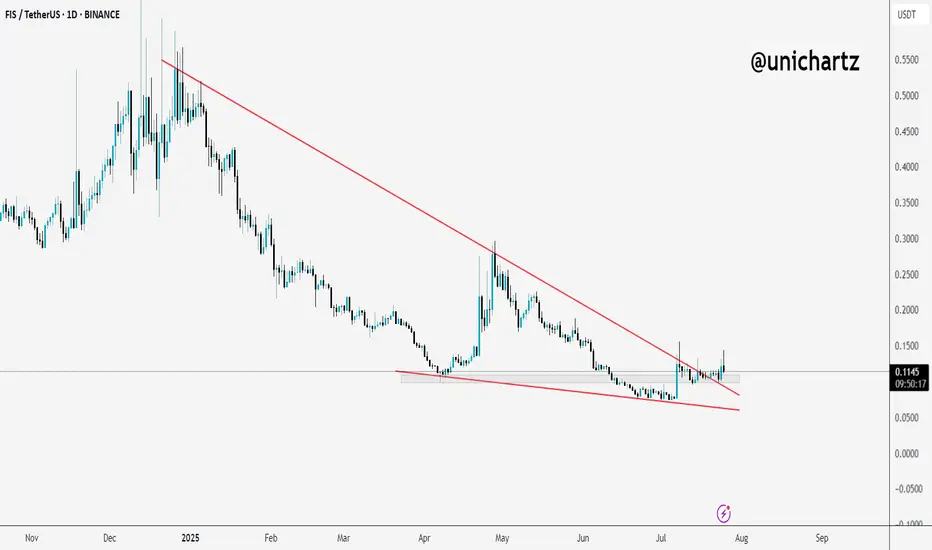
FIS Breaks Out of Falling Wedge – Reversal in Play?$FIS/USDT has finally broken out of a long-term falling wedge pattern, a structure that often signals reversal.
Price is now holding above the breakout zone, showing signs of strength.
As long as it stays above the wedge, we might see further upside in the coming days.
DYOR, NFA
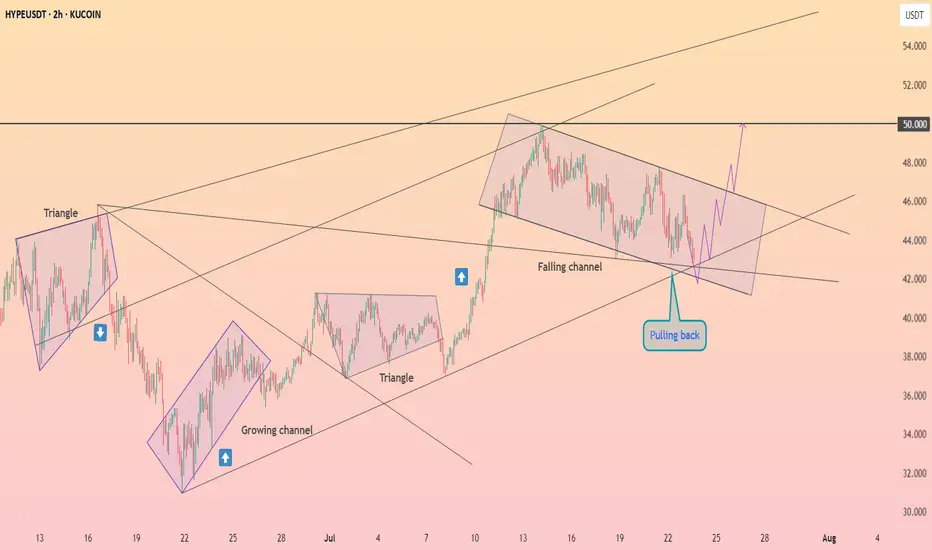
Hyperliquid is retesting the $44 level ┆ HolderStatKUCOIN:HYPEUSDT has flipped $0.074 into support. Holding this level could trigger a move to $0.088. Structure favors bulls.
Watch Hyperliquid Surge 18% to $46 Key Resistance LevelHello,✌
let’s dive into a full analysis of the upcoming price potential for Hyperliquid 🔍📈.
KUCOIN:HYPEUSDT is trading within a reliable daily ascending channel and is currently near its lower boundary, where a strong daily support zone has formed. This setup suggests a potential upside of at least 18%, with a target around $46 , which aligns closely with a key trendline. 📈
✨ Need a little love!
We pour love into every post your support keeps us inspired! 💛 Don’t be shy, we’d love to hear from you on comments. Big thanks , Mad Whale 🐋

Jul 20 | Crypto-market reviewNew Crypto-Sunday market review video, where I share my current analysis on the trend structures of BTC, ETH, SOL, XRP, HYPE and other alt- and mem-coins of interest to my, highlighting key support and resistance zones to watch in the coming sessions.
Charts featured in the video
BTC
ETH
XRP
(!) SOL
(!) HYPE
(!) TRUMP
BRETT
(!) FET
RENDER (Weekly)
(!) DOG
(!) MOG
Thank you for your attention and I wish you happy Sunday and great trading week!
If you’d like to hear my take on any other coin you’re tracking — feel free to ask in the comments (just don’t forget to boost the idea first 😉)

Real party starts when hype breaks out against btc pair Any meaningful crypto looking to enter top 10 territory will understandably be under the scope of some major btc whales . Since crypto assets for size buyers are carefully paired up against btc . The hype/btc chart should be the one that would catapult us into price discovery once we break agints btc. I anticipate large buyers to enter this trade

HolderStat┆HYPEUSD has consolidated above the trend line$OKX:HYPEUSDT surged after a breakout from a well-formed triangle and a bullish retest of prior resistance. The chart shows a textbook ascending channel with the price climbing from $38 toward the $56 upper range. If momentum remains, a breakout beyond the top boundary is likely.

HYPEUSDT KUCOIN:HYPEUSDT 4H Analysis Price has broken out above the 44.5 support zone and is holding strong 🚀. As long as this level holds, targets are set at 50.615 and 57.164 📈. If 44.5 breaks down, next support is seen at 40.433 🔻.
Key Levels:
✅ Support: 44.5
🟩 Targets: 50.615 → 57.164
🔴 Next support if breakdown: 40.433

HolderStat┆HYPEUSD back to the trend line$OKX:HYPEUSDT is breaking out of a triangle formation, continuing a sequence of bullish consolidation and triangle patterns. Price is targeting the upper channel line near 42.75, with the structure supporting continued upside momentum.

HolderStat┆HYPEUSD forming the triangleKUCOIN:HYPEUSDT has entered a narrowing triangle formation with a bullish trajectory, forming higher lows from the 33 USDT base. Price is nearing resistance around 40 USDT, and if breached, the pattern projects continuation toward the 43.5 USDT level.

$HYPEUSDT Trade Setup 4HKUCOIN:HYPEUSDT Trade
Entry: CMP
Stop Loss: $38.501
Target: $45.846, $56.845
Breakout from a triangle pattern with bullish MACD. Watch for retest entry.
DYOR, NFA.

HolderStat┆HYPEUSD above the $40 resistanceKUCOIN:HYPEUSDT has reclaimed $40 resistance and is now trending in a rising channel. Past triangle breakouts signal that $43–$45 could be next if the current momentum continues to build.

HYPE — How to Combine Fibonacci, VWAP and Market StructureAfter an explosive +392% rally in just 70 days — from $9.298 to a peak of $45.8 — HYPE has entered a consolidation range as expected. Structurally, this appears to be a 5-wave impulse now transitioning into a corrective ABC pattern. Based on current structure, we may now be forming wave B.
What’s Unfolding Now?
A potential Head & Shoulders pattern is developing, with price currently working on the right shoulder. The $40 mark stands out as a key resistance — both technically and psychologically:
0.618 Fibonacci retracement of the down move sits at $40.108
Structural resistance from prior highs
Ideal area for a short rejection
🎯 Short Setup:
Entry: Laddered short between 0.618 ($40.108) and 0.786 ($42.611)
Stop-Loss: Above $44 (after rejection adjust to entry)
Target: $28–$27 zone
R:R potential: 1:3 up to 1:9 depending on entry quality
📍 Why $28–$27 Is Key Support:
0.5 Fibonacci retracement of entire +392% rally sits at $27.549
Anchored VWAP from the rally origin ($9.298) aligns around this zone
Weekly & Monthly S/R convergence
VAH (Value Area High)
0.618 Fibonacci Speed Fan also aligns as dynamic support
Fair Value Gap (FVG) lies in this region
Weekly 21 EMA at $28.05/Weekly 21 SMA at $24.10 — both key moving averages providing layered support and trend structure
📐 Bonus Confluence Insight:
If this is indeed wave B, then projecting a 0.786/1.0 Trend-Based Fib Extension from wave A aligns well with the 0.5 fib retracement at $27.5.
📚 Educational Insight:
Stacking confluences such as Fibonacci retracements, anchored VWAPs, volume zones, EMA/SMA levels, and harmonic structures helps identify high-probability zones where smart money is likely to act. These levels become even more powerful when they align across multiple tools and timeframes. Always confirm with price action.
_________________________________
💬 If you found this helpful, drop a like and comment!
Want breakdowns of other charts? Leave your requests below.

HYPE/USDT Ready for a Breakout? Watch These Key LevelsAnalysis Description:
The HYPE/USDT pair is currently forming a descending triangle pattern on the 1D timeframe — a classic technical setup that often signals a strong upcoming price move, either upward or downward.
🔶 Strong Support Block:
The yellow horizontal zone between 33.500 – 36.785 USDT represents a solid support area where price has repeatedly bounced with strong volume. This zone is ideal for monitoring buy-back opportunities if price pulls back.
📉 Descending Resistance Line:
A descending trendline has been acting as dynamic resistance. A breakout above this line could trigger a significant bullish continuation.
🎯 Upside Targets (If Breakout Occurs):
Target 1: 38.800 USDT (minor resistance)
Target 2: 42.068 USDT (mid-range target)
Target 3: 45.800 USDT (major resistance / previous high)
📌 Trading Strategy:
Conservative Entry: Buy on support re-test within the 33.500 – 36.785 USDT zone.
Aggressive Entry: Buy after a confirmed daily breakout above the descending trendline.
Stop Loss: Below the support block, around 33.000 USDT.
💡 Additional Note:
Watch for increased volume during the breakout — this would validate the move and confirm strong momentum. If the breakout fails, expect further sideways consolidation within the current range.
#HYPE #HYPEUSDT #AltcoinBreakout #CryptoChart #TechnicalAnalysis #CryptoTrading #DescendingTriangle #BullishSetup #CryptoCommunity

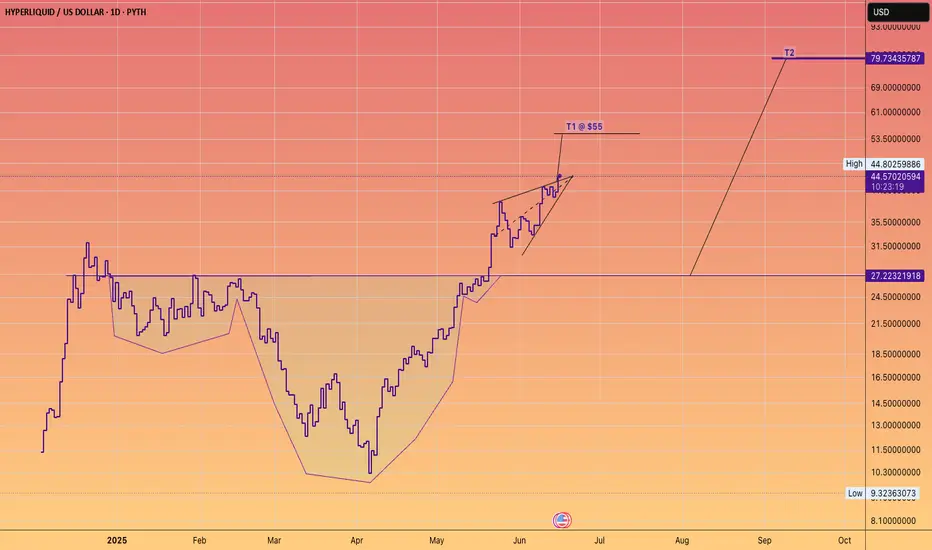
Hype's path to $55BYBIT:HYPEUSDT.P is currently forming a wedge shape pattern, is it indicating that it will break out and follow Path A, the blue path? I'm not so sure, I am sure we'll hit $55 either way.
If we take the red path, Path B, we'll come down to some heaviy support which could give us the fuel needed to get to $55
Out of all of the oscillators I was using, all except the chop zone on the daily mind you, were in bearish mode. So logically one would choose the red Path B right?
I can't wait to see how this plays out, shall we dip some and buy some more BYBIT:HYPEUSDT.P on Path B or experience more of a continuation of the current trendline to $55?
Let me know what you think in the comments, that'ls all for today, let's go HYPE!!! straight to $55!

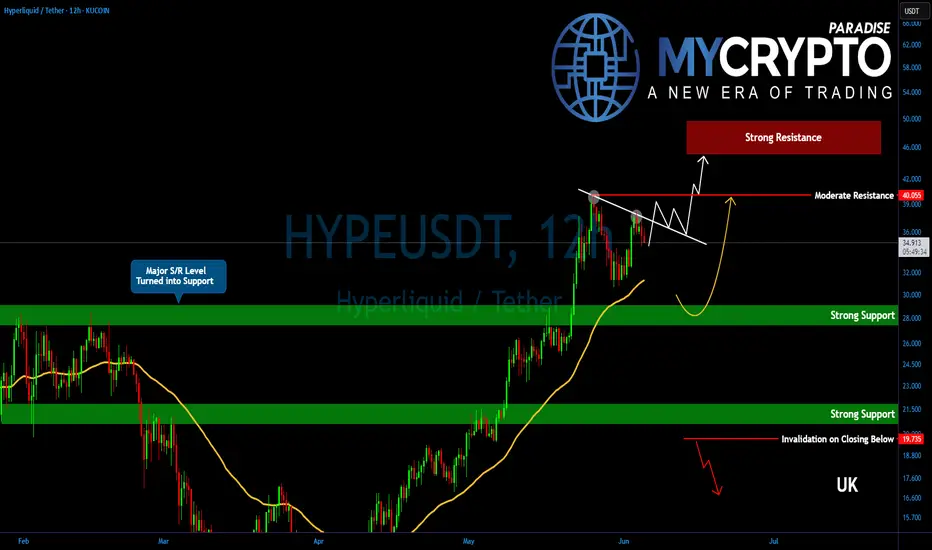
HYPE’s Triangle Is Tightening! Get Ready for What’s NextYello, Paradisers! Are you watching what #HYPE is doing while the rest of the market barely holds on? We've been talking about this for a while, some altcoins are setting up for their next big move, and HYPE just might be leading the pack.
💎While the broader crypto market remains in a corrective or consolidative phase, HYPE has quietly maintained strength, pushing above a critical support/resistance zone and now forming a converging triangle pattern, a classic setup for explosive movement.
💎#HYPEUSDT is in a sideways consolidation phase. Price action is calm on the surface, but what’s actually unfolding is a textbook build-up. The next move could be a retest of the EMA-50, which sits near the 31.480 level. That zone also aligns with a moderate support area, making it a solid demand zone for bulls to reload and re-accumulate.
💎Even if HYPE slides lower into the 30.00 to 28.00 strong support region, it wouldn’t damage the structure. In fact, such a move would shake out late longs and weak hands, further strengthening the overall foundation. A drop into that zone should not be seen as failure, but rather as a potential springboard for the next impulsive wave.
💎The key to watch remains the descending resistance at the 37.20 level. Once this is broken with volume and conviction, the price is likely to push toward 40.05—a moderate resistance. But don’t get it twisted. That’s not where the bulls are aiming to stop. The structure, momentum, and higher-timeframe alignment all suggest this isn’t the final destination. Bulls are likely targeting the $47–$50 range, an area that isn’t just technical, it’s psychological mark as well.
Paradisers, strive for consistency, not quick profits. Treat the market as a businessman, not as a gambler.
MyCryptoParadise
iFeel the success🌴
HYPE/USDT: Analyzing Major Buying Levels & Current RetracementPrice Action and Trend:
Since late 2024, HYPE/USDT has exhibited a volatile but generally upward-biased trend, particularly from April 2025 onwards. The initial period in late 2024 and early 2025 showed significant volatility with rapid pumps and dumps, characteristic of a nascent or highly speculative asset. A notable downtrend occurred from late February to mid-April 2025, reaching a low around the $12-$13 range. Following this, there's been a strong uptrend, with price breaking out of previous resistance levels and establishing new highs in May and June 2025, peaking near $40-$42. Currently, the price is undergoing a significant retracement from its recent highs.
Major Buying Levels (Yellow Zones):
The yellow zones on the chart clearly delineate significant demand (buying) levels:
Lowest Zone ($14.658 - $16.849) : This zone served as a strong accumulation area in late April and early May 2025. Price found substantial support here after the preceding downtrend, indicating a strong influx of buyers. This zone represents a foundational demand level where strong buying interest emerged, leading to the subsequent upward impulse.
Middle Zone ($22.303 - $25.927) : After the initial rally from the lowest zone, price consolidated and then retested this middle zone in late May 2025. The swift bounce from this area confirms its role as a significant demand zone, where buyers stepped in to prevent further declines and propel the price higher. This zone likely represents a point where early buyers took profits, and new demand entered, or previous buyers added to their positions.
Highest Zone ($30.596 - $34.316) : This most recent yellow zone became active in June 2025. After breaking through earlier resistance, price retraced into this area following its peak. The current price is hovering around the upper boundary of this zone ($34.316), indicating that buyers are attempting to defend this level. This zone signifies a crucial area where previous resistance may have flipped into support, attracting new buying interest. Its ability to hold will be critical for the continuation of the uptrend.
Supply Zones:
While not explicitly highlighted in yellow, several supply zones are evident where selling pressure intensified:
Around $27-$28 (Late 2024/Early 2025): Multiple wicks and rejections around this price range in late 2024 and early 2025 suggest a strong supply area. Price struggled to sustain above this level on several occasions, leading to pullbacks.
Around $30-$31 (Early 2025): Similar to the above, this area acted as resistance, causing price to reverse downwards after attempts to break higher.
The recent peak around $40-$42 (June 2025): This is the most significant recent supply zone. The sharp rejection from this area, marked by the long upper wick and subsequent bearish candles, indicates strong selling pressure at these elevated prices. This suggests profit-taking by earlier buyers and/or new shorting interest.
Current Price Position:
The current price of HYPE/USDT is approximately $34.345, which is at the upper boundary of the highest major buying level (yellow zone: $30.596 - $34.316). This indicates that the price has retraced significantly from its recent peak and is currently testing a crucial demand zone. The reaction at this level will be paramount in determining the immediate future direction.
Potential Future Scenarios:
Bullish Scenario: If the highest yellow zone ($30.596 - $34.316) holds as strong support, and buying pressure re-emerges, HYPE/USDT could consolidate within this zone before attempting another rally towards the recent highs ($40-$42) and potentially breaking above them. A strong bounce from this level would confirm renewed buyer confidence.
Bearish Scenario: If the current demand zone ($30.596 - $34.316) fails to hold, indicating a lack of buying interest at these levels, HYPE/USDT could see further downside. The next potential support levels would then be the middle yellow zone ($22.303 - $25.927). A break below the current zone would signal a shift in market sentiment and potentially the beginning of a deeper correction.
Key Observations:
Clear Demand Zone Effectiveness: The yellow zones have historically served as effective demand zones, leading to significant bounces and upward movements. This reinforces their importance as areas where institutional or significant retail buying has occurred.
Volatility and Wicks: The presence of long wicks (both upper and lower) indicates periods of significant price discovery and battle between buyers and sellers, especially around key levels.
Breakout and Retest Pattern: The price has shown a tendency to break out of resistance, then retest those levels (which often flip to support) before continuing its move, as seen with the middle yellow zone.
Recent Pullback: The current pullback from the highs around $40-$42 suggests profit-taking and the encounter of a strong supply zone. The ability of buyers to absorb this selling pressure at the current demand level will be a key determinant of future price action.
In summary, HYPE/USDT is at a critical juncture, testing a major buying level. The market's reaction to this demand zone will dictate whether the recent bullish momentum can be sustained or if a deeper correction is on the horizon.

Where Is The Real HypeThis latest crypto cycle has been the hardest to navigate for even the most experienced crypto traders. No real Altcoin season has transpired, maybe best reflected by the fact that over 2 years into it, Ethereum still has not seen a new All-Time-High. That is not to say that there have not been winners. Hyperliquid, the 'decentralized' perpetuals exchange has taken the market by storm. The word 'decentralized' is in inverted commas as the extent of decentralization for the platform is debatable but starting with UX and product first, and arguably bringing in decentralization later, has so far proven to be winning strategy. The performance of the project's native token HYPE has been one of the few bright lights in this market.
HYPE, the token, launched in what is an immaculate conception in crypto terms: no VCs who got in at better price levels, an airdrop that heavily rewarded the community, revenue-driven token buybacks. The project is a case-study on how to succeed in today's crypto world. Perpetuals trading is one of the core use-cases for crypto. Enabling perpetuals trading for jurisdictions where it is banned for retail via 'decentralization' is regulatory arbitrage at its best. Luckily, regulation-wise, the stars seem to have aligned. At the same time, crypto traders have been overwhelmed by large supplies of tokens dumped on the market at unfavorable terms for retail investors. Non-crypto retail on the other hand has been burned one too many times by mingling in our industry and has so far stayed out. Consequently, the vast majority of crypto tokens has simply not gone anywhere in this cycle so far.
Where non-crypto retail funds go becomes visible when looking at the performance of various stock indices, pennystocks and even crypto-related stocks including Microstrategy. Even despite economic uncertainty and war, stocks are at all-time highs. On the institutional side, funds and tradfi have been playing the crypto-leverage game via instruments they are familiar with. We have spoken about Michael Saylor's strategy of borrowing funds to buy more Bitcoin many times in this newsletter previously. Other companies have copied the Microstrategy playbook in increasing numbers. 151 publicly traded companies now hold Bitcoin.
Meanwhile, the less 'degen' side of tradfi has focused its attention on stablecoins. The so-called 'GENIUS' Act to regulate stablecoins has just passed the US Senate with bi-partisan support. The performance of Circle's stock after its recent IPO is the best example for the growing Tradfi excitement over Stablecoins. A 5x return in a little over a week may remind crypto traders of happier days. It is certainly not the norm in Tradfi world. Stripe, the Fintech giant, has been acquiring crypto infra players including Bridge and Privy. Shopify has enabled stablecoin payments. Adoption comes slowly, then all at once.
As the worlds of crypto and Tradfi continue to merge, opportunities for traders will continue to present themselves. We may be facing a quieter period in crypto markets right now. But the lessons of HYPE's immaculate conception are being studied by teams and founders around the industry. Inevitably, the possibilities of permission-less onchain finance will sooner or later lure back the traders. Until then, good luck looking for the next hype.

$HYPE Trade!!GETTEX:HYPE is testing the crucial support zone at $40.0–$40.5, right along the ascending trendline and 200 EMA on the hourly chart.
If this zone holds, we could see a rebound toward the $44.5–$46.0 resistance area.
However, a breakdown below $40.0 might trigger further downside toward the next major support at $38.0–$37.4.
Monitor closely—this zone will decide the next move.

Don't fight the HYPE train!The James Wynn saga was wonderful advertising for the platform.
(Maybe it was staged).
Either way #Hyperliquid goes higher.
Hyperliquid Correction Exposed, $16.6-$22.5 Range To Be TestedAfter a strong rise there is always a strong correction and I will call this normal market behavior.
Hyperliquid entered the TOP20 altcoins by market capitalization and now sits at #11. Amazing feat.
In a matter of 65 days, between 7-April and 11-June, HYPEUSDT grew a very nice 373%.
A correction can take prices back below the 0.618-0.786 Fib. retracement support range. Which means between $16.7 and $22.5.
As usual, after the bearish wave is over, we can expect a new wave of growth. This one should unravel fast.
Thank you for reading and for your continued support.
Additional details can be found on the chart.
Namaste.
