HYPE/USDT Ready for a Breakout? Watch These Key LevelsAnalysis Description:
The HYPE/USDT pair is currently forming a descending triangle pattern on the 1D timeframe — a classic technical setup that often signals a strong upcoming price move, either upward or downward.
🔶 Strong Support Block:
The yellow horizontal zone between 33.500 – 36.785 USDT represents a solid support area where price has repeatedly bounced with strong volume. This zone is ideal for monitoring buy-back opportunities if price pulls back.
📉 Descending Resistance Line:
A descending trendline has been acting as dynamic resistance. A breakout above this line could trigger a significant bullish continuation.
🎯 Upside Targets (If Breakout Occurs):
Target 1: 38.800 USDT (minor resistance)
Target 2: 42.068 USDT (mid-range target)
Target 3: 45.800 USDT (major resistance / previous high)
📌 Trading Strategy:
Conservative Entry: Buy on support re-test within the 33.500 – 36.785 USDT zone.
Aggressive Entry: Buy after a confirmed daily breakout above the descending trendline.
Stop Loss: Below the support block, around 33.000 USDT.
💡 Additional Note:
Watch for increased volume during the breakout — this would validate the move and confirm strong momentum. If the breakout fails, expect further sideways consolidation within the current range.
#HYPE #HYPEUSDT #AltcoinBreakout #CryptoChart #TechnicalAnalysis #CryptoTrading #DescendingTriangle #BullishSetup #CryptoCommunity
HYPEUSDC

HYPE’s Triangle Is Tightening! Get Ready for What’s NextYello, Paradisers! Are you watching what #HYPE is doing while the rest of the market barely holds on? We've been talking about this for a while, some altcoins are setting up for their next big move, and HYPE just might be leading the pack.
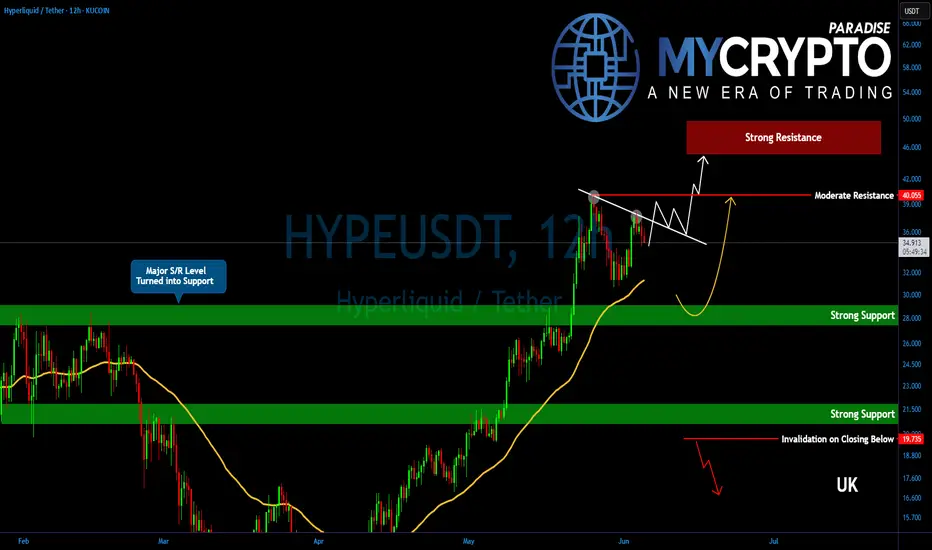
💎While the broader crypto market remains in a corrective or consolidative phase, HYPE has quietly maintained strength, pushing above a critical support/resistance zone and now forming a converging triangle pattern, a classic setup for explosive movement.
💎#HYPEUSDT is in a sideways consolidation phase. Price action is calm on the surface, but what’s actually unfolding is a textbook build-up. The next move could be a retest of the EMA-50, which sits near the 31.480 level. That zone also aligns with a moderate support area, making it a solid demand zone for bulls to reload and re-accumulate.
💎Even if HYPE slides lower into the 30.00 to 28.00 strong support region, it wouldn’t damage the structure. In fact, such a move would shake out late longs and weak hands, further strengthening the overall foundation. A drop into that zone should not be seen as failure, but rather as a potential springboard for the next impulsive wave.
💎The key to watch remains the descending resistance at the 37.20 level. Once this is broken with volume and conviction, the price is likely to push toward 40.05—a moderate resistance. But don’t get it twisted. That’s not where the bulls are aiming to stop. The structure, momentum, and higher-timeframe alignment all suggest this isn’t the final destination. Bulls are likely targeting the $47–$50 range, an area that isn’t just technical, it’s psychological mark as well.
Paradisers, strive for consistency, not quick profits. Treat the market as a businessman, not as a gambler.
MyCryptoParadise
iFeel the success🌴
Hyperliquid HYPE price analysis🧐 This idea regarding the price of #HYPE is based more on our "intuition", as the project's tokenomics are excellent:
there will be no major coin unlocks this year, and 97% of the commission income of the #hyperliquid exchange will be directed towards the repurchase of its own token.
🤖 We previously managed to “predict” the growth of the #HypeUSDT price, so maybe our forecast will come true again) 👇
❗️ But this is by no means a call to shorts!
This idea is more about the opportunity to buy #Hype for $22-23 for your investment portfolio.
_____________________
Did you like our analysis? Leave a comment, like, and follow to get more

HYPEUSDT relevant support zonesDo not have much to say about it.
This is trending very well.
Supports are marked on the chart. As it lands on a support, it provides a long trade opportunity.
The lower the support zone on the chart, the price hits, stronger bounce and higher probability for a long trade it presents.
I will load heavy on spot if it hits any of the weekly support, specially WS2 in future.

Hyperliquid Surged 12% Today Gearing For Another Leg-upThe price of Hyperliquid surged 12% today amidst the general crypto market dip. According to data from Lookonchain monitoring, about 2 hours ago, a whale deposited 6 million CRYPTOCAP:USDC into Hyperliquid and went long on CRYPTOCAP:ETH at a price of $1,624.44 with a 5x leverage.
This data signifies a growing interest in the Hyper liquid Dex. Similarly, data from Defilama shows about $277.3 million locked in Total Value Locked (TVL) in the Hyperliquid ecosystem and this is for a project that is just 5 months from token lunch.
With the Resistant and support point already marked, should GETTEX:HYPE coin break above the $17 resistant zone, the $20 pivot will be feasible. However, failure to break above the resistant point could resort to a selling spree to the $9 support resorting to the break below the Moving averages respectively as that is the only nearest possible support point for $HYPE.
What is Hyperliquid?
Hyperliquid represents a cutting-edge blockchain platform, specifically designed to enhance the efficiency and performance of decentralized finance (DeFi) applications. At its core, Hyperliquid introduces a novel Layer 1 (L1) blockchain that is meticulously engineered from the ground up to optimize performance and scalability.
Hyperliquid Price Data
The Hyperliquid price today is $15.97 USD with a 24-hour trading volume of $141,575,547 USD. Hyperliquid is up 1.87% in the last 24 hours. The current CoinMarketCap ranking is #23, with a live market cap of $5,333,694,243 USD. It has a circulating supply of 333,928,180 HYPE coins and a max. supply of 1,000,000,000 HYPE coins.
