I-XRP

XRP/USD – Technical Analysis (1D)📊 XRP/USD – Technical Analysis (1D)
Current Price:
• Buy: 2.1554 USD
• Sell: 2.1553 USD
⸻
🧭 Trend & Structure
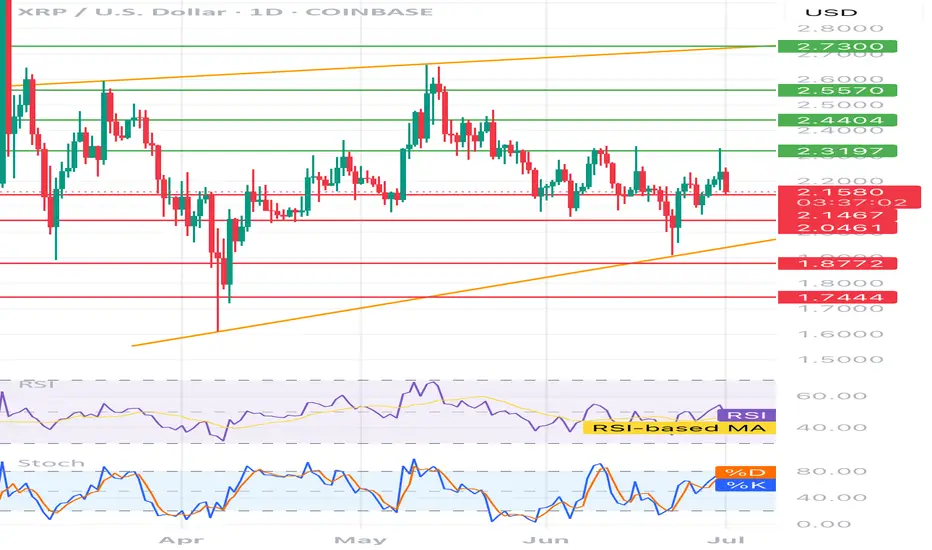
• Price is moving within a rising channel (orange lines).
• It’s currently trading closer to the lower trendline, suggesting potential support.
Resistance Levels (green lines):
• 2.3197
• 2.4404
• 2.5570
• 2.7300 (channel top)
Support Levels (red lines):
• 2.1467
• 2.0461
• 1.8772
• 1.7444 (key support)
⸻
📈 Indicators
RSI (Relative Strength Index)
• Hovering around the 50 level → neutral momentum.
• No strong divergence observed – RSI is moving with price.
Stochastic Oscillator
• %K has crossed %D upward → short-term bullish signal.
• Nearing the overbought zone (above 80) → a pullback could occur soon.
⸻
📌 Interpretation
• Price is testing the 2.15–2.16 zone, which has acted as both support and resistance in the past.
• A break above 2.32 could open the door toward 2.44 and 2.55 USD.
• A drop below 2.04 USD could lead to retesting 1.87 or even 1.74 USD.
• Overall trend: neutral to bullish, supported by the rising channel.
🎯 Trading Ideas
• Long Entry: Break and close above 2.32 USD with volume → targets: 2.44 / 2.55
• Short Entry: Breakdown below 2.04 USD → targets: 1.87 / 1.74
HolderStat┆XRPUSD forming the rising bottomBINANCE:XRPUSDT has broken above resistance and is consolidating above the breakout zone. This mirrors previous triangle–consolidation patterns that preceded upside moves. If momentum continues, a run toward 2.34 is in play.

HolderStat┆XRPUSD before retest of the $2 levelBINANCE:XRPUSDT has rebounded from its 2.08 base and broken out of consolidation, aiming for the upper diagonal resistance near 2.40–2.60. With recurring bullish patterns and a history of strong follow-through after similar setups, momentum may build if 2.20 is cleared.

Xrp - The expected rally of +50%!Xrp - CRYPTO:XRPUSD - is still clearly bullish:
(click chart above to see the in depth analysis👆🏻)
Ever since Xrp rallied more than +550% in the end of 2024, we have been witnessing a quite expected consolidation. However Xrp still remains rather bullish and can easily retest the previous all time highs again. Maybe, we will even see another parabolic triangle breakout.
Levels to watch: $3.0, $10.0
Keep your long term vision!
Philip (BasicTrading)

XRP Support Holds After Being Tested 12 Times...Everything below $2 is quickly bought. No crash is good news. Not having bearish action and bearish follow up on sellers pressure is bullish. XRP is bullish and has been consolidating for months. The longer XRP trades above $2, the stronger will be the bullish wave that follows. We are getting very close.
Good evening (morning) my fellow Cryptocurrency trader, I hope you are having a nice day.
The same level has been tested over and over and over since December 2024 and it continues to hold. XRP managed to wick below $2 more than twelve times, this support continues to hold. When prices move lower, buyers quickly show up.
Look at this, before 7-April XRP was moving below $2 very often. After 7-April, only twice. Big difference. This reveals a bullish bias. When the market was bearish, this support was tested more often than not. As soon as XRP turned bullish, it was tested only once recently and once after the 7-April bottom.
This little dynamic here shows that the bulls have the upper-hand and this is all we need to know. Knowing that the bulls have the advantage, when the market breaks it is going to break up. A bullish continuation. It is confirmed and it is only a matter of time.
How long? Only the market knows but it is not far away. The longer it takes, the stronger the bullish wave that follows. Strong growth is likely to develop within days.
Namaste.

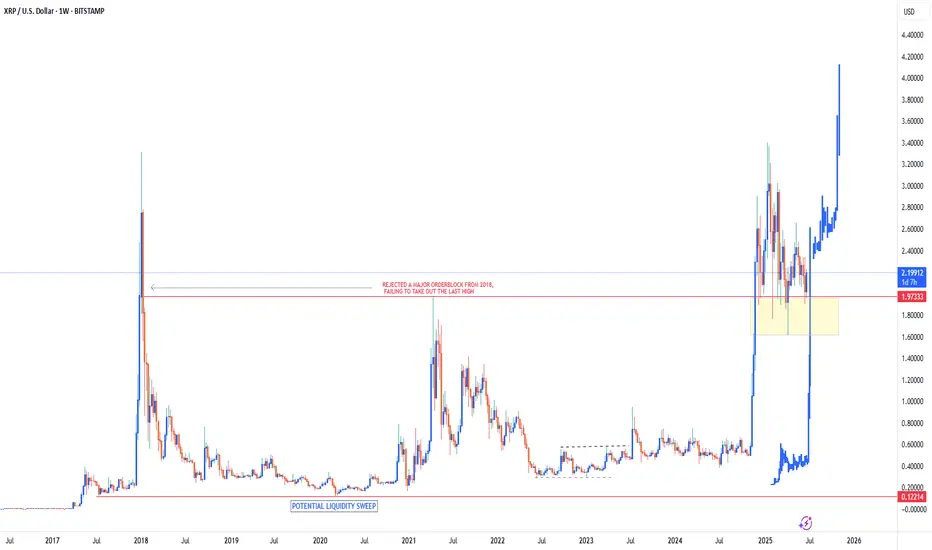
XRP Bullish to ATH of $4.10Since breaking out of its 6 year price range of $0.12 - $1.97 in November 2024, Ripple has remained within a bullish territory, sitting just above its support zone of $1.60 - $1.97.
As long as price can remain above this support zone I do believe that Ripple has much more upside to come in the next few YEARS. This definitely won’t be a fast move as there’s still a lot of legal situations involving XRP which is keeping price limited to the upside. But, as these legal battles come to an end & they will, it will slowly give XRP room to move to the upside.
I definitely see $4.1 as an achievable target for Ripple as the first target in the future. Once this price is reached, market structure & price action will give us a better indication of whether or not we can see high prices above the $4.1 target.
For now just be patient & let XRP play out in accordance with its external macro factors.
HolderStat┆XRPUSD consolidation of the assetBINANCE:XRPUSDT has bounced from the 2.02 level and is approaching the upper edge of a large consolidation structure. Multiple prior consolidation zones have led to breakouts, and the current bounce hints at continuation toward 2.30. A clean close above resistance would confirm bullish intent.

XRP - Do you want to slurp?Yeah who doesnt wants to slurp profits? I shall say the move down shall be taken first before the formation of the pattern to work in accordance with the moves! Hope its understood

XRP UG-ah-LYXRP has been slowly chopping lower in a mess of overlapping candles. Lower highs and lower lows at the Highest degree. The trend is down and the Elliott Is ugly.
There is a chance here for the trend to shift, but that low needs to hold.
In Elliott Wave, ugly can be useful. An ugly pattern often screams correction. That is the working assumption right now. This structure could still be a complex wave four.
Even though the wave count has not been crystal clear, I am not flying blind. I am using support and resistance to track the structure and wait for clarity.
Here are the levels that matter right now:
3.4005 was the major high
3.0257 and 2.2762 are key reaction zones
2.6510 is the median and the first major line bulls need to beat
1.9736 is the old high that price continues to bounce from
1.9015 and 1.5267 are the potential downside reaction zones if the yellow path unfolds
If this is a correction, there is still potential to hold above 1.62 and send. If that level goes, the structure shifts fast to lower targets.
This is not the time to get brave without confirmation, mo.
Ugly price action can still resolve cleanly. But I want to see an impulsive move through one of these levels, followed by a corrective return to that level. That would offer a more ideal continuation in whichever direction price decides.
Let the level reactions speak first. I will act after.

w partners with Ripple XRP.. alt season gemwhen alt season comes Q4 i expect $W to scam pump..
today it pumped 24% on the news with the partnership with Ripple / CRYPTOCAP:XRP
im waiting for a bottom around 3-4c to DCA in..
sell zone around 55-70c Q4

HolderStat┆XRPUSD held the supportBINANCE:XRPUSDT on the 16h chart is showing strength above $2.05 after breaking out from consolidation. The path is clear toward $2.30 and $2.60 as buyers regain control. The bullish pattern sequence continues to develop.

XRP's situation+ Target PredictionThe XRP is in a Bullish phase by a Falling Wedge Pattern.
A falling wedge indicates the potential for price to reach to $3.
Note if the PRZ ZONE is broken downwards with the strength of Bearish candles , this analysis of ours will be failed.
Best regards CobraVanguard.💚

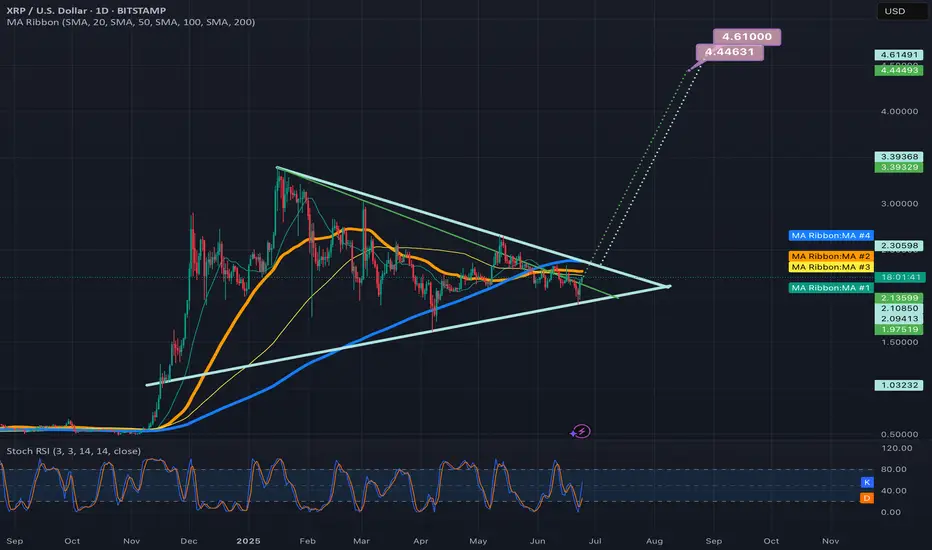
XRP About to Break Out! 3.40 Target.Trading Fam,
It's really this simple. This is a bullish triangle. Three hits in the premium buy zone (bottom of the triangle) and we're done. Once we break, there will be some resistance at that VRVP PoC (2.39) and then we're gone. 3.40 is an easy target.
Stew

Something Like ThisI believe the charts are pointing towards the market gearing up for a play somewhat like this.
The timing may well be off, but the levels and sequence seem broadly predictable.

Xrpusd cup and handle targetIf xrp triggers the current bullflag its in on the daily chart it should take price ell above the neckline of the cup and handleshown here on this chart and trigger its breakout as well which has a breakout target around $6.70. *Not financial advice*

Weekly/monthly bullflag on xrpusdAn even higher target than the symmetrical triangles two potential targets materializes when we confirm the breakout up from this bull flag. It will likely have a bullish target somewhere around $5.20. Upon reaching this target it will also be breaking above a big cup and handle that will then have an even higher breakout target which I will post in my next idea *not financial advice*

2 potential breakout targets for the symmetrical triangle on xrpDepends on if the green trendline is the more valid top trendline or the light blue one is. *not financial advice*
Get Ready To Load Up For The Upcoming Institutional Altseason! Since the explosive high of $3.40 on Jan 16, 2025 📈, XRP has been sliding inside a persistent downward channel 📉. The trend remains bearish, with bulls struggling to break resistance at every turn.
Today, XRP trades near $2.04, but momentum is weak and the channel shows no signs of reversal yet. If this bearish pressure continues, a drop toward the $1.49 level is on the table—a zone that could offer a textbook buying opportunity for patient bulls! 🛒🔥
🔻 Key Chart Signals:
Downward channel intact since Jan 16, 2025 📆
Lower highs & lower lows dominate the structure 📉
$1.49 is a major support & potential reversal zone 🛑
👀 Strategy: Let the bears do their work. If XRP dips to $1.49, get ready to load up for the upcoming Institutional Altseason! 🚀

XRP M30 Chart Analysis "XRP Short.
Target: 123.01B. Stop: 127.09B.
Let's see if this plays out. 👀
#XRP #CryptoTrading"

XRP road map (Daily)This could be the last chance for Ripple; if the triangle breaks downward, the price could enter a channel below $2.
Best regards CobraVanguard.💚

HolderStat┆XRPUSD correction from the trend lineOKX:XRPUSDT found footing at 2.09 and now grinds beneath descending resistance. Regaining 2.18 should unlock a glide toward 2.25-2.35 inside the larger bull channel, whereas failure to defend 2.05 risks a trip to 1.95 reload territory.

XRPUSDT Forming 2017-Style Flag — Major Breakout Loading! BINANCE:XRPUSDT is currently forming a classic bullish flag pattern, a setup that looks strikingly similar to what we saw back in 2017 before CRYPTOCAP:XRP went on a massive run. The price has been consolidating within a tight range, and this could be the calm before a powerful breakout.
Back in 2017, a similar flag formation led to a parabolic uptrend once the resistance was broken. While history doesn’t repeat exactly, this pattern suggests the potential for a significant upside move if the breakout confirms. Traders and investors should keep a close eye on this structure — a breakout from this flag could reignite bullish momentum and open the door for a sharp rally.
This is a buy and hold scenario for those who believe in XRP’s potential, but remember — risk management is key. Always use a stop loss below the flag support to protect your capital. Momentum could build quickly, so stay alert and watch for volume confirmation on the breakout.
