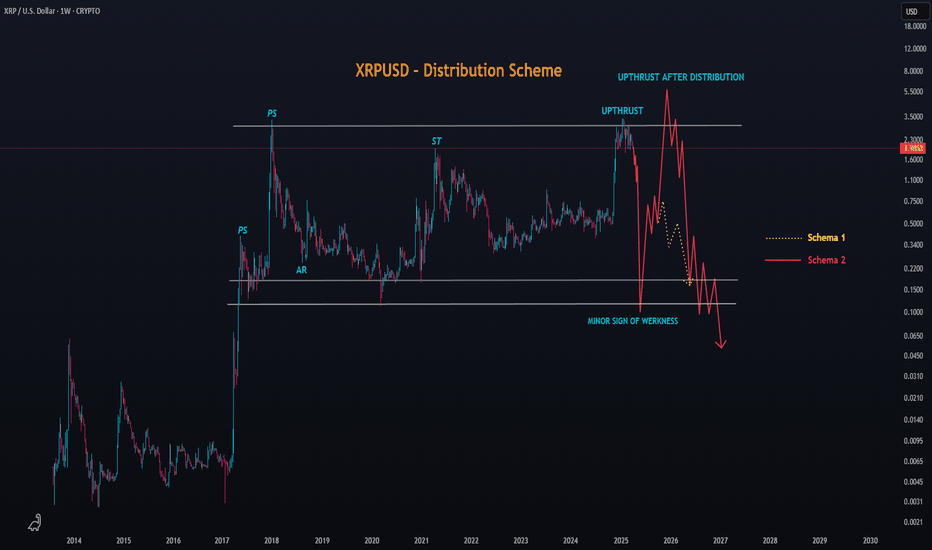
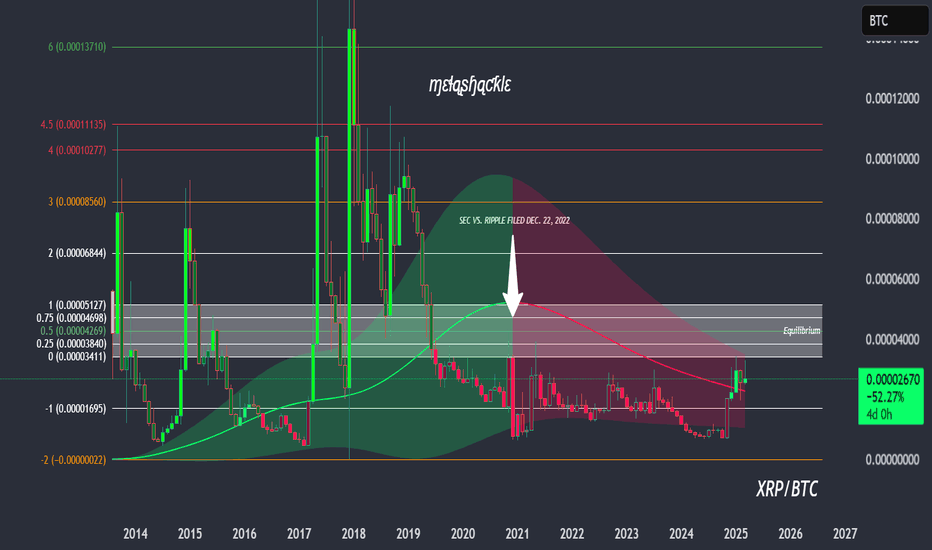
Possible Distribution Scheme in XRP (Chaotic Scenario)Someone asked me what the most chaotic scenario for XRP's price could be — and I answered: a long-term Distribution phase.
In this image, I illustrate a radical distribution scheme that could potentially extend into late 2025. But first, a sign of weakness — with price dropping below the Corona Dump levels, possibly close to $0.10. Sounds absurd to many, I know.
If it's Scheme 1, XRP would drop and then bounce back to the Last Point of Supply (yellow line).
If it's Scheme 2 (red line), price could spike between $5 to $6.8, with an average peak around $5.5–$5.7, likely triggering extreme euphoria.
But remember, this is just one insane possibility — and it depends heavily on Bitcoin, Market Makers, Supply vs Demand, public interest, and the macroeconomic context.
If this scenario plays out… what would YOU do?
I-XRP
XRP XRP failed to break through the $2.1597 resistance and is now heading back toward the $2.0216–$1.9000 support zone.
If this support fails to hold, lower lows may be on the horizon.
A bullish reversal requires a breakout above resistance and confirmation above the 200 MA.
🎯 Next targets: $2.4729 and $2.59
📉 Weak volume and rejection from key levels increase bearish pressure.
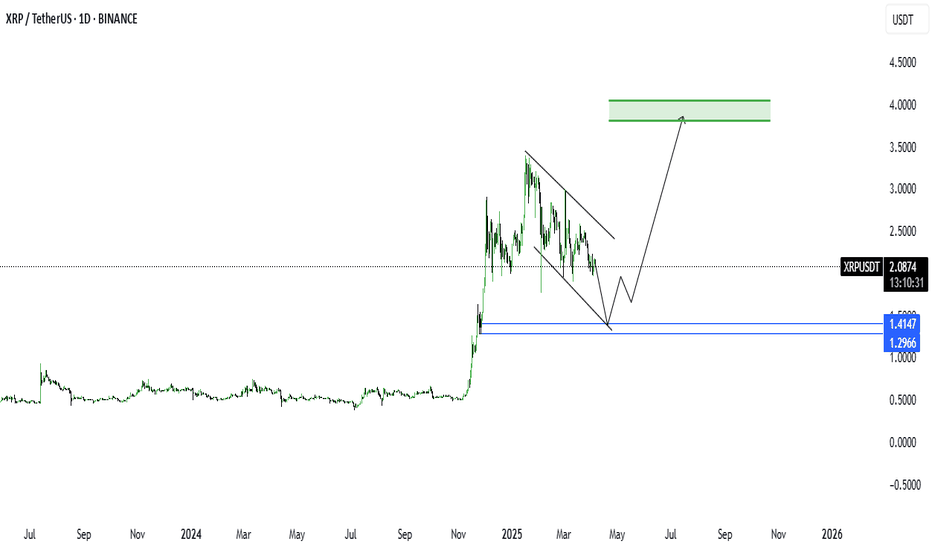
xrp update Here's a polished version of your message that you could use for a post or update:
---
**XRP Update:**
Currently trading around **$2.085**, we're anticipating a **pullback toward the $1.40** levels. That zone could offer a **great opportunity** for long-term investors and spot traders to enter.
🎯 **Targets:**
- First target: **$3**
- Second target: **$5**
**⚠️ Patience is key — wait for the opportunity. Don’t jump in too early.**
Good luck, everyone! 💰🚀
---
Want it styled as a tweet, YouTube caption, or short video script?
The key is whether it can rise above 2.2582
Hello, traders.
If you "Follow", you can always get new information quickly.
Please click "Boost" as well.
Have a nice day today.
-------------------------------------
(XRPUSDT 1D chart)
Important support and resistance areas are
- 2.5641,
- 1.9513,
- 1.5467.
Among them, the 1.9513 point corresponds to the volume profile area, so it can be seen as an important support and resistance area.
A trend is created when the 2.5641 or 1.5467 point is broken, so the trend is expected to be determined depending on which of these points is broken.
-
What you should pay attention to is that the OBV indicator is renewing the low.
This time, if it rises above 2.2582 and maintains the price, we should see if the OBV rises and renews the high.
If not, it is expected to fall below 1.9513.
-
Therefore, the first purchase period is when support is confirmed around 2.2582.
The second purchase period is when support is confirmed around 2.5641.
An aggressive purchase is when it falls below 1.9513 and then shows support again around 1.9513.
-
Thank you for reading to the end.
I hope you have a successful transaction.
--------------------------------------------------
- This is an explanation of the big picture.
I used TradingView's INDEX chart to check the entire range of BTC.
I rewrote the previous chart to update it by touching the Fibonacci ratio range of 1.902 (101875.70) ~ 2 (106275.10).
(Previous BTCUSD 12M chart)
Looking at the big picture, it seems to have been following a pattern since 2015 and has been rising.
In other words, it is a pattern that maintains a 3-year uptrend and faces a 1-year downtrend.
Accordingly, the uptrend is expected to continue until 2025.
-
(Current BTCUSD 12M chart)
Based on the currently written Fibonacci ratio, it shows up to 3.618 (178910.15).
Fibonacci ratio 0.618 (44234.54) is not expected to fall again.
(BTCUSDT 12M chart)
I think it is around 42283.58 when looking at the BTCUSDT chart.
-
I will explain it again with the BTCUSD chart.
The Fibonacci ratio ranges marked in the light green boxes, 1.902 (101875.70) ~ 2 (106275.10) and 3 (151166.97) ~ 3.14 (157451.83), are expected to be important support and resistance ranges.
In other words, it seems likely to act as a volume profile range.
Therefore, in order to break through this section upward, I think the point to watch is whether it can rise with support near the Fibonacci ratios of 1.618 (89126.41) and 2.618 (134018.28).
Therefore, the maximum rising section in 2025 is expected to be the 3 (151166.97) ~ 3.14 (157451.83) section.
To do that, we need to look at whether it can rise with support near 2.618 (134018.28).
If it falls after the bull market in 2025, we don't know how far it will fall, but considering the previous decline, we expect it to fall by about -60% to -70%.
So, if the decline starts near the Fibonacci ratio 3.14 (157451.83), it seems likely that it will fall to around Fibonacci 0.618 (44234.54).
I will explain more details when the downtrend starts.
------------------------------------------------------
Bitcoin BTCUSD The Move Down Is OverI posted this chart in February 2027, I was unable to update it. This is playing out exactly how I predicted. Bitcoin loves these double tops and the corrections are textbook almost every time. Bitcoin may double bottom but on a closing basis on the 5 day I am predicting that Bitcoin will NOT close lower than the measured move. Wicks below sure but on a cloing basis which the Line chart shows we are right on track. I think that by the middle to late April we are above the previous high and en route to new all time highs. There is no bear market coming any time soon. Bitcoin is going to astronomical numbers, numbers most cant fathom. None of this is financial advice this is just my opinion. Like and follow for updates. Thank you
Very Interesting XRPUSDT Update: Did You Know...This is very interesting for many reasons.
How are you doing my friend in the law?
It's been a while, almost a month since we last spoke.
It is truly my pleasure to write again for you and I hope that you find this information useful in someway if not entertaining.
Whatever you do, you are awesome and you are great.
Life is the best thing the Universe has to offer and you are alive... Let's get to the chart.
Cryptocurrency Market About To Boom! —XRPUSDT
This is an XRPUSDT update on the daily (24-Hours per candle) timeframe.
Why interesting? Because I am still using the same chart I used back in February and XRPUSDT continues to trade above the 3-February low point. It is hardly necessary to highlight this on the chart but, I've done it for your convenience.
So here is the thing, I will recap because it's been a while. As long as XRPUSDT trades daily, weekly, etc., above $1.70, market conditions are strongly bullish. The longer it trades above this level the better the situation for buyers. The longer the consolidation phase, the stronger the bullish wave that follows.
Even with the upswing in January XRPUSDT has been sideways since late 2024.
We can say since December 2024 so sideways for four months. How much longer will it stay sideways?
Not much longer. Worst case scenario it goes into consolidation for another 60-90 days. That's the worst case.
Normal scenario would be 30-45 days before a major bullish impulse.
Best and most likely scenario is that the next bullish wave will start within 30 days. We are in-between the last two, the first one is out of the question for now.
Caution: If the market drops, tests and pierces $1.70 the bullish bias remains. In this type of scenario, we look at the weekly and monthly timeframes.
There was a low in early February and higher-low mid-March.
On a short-term basis, trading above $1.89, the 11-March daily low, is considered bullish. (Which means that the inverse would be considered bearish.)
There are no indications or signals coming from the chart pointing towards a new bearish-trend. None. The market has been sideways after a very strong period of growth. Current action is the consolidation of the previous move. When a bullish phase ends, we tend to see a strong decline right afterward, this happens with Crypto. When a bullish move makes a pause, we see sideways and this is what we have here. Actually, this chart is a strong one but still neutral. Neutral is the accumulation period for whales whom need months to load up. Since they purchase billions worth of Crypto, it takes time to plan and to move this money around and that's why it takes so long between each phase.
I am tracking whale alerts all of the time. Most of the money is in place. After the money exchanges hands and is positioned, there is always a small pause before the action starts. Money always moves before the action and never within the action. So the money moves, pause and then lots of price movements. While prices are moving, no big transactions are taking place, these are taking care of beforehand.
Consider the fact that there are hundreds of exchanges and everything moves simultaneously and at the same time. The only way this is possible is through long-term coordination and group planning.
What to expect?
Expect the market to heat up slowly. And after a slow rise and heating up then the bullish impulse and bull-run. It will be a long process and it will develop in many months.
If you are reading this now timing is great.
Spot traders can continue to buy and hold.
For leveraged traders, I have to look at some more charts before giving any suggestions. I will feel more comfortable when I read at least 100 charts.
Market conditions are changing and improving and it will do so long-term, but we still have one more month before May when the force will be in our favor, we are still in the sideways period, accumulation/consolidation. Boring? No! Time to study and prepare. The market gives us time to be at our best before the really good action starts and this is only good, don't you agree?
A bear-market means lower lows and lower highs long-term.
2025 is a bull-market year, likely to be the strongest ever. There is a huge difference. It is like calling night when it is day. It is like saying the sun is about to go up when the sky is ready to rain.
We are about to a see and experience a rain of cash flowing into the Cryptocurrency market and this will in turn send everything up. There is no bear market, we had a correction after a major advance and this is normal. After the correction is over we get consolidation, after consolidation prices will grow. Mark my word.
I appreciate you now and always.
Thanks a lot for your continued support.
Namaste.
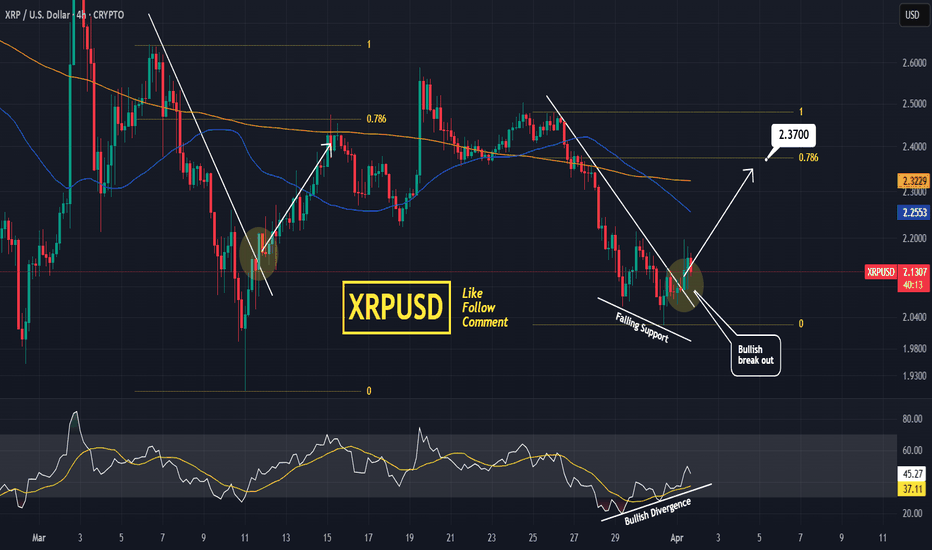
XRPUSD Falling Wedge bullish break out. Target 2.3700XRP broke above its Falling Wedge pattern. Being under the MA50 (4h) means that this is still a good short term buy opportunity.
Last time it had a break out like today's (March 11th), it hit the 0.786 Fibonacci retracement level.
Trading Plan:
1. Buy on the current market price.
Targets:
1. 2.3700 (the 0.786 Fibonacci retracement level).
Tips:
1. The RSI (4h) has been on a Rising Support while the price was on a Falling Support. This is a bullish divergence signal that prompted early today's break out.
Please like, follow and comment!!
Notes:
Past trading plan:
XRP tests Key Resistance Level F enzo F x—Ripple (XRP) has climbed from $2.026 and is currently testing resistance at $2.218. Despite this upward movement, the overall trend remains bearish as the price stays below the 50-period simple moving average on the 4-hour chart.
The nearest support level is $2.026. If XRP/USD drops below this point, the downtrend may strengthen, potentially driving the price toward $1.90 and then $1.80.
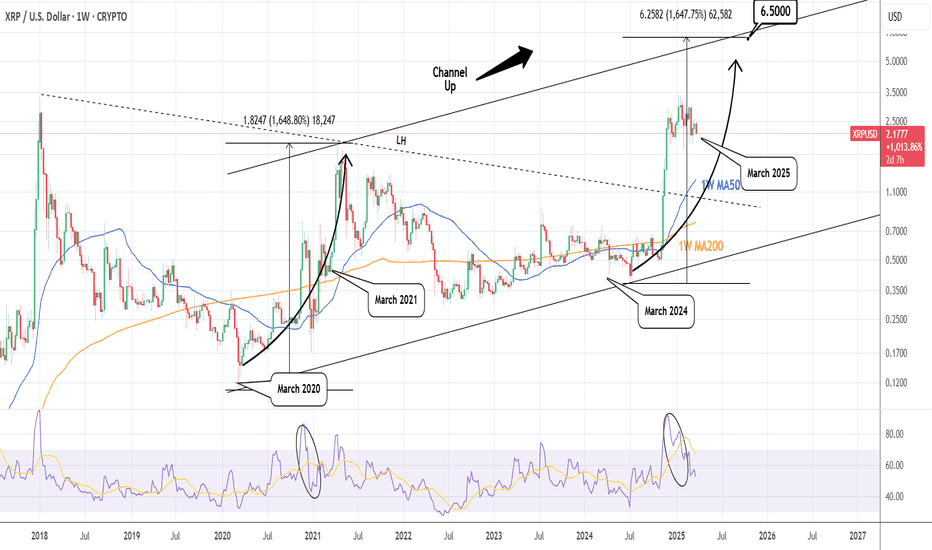
XRPUSD starting the parabolic rally to $6.000Ripple (XRPUSD) has been trading within a 5-year Channel Up since the March 2020 COVID flash crash. That COVID bottom initiated the first Bullish Leg of XRP, which was the previous Cycle's Bull run.
XRP has started the second Bullish Leg after the July 2024 Channel Up bottom and since basically December, the market has been under heavy volatility, entering a consolidation period similar to December - March 2021.
That was XRP's last accumulation phase before the 2021 Cycle Top. The 1W RSI patterns between the two Bullish Leg fractals are also similar, indicating that even though the current Bullish Leg has been more aggressive since November 2024, it is being harmonized now inside the parabolic growth Channel.
We expect a symmetrical +1668% rise in total for this Bullish Leg, similar to 2021, with our Target being marginally lower at $6.000, expecting it within July - October 2025.
-------------------------------------------------------------------------------
** Please LIKE 👍, FOLLOW ✅, SHARE 🙌 and COMMENT ✍ if you enjoy this idea! Also share your ideas and charts in the comments section below! This is best way to keep it relevant, support us, keep the content here free and allow the idea to reach as many people as possible. **
-------------------------------------------------------------------------------
💸💸💸💸💸💸
👇 👇 👇 👇 👇 👇
BTC - Post Weekly Closure UpdateAgain, not an awful lot has changed since last week’s update. We’ve now closed a weekly candle yet again in no man’s land; in fact, one could argue it’s a bearish engulfing candle that closed below the previous week’s level, solidifying further bearish sentiment and likely continuation until key SH has been reclaimed.
Like I mentioned in last week’s update - for now, we’re waiting for 65K–72K, a break of ATH, or at least a reclamation of HTF 🗝️ swings (95K minimum) to jump back into HTF trades. Until then, I’m exploiting LTF/MTF moves.
Another thing to note: Everyone is so fixated on 72K being the potential bottom (if reached). It makes me wonder: will 72K happen soon (it will eventually), and if it does, will it hold? I personally think we’ll see a deeper pullback into the 2W demand at 68K, or potentially the 1W PHOB at 65K, which I’ve mentioned several times.
On LTF/MTF - I’ve been updating every trade, and they’ve been playing out quite well so far. We failed to hold the 23H HOB at 83K, thereby breaking below the MTF SL at 83130, and now the same level is acting as an obstacle to higher prices. If accepted above, I expect 84K, potentially 86K, before a possible downward continuation.
For us to see higher prices on MTF, we need to reclaim 88744, SH, to target 96K - potentially the 2D OB at 100K, which is also a psychological level and confluent with the volume drop in VRVP, as shown in the image above. If 88744 is reclaimed, followed by a pullback into newly formed liquidity or BB, I’d then look for a long to the above-mentioned levels.
As long as we’re below 88,744, downward pressure remains.
Chaos to Clarity: Mastering the Discipline Mindset5min read
Looking back on my journey as an investor, I can see how much my mindset shaped my path. When I first started, I was a mess—chasing every hot tip, jumping into trades without a plan, and letting my emotions call the shots. I’d feel a surge of excitement when price spiked, but the moment it dipped, I’d panic and sell, locking in losses. It was a chaotic rollercoaster, and I was losing more than I was gaining. I knew something had to change, but I wasn’t sure where to begin.
One day, I took a step back and really looked at myself. I realized the market wasn’t my biggest problem—I was. I was reacting to every little fluctuation, letting fear and greed drive my decisions. I started paying close attention to how I felt when I made trades. Was I anxious? Overconfident? I began noticing patterns. When I was stressed, I’d make impulsive moves that almost never worked out. But when I was calm and focused, my choices were better, and I’d often come out ahead. That was my first big revelation: my state of mind was the key to everything.
I decided to get serious about controlling my emotions. I started small, setting strict rules for myself. I’d only trade when I was in a good headspace—calm, clear, and ready to stick to my plan. If I felt off, I’d step away from the screen, no exceptions. It was tough at first. I’d catch myself itching to jump into a trade just because everyone else was talking about it. But I learned to pause, take a deep breath, and check in with myself. Over time, I got better at staying steady, even when the market was a whirlwind.
I also realized how much my beliefs were holding me back. I used to think I had to be in the market constantly to make money. If I wasn’t trading, I felt like I was missing out. But that mindset just led to burnout and bad calls. I started to change my thinking—I told myself it was okay to sit on the sidelines if the conditions weren’t right. I began to see that success wasn’t about being the busiest; it was about being the smartest. I focused on quality over quantity, and that shift made a huge difference. My wins started to outnumber my losses, and I felt more in control than I ever had.
One of the toughest lessons came when I stopped blaming external factors for my failures. If a trade went south, I’d point the finger at the market, the news, or even the system I was using. But deep down, I knew that wasn’t the whole truth. I had to take responsibility for my own actions. I started treating every loss as a chance to learn. What was I feeling when I made that trade? Was I following my rules, or did I let my emotions take over? By owning my mistakes, I began to grow. I became more disciplined, more aware of my own patterns, and better at sticking to what worked.
I’m not going to pretend I’m perfect now—I still make mistakes, plenty of them. At the beginning of this week, I came into trading loaded with personal problems from real life. I didn’t even pause to clear my head; I just dove straight into the charts and started opening long positions without much thought. By Friday, I realized what I’d done—I’d let my distracted, emotional state drive my decisions. So, I closed all my positions except one, cutting my losses quickly and stepping back to reassess. That’s what’s changed: I recognize those mistakes almost immediately now. I don’t hang on to them or let them spiral. I catch myself, fix the problem fast, and move on without beating myself up. That ability to pivot quickly has been a game-changer. I’m not stuck in the past anymore—I’m focused on getting better with every step.
Over time, I learned to tune out the noise and focus on what I could control. I stopped worrying about what other people were doing and started trusting my own process. I’d remind myself that investing isn’t just about the numbers—it’s about the person behind the trades. The more I worked on my mindset, the more consistent my results became. I learned to stay present, keep my emotions in check, and approach every decision with a clear head. That’s what turned me into the investor I am today—someone who’s not just chasing profits, but building a sustainable, successful approach to the markets, mistakes and all.
XRP’s Descending Trendline Showdown: Is a Breakout Toward $4From a purely technical‐analysis standpoint (not financial advice), here are a few observations and ideas you can take into xrp/usdt
1. Descending Trendline Resistance
- Price has been making lower highs, forming that yellow descending trendline. A sustained break and close above it (on higher‐than‐average volume) would be a strong bullish signal.
- If price rejects at the trendline again, that often implies more consolidation or another leg downward, so watch how price reacts if/when it retests that line.
2. Moving Average Context
- It looks like the market is hovering near or just below a key moving average (blue line). If the price can reclaim that moving average and stay above it, it typically signals renewed bullish momentum. Conversely, continued closes below it can cap upside.
3. Key Support Zones
- The pink/gray box in the chart (roughly the 2.0–2.1 area) seems to be an important support region; buyers have stepped in there before.
- Below that, the 1.77–1.80 area looks like a major support “floor” (dotted line). If price were to break below that, it could trigger a deeper pullback.
4. Potential Upside Targets
- The horizontal level around 3.40 is the next big resistance if price can break out above the descending trendline.
- If bulls really take over and push through that 3.40 zone, a run toward 3.90–4.00 (as shown by the arrow) becomes more plausible.
5. Watch Volume and Momentum**
- Pay attention to volume on any breakout. A low‐volume push above the trendline can be a fakeout, whereas a strong volume surge confirms conviction.
- Oscillators (RSI, MACD, etc.) can help you gauge whether momentum is building or fading as price approaches resistance.
Overall, a breakout above the descending trendline plus a reclaim of the moving average would favor upside toward the mid‐3s or higher. Failure to break out, however, might lead to another test of that 2.0–2.1 support or even the 1.77 floor. Keep risk management in mind either way.
XRP in BIG TROUBLE | BearishXRP is known as the "PUMP and DUMP" alt for a reason.
If you look at this chart from the macro timeframe, it clearly shows how XRP dumps hard after every parabolic increase - and this isn't even the entire price history..
The lower highs and lower lows we currently observe are not helping its case, either.
Pulling up the technical indicator in the weekly timeframe and we see a clear SELL - indicating that the price/trend has turned bearish.
And from what we know of XRP - it's likely that the price will drop ALL the way back to the lows, aka the beginning of the parabolic rally - possibly even further down.
______________________
BINANCE:XRPUSDT
XRPUSD: The 5 year Channel Up is targeting 6.500XRP is neutral on its 1W technical outlook (RSI = 53.399, MACD = 0.310, ADX = 41.023) as since the Jan 13th High, the uptrend took a pause and turned into a sideways consolidation. As long as the 1W MA50 is intact, the Bull Cycle will be supported and since the dominant pattern is a 5 year Channel Up, we are on the latest bullish wave. As a matter of fact we have technically entered the last year of the bullish wave, which is so far identical to the March 2020 - April 2021 wave (also on RSI count). The market is currently (March 2025) on a consolidation much like March 2021. We estimate a similar +1,648% rise (TP = 6.500).
## If you like our free content follow our profile to get more daily ideas. ##
## Comments and likes are greatly appreciated. ##
Ripple Partners with Chipper Cash To Boost Cross-Border PaymentsRipple partners with Chipper Cash to expand cross-border payments in Africa, leveraging blockchain for faster, affordable transactions.
Ripple has announced a strategic collaboration with Chipper Cash to expand its payment solutions to Africa after securing a win against the US SEC earlier this week. Through Ripple Payments, the collaboration intends to foster cross border payments in the African regions.
Notably, the crypto platform’s alliance with Chipper Cash provides a fast, low-cost, and efficient payment system that unites international treaties.
Despite the partnership and important victory over the SEC, Ripples native coin ( CRYPTOCAP:XRP ) seems unbothered by the development with the asset maintaining the $2.3 price pivot. A break above the 38.2% Fibonacci retracement point might cement a bullish breakout for CRYPTOCAP:XRP with eyes set on $5 and beyond.
Similarly, in the case of a cool-off, CRYPTOCAP:XRP might find support in the 65% Fibonacci retracement level before picking liquidity up albeit the RSI is at 48 which is a strong sign of a bullish reversal lurking around the corners.
XRP Price Live Data
The live XRP price today is $2.35 USD with a 24-hour trading volume of $2,950,161,398 USD. XRP is down 0.54% in the last 24 hours. The current CoinMarketCap ranking is #4, with a live market cap of $137,073,610,487 USD. It has a circulating supply of 58,205,697,378 XRP coins and a max. supply of 100,000,000,000 XRP coins.
Get ready, XRP about to flyRejected block tapped, will we see $2.50 prices?
We previously mentioned that we wanted 50% of this area to give us support, however, 50% just ended up creating equal highs, we then traded all the way below its rejected ob. Will we now see price push higher past $2.50 highs?
VELAS IS READY TO IGNITE!🔥 VELAS IS READY TO IGNITE! 🔥
This chart screams massive breakout incoming — and here's why you should be paying attention right now:
📈 Falling Wedge Pattern Detected!
One of the most bullish reversal patterns in crypto. Velas ( LSE:VLX ) is tightening its coil, and once that breakout hits, we're looking at a potential moonshot.
🚀 Explosion Incoming – Targets as High as $0.024!
That massive blue arrow isn’t just for show – it’s pointing to the next major resistance zone. If this breakout plays out (and all signs say YES), we're talking about +400% gains from current levels!
🧠 Technical Indicators Support the Pump
MACD is showing early signs of bullish divergence.
RSI is climbing out of oversold territory.
Stochastic is crossing up — the bottom may already be in.
Money Flow Index is turning — smart money may already be accumulating.
🗓️ Key Catalyst: March 20th Update by Alex Alexandrov
With the Velas 2.0 Subchain Devnet, ERC20 upgrades, EVML support, and more — the fundamentals are aligning with the technicals. This is textbook launchpad energy.
⚡️ TL;DR: Velas is building momentum like a slingshot being pulled back. The tighter it winds, the harder it’s going to snap forward. Don’t miss this wave. Don’t blink. The move could be violent.
🌕 VELAS TO THE MOON – ARE YOU READY? 🌕
