$IBITIn crypto there are only two lines.
We would be lucky if we blessed in Dec with:
IBIT 42$
Bitcoin 75K$
IBIT

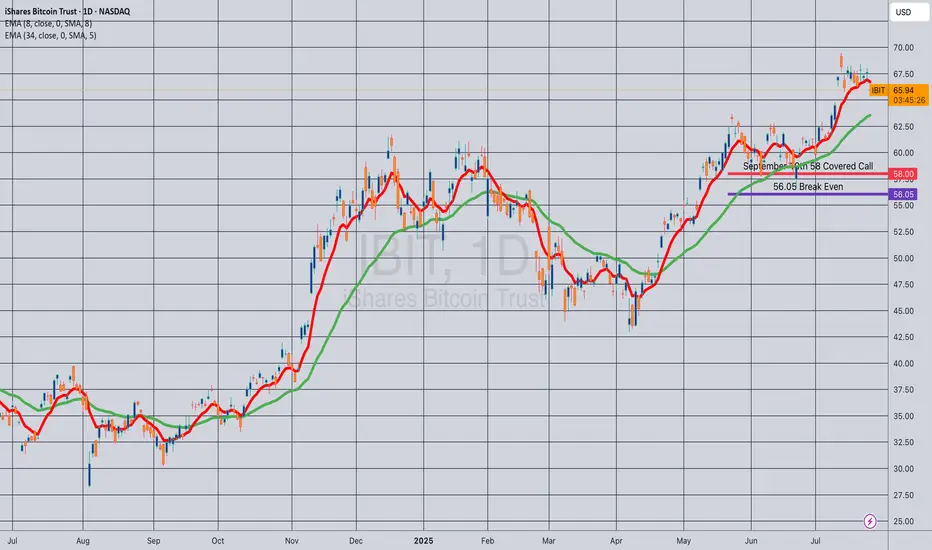
Opening (IRA): IBIT Sept 19th 58 Covered Call... for a 56.05 debit.
Comments: Selling the -75 delta call against shares to emulate the delta metrics of a +25 delta short put to take advantage of higher IV on the call side and the built-in defense of the short call.
Metrics:
Buying Power Effect/Break Even: 56.05
Max Profit: 1.95
ROC at Max: 3.48%
50% Max: .98
ROC at 50% Max: 1.74%
Will generally look to take profit at 50% max, add at intervals assuming I can get in at break evens better than what I have on.
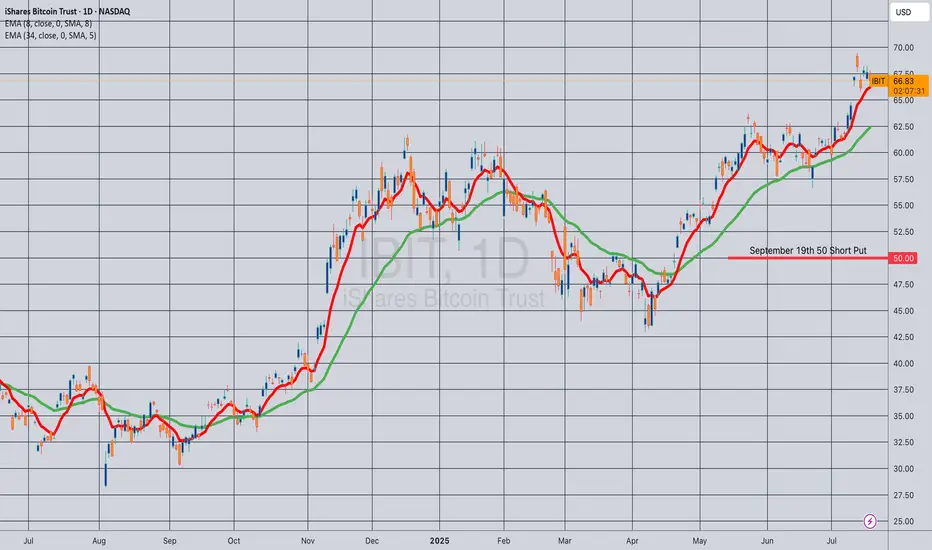
Opening (IRA): IBIT September 19th 50 Short Put... for a .52 credit.
Comments: Laddering out/adding at strikes better than what I currently have on, targeting the strike paying around 1% of the strike price in credit.
Will generally look to roll up at 50% max at > 45 DTE (Days 'Til Expiration).
Opening (IRA): IBIT July 25th 48 Short Put... for a .48 credit.
Comments: The highest 30-day IV on my ETF board (aside from USO and UNG). Laddering out, targeting the strike paying around 1% of the strike price in credit.

Beautiful Bitcoin breakout, as called. PLEASE SEE PROFILE FOR MORE INFO!
What an absolutely gorgeous Inverse Head & Shoulder for #Bitcoin.
Had suspicion this time WAS different for #BTC.
Let's talk ROUGH ESTIMATES for social #gold.
CRYPTOCAP:BTC is no longer a hard to anticipate as it's become an institutional asset. Follow the $, volume. ETF's are performing similar. Leveraged funds, not so much
Anyway, enjoy the ride #Crypto!
Opening (IRA): IBIT July 18th 51 Short Put... for a .59 credit.
Comments: One of the higher IV ETF's on my board at the moment. A starter position, targeting the strike paying around 1% of the strike price in credit.
Will look to ladder out at intervals ... .

BTC makes new all time highs!Crypto has been soaring today.
Ethereum and BTC pumping liquidity!
Fed minutes came out today around 2pm, indicating rate cuts at next meeting and throughout the rest of the year and crypto absolutely loved that.
Crypto thrives in a cheap liquidity environment, rallying in potential rate cuts.
We took profits on IBIT calls - still holding longs in the BTC market expecting higher price.

BTC - Channel is Broken, Now What?
The most bullish scenario right now is that the price stays in the upper part of the channel, tests the top of the channel and continues to rise.
If this breakout in BTC remains a manipulation, the price may also make the same manipulation downwards. When the price breaks through, my first thought is that it may find support at the midpoint of the channel, but this is a low probability. The higher probability is that it will make the same manipulation downwards and then re-enter the channel.

IBIT – Bull Flag + Trend-Based Fib Targets Lined Up🔍 Price Action Setup
IBIT is forming a tight bull flag just beneath key resistance at $64 after a strong impulsive move off the $42.75 base. Structure remains bullish with price holding above the 20 EMA, and volume compression setting the stage for a breakout.
📈 Trend-Based Fibonacci Extensions
If this flag breaks, here's how the upside unfolds based on the trend-based Fib extension:
1.27 – $82.50
1.382 – $85.75 (Measured Move Target)
1.50 – $89.50
1.618 – $93.00 (Full Extension)
These levels align with the prior flagpole projection and market structure above. If bulls step in on volume, $85.75 becomes the logical first destination.
🌊 ETF Inflows Confirm the Narrative
IBIT has pulled in roughly $3.3B in recent inflows, leading the pack during a 12-day net inflow streak across spot Bitcoin ETFs. Institutions are clearly still positioning, and that's reflected in the tape. Tuesday alone brought $436M+ into spot Bitcoin ETFs.
₿ BTC Leading the Way
Bitcoin is holding strong above prior resistance and pushing higher. IBIT looks like it’s just waiting on a breakout confirmation to follow.
📌 Key Trade Levels
Breakout Trigger: Close above $64
Target Zone: $85.75 first, then extended to $93.00
Invalidation: Break below $56 structure
—
🧠 This is not financial advice — just a look at structure and flow through the DC Trading lens.
📲 Follow the journey on IG: @dc_trading_journey

Bitcoin Symmetrical Triangle & another pattern formingBTC is currently trading in a Symmetrical Triangle formation.
This is generally a continuation pattern.
There's also a longer term BTC pattern FORMING.
Do you see it?
Inverse Head & Shoulder.
But it is a ways off, time will tell.
Bitcoin Crypto

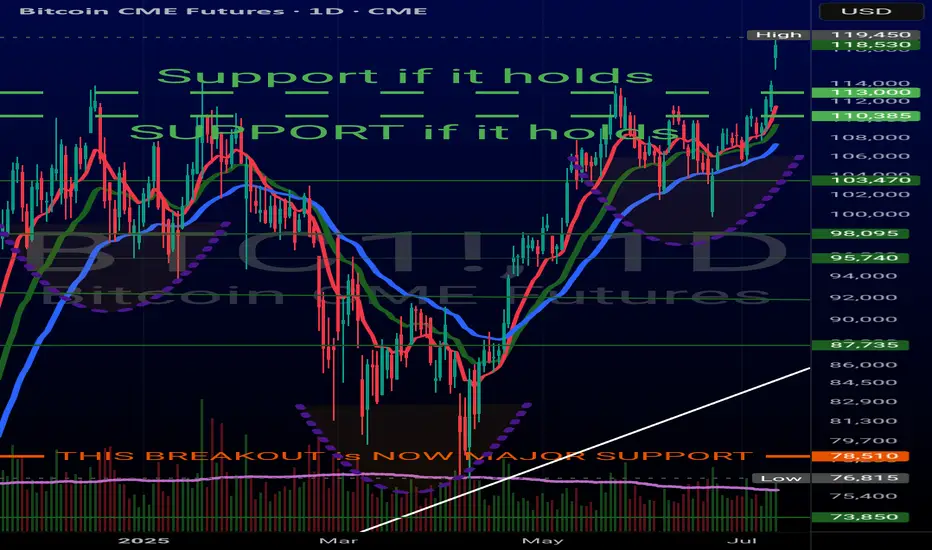
BTC target months ago has been on point, "NEW" TargetsSo far our CRYPTOCAP:BTC 109 - 111k target has been MONEY!
Bitcoin hasn't been able to close above it all!!!
Showing Negative divergence on RSI & $ Flow on WEEKLY charts.
"New" CRYPTOCAP:BTC prediction?
Will stand by what we said previously. IMO there's good possibility we could see BTC going to the 170k area, extreme = 226K.
Monthly RSI doesn't peak until it hits 90's BUT there's Negative Divergence forming.
$ FLOW slowly diverging as well.
VOLUME DYING on SPOT. Not so bad on Futures.

2/2 Bitcoin looks similar to 2021Post 2 of 2
#Bitcoin is trading similarly to 2021.
Major difference? The move is more ORGANIZED today.
Volume is substantially more.
Did #BTC top, like really top?
We want to say no, but things can change!
Current:
$ Flow is much weaker vs December 24 top.
RSI is lower as well.
It looks like CRYPTOCAP:BTC will likely break 100k again, 95k IMO.
80k = IMPORTANT AREA!

1/2 Bitcoin call was good, so far, short term top in placeNot long after our post May 20th we began to sell some CRYPTOCAP:BTC ETF's. It was a good call, still have some, & we believe #Bitcoin still has consolidation in order.
We're waiting to see how the #BTC RSI reacts & wow it reacts to the Green Moving Avg.
Selling volume is light & this means that there is a LACK of BUYERS, at least for now.
#crypto
Please see our profile for more info on posts.

IBIT — Ishares Bitcoin Trust. Under Bearish PressureThe iShares Bitcoin Trust ETF (IBIT) has been a mixed performer year to date, with its price up and down around 20 percent this year and currently tracking for low double-digit returns in 2025.
The ETF currently trades around $59.36–$60.40, with assets under management of around $68 billion and a 0.1 percent premium to net asset value (NAV).
1-Hour Technical Outlook
On the 1-hour time frame, technical indicators are mixed but generally bearish:
Moving Averages: Short-term moving averages (e.g. 200-hour SMA/EMA) are currently signaling a Sell signal as the price moved below these averages in late May.
Support and resistance: The ETF faces resistance around $61, corresponding to the broken 200-hour SMA, and support around $54, with stronger volume-based support around $47, corresponding to the beginning of the April rally.
RSI indicator: Over the last 20 days, the RSI(55) indicator has already been briefly noted below the baseline of 50, highlighting the need for more active risk management, since, as we can see from the chart, the indicator has again moved into the risk zone in late May and early June (where it currently remains), accordingly, for a longer term.
Volatility: During the recovery period in April-May 2025, the ETF demonstrated moderate intraday volatility (with half the 200-hour sigma value (σ) of about 3.5 percent), while the 20-hour decline on May 22-23, which exceeded this value, has provided at that time clear arguments for more active risk management.
To summarize, we can say that NASDAQ:IBIT is experiencing a pullback, technical indicators point to local persistence of bearish sentiment, following the classic, empirically proven adage of the financial market "Sell in May - and Go away."
--
Best wishes,
@PandorraResearch Team

BTCUSDT/IBIT: No Recovery in Sight Yet. Don't Be Fooled.Hello everyone. As I closely examine BTCUSDT and IBIT, I have a significant observation: there are no clear signals yet that selling is slowing down. This means it's too early to speak of a recovery in the market.
As intelligent investors, we look not only at price movements but also at the market's underlying dynamics. Currently, I see no clear indication in either BTCUSDT or IBIT that selling pressure is diminishing.
In such situations, a meticulous examination of the volume footprint is essential. We analyze every detail in the volume to understand if buyers are truly stepping in, and if selling orders are being absorbed. At the same time, I am closely monitoring CDV (Cumulative Delta Volume) divergences. If selling pressure were truly decreasing, we would expect to see clues in the CDV, but as of now, such confirmation is absent.
To confidently state that the market has entered a recovery phase, we need strong and confirmed breakouts on a low timeframe (LTF). Following these breakouts, a successful retest of the broken levels as support would be a reliable signal that the market has shifted direction. However, at present, such a structure has not formed.
As you know, I only trade coins that show a sudden and significant increase in volume. This approach allows me to focus my capital where the market is truly revealing its intentions. My current observation in BTCUSDT and IBIT is that this type of volume increase is not yet signaling a recovery.
Therefore, for those anticipating a market recovery, it is crucial not to act hastily and to await concrete confirmation signals. The market rewards the patient.
📌I keep my charts clean and simple because I believe clarity leads to better decisions.
📌My approach is built on years of experience and a solid track record. I don’t claim to know it all but I’m confident in my ability to spot high-probability setups.
📌If you would like to learn how to use the heatmap, cumulative volume delta and volume footprint techniques that I use below to determine very accurate demand regions, you can send me a private message. I help anyone who wants it completely free of charge.
🔑I have a long list of my proven technique below:
🎯 ZENUSDT.P: Patience & Profitability | %230 Reaction from the Sniper Entry
🐶 DOGEUSDT.P: Next Move
🎨 RENDERUSDT.P: Opportunity of the Month
💎 ETHUSDT.P: Where to Retrace
🟢 BNBUSDT.P: Potential Surge
📊 BTC Dominance: Reaction Zone
🌊 WAVESUSDT.P: Demand Zone Potential
🟣 UNIUSDT.P: Long-Term Trade
🔵 XRPUSDT.P: Entry Zones
🔗 LINKUSDT.P: Follow The River
📈 BTCUSDT.P: Two Key Demand Zones
🟩 POLUSDT: Bullish Momentum
🌟 PENDLEUSDT.P: Where Opportunity Meets Precision
🔥 BTCUSDT.P: Liquidation of Highly Leveraged Longs
🌊 SOLUSDT.P: SOL's Dip - Your Opportunity
🐸 1000PEPEUSDT.P: Prime Bounce Zone Unlocked
🚀 ETHUSDT.P: Set to Explode - Don't Miss This Game Changer
🤖 IQUSDT: Smart Plan
⚡️ PONDUSDT: A Trade Not Taken Is Better Than a Losing One
💼 STMXUSDT: 2 Buying Areas
🐢 TURBOUSDT: Buy Zones and Buyer Presence
🌍 ICPUSDT.P: Massive Upside Potential | Check the Trade Update For Seeing Results
🟠 IDEXUSDT: Spot Buy Area | %26 Profit if You Trade with MSB
📌 USUALUSDT: Buyers Are Active + %70 Profit in Total
🌟 FORTHUSDT: Sniper Entry +%26 Reaction
🐳 QKCUSDT: Sniper Entry +%57 Reaction
📊 BTC.D: Retest of Key Area Highly Likely
📊 XNOUSDT %80 Reaction with a Simple Blue Box!
📊 BELUSDT Amazing %120 Reaction!
📊 Simple Red Box, Extraordinary Results
📊 TIAUSDT | Still No Buyers—Maintaining a Bearish Outlook
📊 OGNUSDT | One of Today’s Highest Volume Gainers – +32.44%
I stopped adding to the list because it's kinda tiring to add 5-10 charts in every move but you can check my profile and see that it goes on..

IBIT aka BITCOIN TOPPING I am moving into In the money PUTS The chart of Blackrock bitcoin ETF needs only one minor new high to reach a projection and to complete The EW pattern from the low to mark in the bullish wave count wave 1 of Super Cycle blowoff this is a 5 % View . The 95 % is the WAVE B Top as we saw at every major peak see 2024 dec 8th forecast for bitcoin and spy Cyles as well as SPIRALS have now entered the window of A major turning point In which I am once again as I shorted bitcoin in ibit at 61 I have taken a65 % short and will move to a 100 % by friday if we can have any rally above the last high to end 5 clean waves Best of trades WAVETIMER

Bitcoin Income: STRK vs IBIT – Dividends, Covered CallsThis video provides a performance breakdown between two Bitcoin-related financial instruments—STRK (Strike) and IBIT—through the lens of passive income generation. I compare traditional buy-and-hold strategies with more active income tactics such as covered calls. Key insights include:
STRK provided the best return YTD (26%) and yielded approximately 1.54% in passive dividends, requiring minimal effort—just buy, hold, and collect.
IBIT, while slightly trailing in growth (13%), is optimized for a covered call strategy, offering an impressive 6% income yield through active options trading.
The analysis highlights the trade-off between simplicity and engagement—STRK is more passive-friendly, while IBIT offers higher yields for those willing to manage options.
This is ideal for tech-savvy investors exploring Bitcoin ETFs and derivative income strategies, weighing convenience versus return potential.

IBITUSDT | Volume Speaks FirstRight now, IBITUSDT is showing more volume than even Binance’s pair . That alone tells me where the real activity is — and this is the chart I’ll be tracking .
I’m not interested in premature entries. I’ll be watching below the green line for potential setups , but only with clear confirmation on lower timeframes.
“I will not insist on my short idea. If the levels suddenly break upwards and do not give a downward break in the low time frame, I will not evaluate it. If they break upwards with volume and give a retest, I will look long.”
Most traders follow the noise. I follow the volume. That’s how I stay accurate.
📌I keep my charts clean and simple because I believe clarity leads to better decisions.
📌My approach is built on years of experience and a solid track record. I don’t claim to know it all but I’m confident in my ability to spot high-probability setups.
📌If you would like to learn how to use the heatmap, cumulative volume delta and volume footprint techniques that I use below to determine very accurate demand regions, you can send me a private message. I help anyone who wants it completely free of charge.
🔑I have a long list of my proven technique below:
🎯 ZENUSDT.P: Patience & Profitability | %230 Reaction from the Sniper Entry
🐶 DOGEUSDT.P: Next Move
🎨 RENDERUSDT.P: Opportunity of the Month
💎 ETHUSDT.P: Where to Retrace
🟢 BNBUSDT.P: Potential Surge
📊 BTC Dominance: Reaction Zone
🌊 WAVESUSDT.P: Demand Zone Potential
🟣 UNIUSDT.P: Long-Term Trade
🔵 XRPUSDT.P: Entry Zones
🔗 LINKUSDT.P: Follow The River
📈 BTCUSDT.P: Two Key Demand Zones
🟩 POLUSDT: Bullish Momentum
🌟 PENDLEUSDT.P: Where Opportunity Meets Precision
🔥 BTCUSDT.P: Liquidation of Highly Leveraged Longs
🌊 SOLUSDT.P: SOL's Dip - Your Opportunity
🐸 1000PEPEUSDT.P: Prime Bounce Zone Unlocked
🚀 ETHUSDT.P: Set to Explode - Don't Miss This Game Changer
🤖 IQUSDT: Smart Plan
⚡️ PONDUSDT: A Trade Not Taken Is Better Than a Losing One
💼 STMXUSDT: 2 Buying Areas
🐢 TURBOUSDT: Buy Zones and Buyer Presence
🌍 ICPUSDT.P: Massive Upside Potential | Check the Trade Update For Seeing Results
🟠 IDEXUSDT: Spot Buy Area | %26 Profit if You Trade with MSB
📌 USUALUSDT: Buyers Are Active + %70 Profit in Total
🌟 FORTHUSDT: Sniper Entry +%26 Reaction
🐳 QKCUSDT: Sniper Entry +%57 Reaction
📊 BTC.D: Retest of Key Area Highly Likely
📊 XNOUSDT %80 Reaction with a Simple Blue Box!
📊 BELUSDT Amazing %120 Reaction!
📊 Simple Red Box, Extraordinary Results
I stopped adding to the list because it's kinda tiring to add 5-10 charts in every move but you can check my profile and see that it goes on..

$IBIT downside to $33NASDAQ:IBIT looks like it's topping up here.
If we turn down here, it's likely that we sweep the April lows and fall further down to the lower support levels.
After we hit the bottom, lows should be in for a couple of years and we should see a nice bull run higher.

BlackRock's Bitcoin ETF Can Be Unfolding A Bullish ImpulseBlackRock's Bitcoin ETF with ticker IBIT made a massive rally in 2024, which can be wave 3 of an ongoing five-wave bullish impulse. Despite the recent decline at the beginning of 2025, it's still above 42 invalidation level, and as long as it's above that level, it can be wave 4 correction, so we may still see that 5th wave this year.
The Elliott Wave Principle is a form of technical analysis that identifies patterns in market movements. A bullish impulsive wave is one of the most important and common wave structures in an uptrend. It describes how prices typically move in the direction of the main trend. A bullish impulsive wave consists of five waves labeled 1, 2, 3, 4, 5.

IBIT | Key Support & Resistance Zones to WatchIBIT, the new Bitcoin ETF, is carving out a clear structure right now. If you’ve been following my updates, you know I only share setups backed by solid signals—and this one fits the bill.
🟢 Support Zone
The green box marks the first area where buyers have shown up and defended price. If IBIT pulls back into this zone and holds, it’s where I’ll look for signs of renewed demand—think clean higher‑lows on a 5‑ or 15‑minute chart, accompanied by positive CDV shifts and rising volume.
🔴 First Strong Resistance
Above the current price, the red box stands as the first major hurdle. Historically, these levels have prompted sellers to step in aggressively. A rally into this zone demands caution—watch for lower‑time‑frame breakdowns and volume confirmation before considering any short entries.
🎯 Trading Plan
Long from Support
Wait for a drop into the green box. If price forms a strong base there with LTF breakout confirmation, that’s my cue to enter long.
Short at Resistance
If IBIT reaches the red box and shows clear exhaustion—lower‑time‑frame structure breaks and CDV weaknesses—then I’ll look for a short opportunity.
Adapt with the Market
I will not insist on any bias. If price breaks above the red box with conviction and retests it as support, I will switch to a bullish view. If the green box breaks without retest, I’ll reassess and stay patient.
💡 Why This Matters
You’re not just following random boxes—you’re trading with a proven framework that has delivered one of the highest success rates you’ll find. Every level I share comes from careful analysis and live‑market testing. Stick with this approach, and you’ll trade with confidence rather than guesswork.
📌I keep my charts clean and simple because I believe clarity leads to better decisions.
📌My approach is built on years of experience and a solid track record. I don’t claim to know it all but I’m confident in my ability to spot high-probability setups.
📌If you would like to learn how to use the heatmap, cumulative volume delta and volume footprint techniques that I use below to determine very accurate demand regions, you can send me a private message. I help anyone who wants it completely free of charge.
🔑I have a long list of my proven technique below:
🎯 ZENUSDT.P: Patience & Profitability | %230 Reaction from the Sniper Entry
🐶 DOGEUSDT.P: Next Move
🎨 RENDERUSDT.P: Opportunity of the Month
💎 ETHUSDT.P: Where to Retrace
🟢 BNBUSDT.P: Potential Surge
📊 BTC Dominance: Reaction Zone
🌊 WAVESUSDT.P: Demand Zone Potential
🟣 UNIUSDT.P: Long-Term Trade
🔵 XRPUSDT.P: Entry Zones
🔗 LINKUSDT.P: Follow The River
📈 BTCUSDT.P: Two Key Demand Zones
🟩 POLUSDT: Bullish Momentum
🌟 PENDLEUSDT.P: Where Opportunity Meets Precision
🔥 BTCUSDT.P: Liquidation of Highly Leveraged Longs
🌊 SOLUSDT.P: SOL's Dip - Your Opportunity
🐸 1000PEPEUSDT.P: Prime Bounce Zone Unlocked
🚀 ETHUSDT.P: Set to Explode - Don't Miss This Game Changer
🤖 IQUSDT: Smart Plan
⚡️ PONDUSDT: A Trade Not Taken Is Better Than a Losing One
💼 STMXUSDT: 2 Buying Areas
🐢 TURBOUSDT: Buy Zones and Buyer Presence
🌍 ICPUSDT.P: Massive Upside Potential | Check the Trade Update For Seeing Results
🟠 IDEXUSDT: Spot Buy Area | %26 Profit if You Trade with MSB
📌 USUALUSDT: Buyers Are Active + %70 Profit in Total
🌟 FORTHUSDT: Sniper Entry +%26 Reaction
🐳 QKCUSDT: Sniper Entry +%57 Reaction
📊 BTC.D: Retest of Key Area Highly Likely
📊 XNOUSDT %80 Reaction with a Simple Blue Box!
📊 BELUSDT Amazing %120 Reaction!
I stopped adding to the list because it's kinda tiring to add 5-10 charts in every move but you can check my profile and see that it goes on..

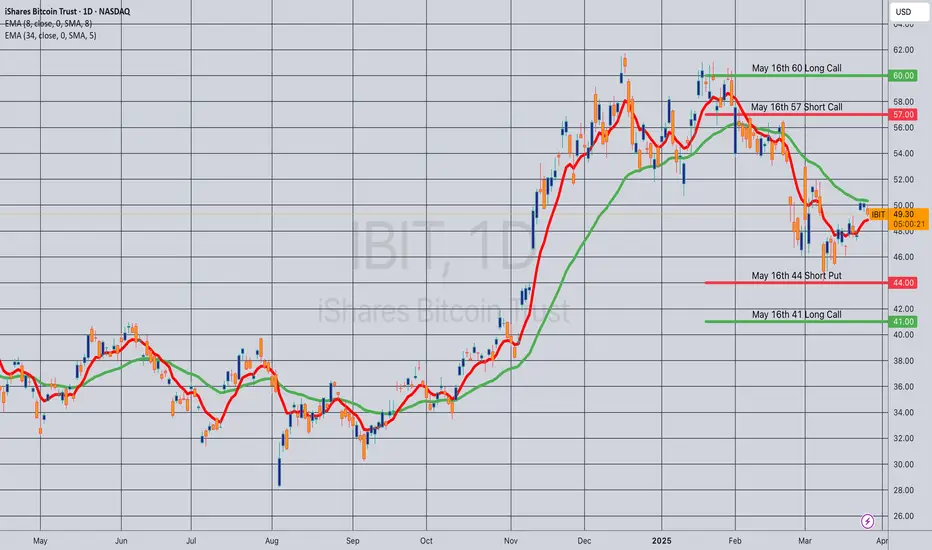
Opening (IRA): IBIT May 16th 41/44/57/60 Iron Condor... for a 1.02 credit.
Comments: Going neutral assumption here, selling the 25 delta's and buying wings 3 strikes out, collecting one-third the width of the wings.
Metrics:
Buying Power Effect: 1.98
Max Profit: 1.02
ROC at Max: 51.5%
50% Max: .51
ROC at 50% Max: 25.8%
Will generally look to take profit at 50% max, roll wings in on side test.
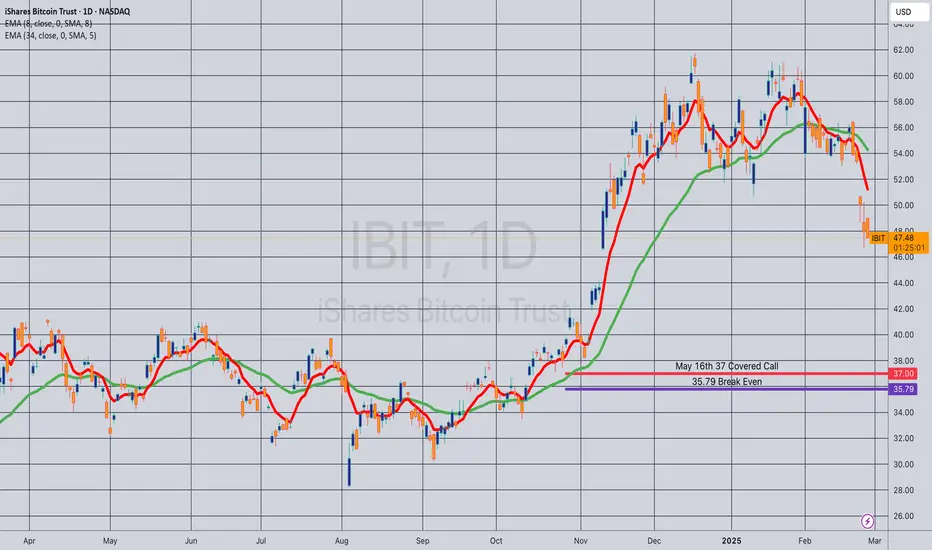
Opening (IRA): IBIT May 16th 37 Covered Call... for a 35.79 debit.
Comments: Laddering out a smidge here, selling the -84 delta call against shares to emulate the delta metrics of a 16 delta short put, but with the built-in defense of the short call.
Metrics:
Buying Power Effect/Break Even: 35.79
Max Profit: 1.21
ROC at Max: 3.38%
50% Max: .62
ROC at 50% Max: 1.69%
Will generally look to take profit at 50% max, add at intervals assuming I can get in at strikes/break evens better than what I currently have on, and/or roll out short call if my take profit is not hit.