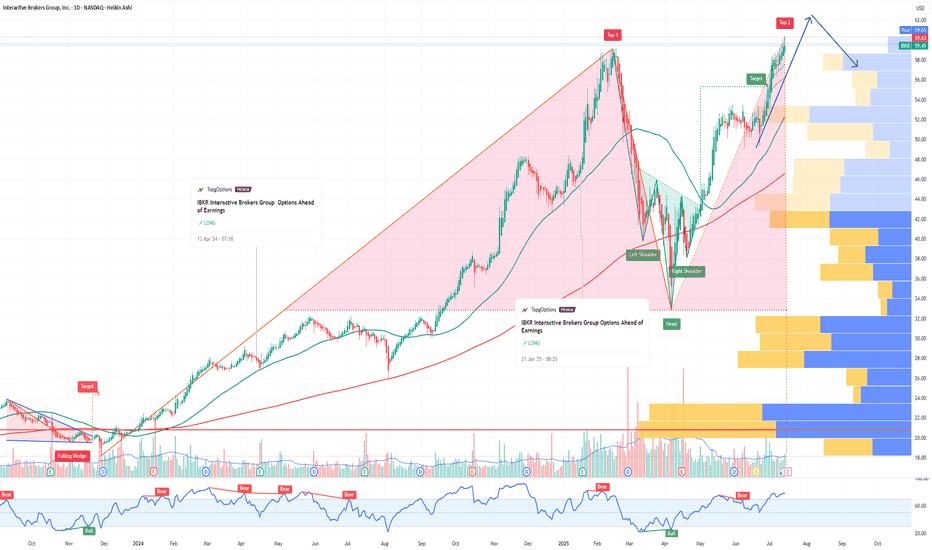
IBKR Interactive Brokers Group Options Ahead of EarningsIf you haven`t bought IBKR before the rally:
Now analyzing the options chain and the chart patterns of IBKR Interactive Brokers prior to the earnings report this week,
I would consider purchasing the 60usd strike price Calls with
an expiration date of 2025-9-19,
for a premium of approximately $3.90.
If these options prove to be profitable prior to the earnings release, I would sell at least half of them.
IBKR
RobinHood - Urgent News - Afterhours SelloffOn June 6, 2025, S&P Dow Jones Indices announced no changes to the S&P 500 index in its quarterly rebalance, marking the first such instance since March 2022. This decision notably excluded Robinhood Markets Inc., despite speculation that it might be included due to its market capitalization exceeding $20.5 billion and recent strong performance. Following the announcement, Robinhood's stock declined over 5% in after-hours trading
The next S&P500 quarterly rebalancing is set for September 2025....perhaps the next leg higher needs to wait until them
As of June 6, market close, Robinhood's stock is trading at $74.88, with a market capitalization of approximately $36.85 billion. The company has experienced significant growth, with a 365% increase in stock price over the past 12 months and a 50% surge to start 2025. Analysts project continued revenue and earnings growth, with an average one-year price target of $51.19 per share
We issued put option alerts to our members and shorted this live stream on Friday afternoon.
Why is HOOD still 1/3rd of SCHW? Wealth management remains the last bastion of success for Charles Schwab. Long-term cash, mutual fund, and retirement accounts create an enormous balance sheet, which accures value and reduces fees across the board. I'm hard pressed to see however how NASDAQ:HOOD will not inherit that class of customers as baby boomers pass on their generational wealth to the millenial generation. Do we begin to see a transition of assets from megacaps like NYSE:SCHW in the next 24 - 36 months? I'd say most likely.
IBKR Interactive Brokers Group Options Ahead of EarningsIf you havne`t bought IBKR before the previous earnings:
Now analyzing the options chain and the chart patterns of IBKR Interactive Brokers Group prior to the earnings report this week,
I would consider purchasing the 200usd strike price Calls with
an expiration date of 2025-2-21,
for a premium of approximately $3.90.
If these options prove to be profitable prior to the earnings release, I would sell at least half of them.
IBKR Interactive Brokers Group Options Ahead of EarningsAnalyzing the options chain and the chart patterns of IBKR Interactive Brokers Group prior to the earnings report this week,
I would consider purchasing the 135usd strike price Calls with
an expiration date of 2024-9-20,
for a premium of approximately $2.20.
If these options prove to be profitable prior to the earnings release, I would sell at least half of them.
Top Performing Low Volatile Stocks so Time to ActUnveiling the Top Performing Low Volatile Stocks - Time to Take Action! I just scanned 6800 top performers!
I am thrilled to share with you the results of our latest scanning endeavor, where we have discovered 18 top performing very low volatile stocks that are poised to bring you remarkable returns. So, without further ado, let's dive into the details and explore some exciting investment opportunities!
Our meticulous scanning of the market has revealed a selection of stocks that have consistently demonstrated low volatility while delivering impressive performance. These stocks not only provide stability in uncertain times but also offer tremendous growth potential. It's like finding a hidden treasure chest, just waiting to be unlocked!
Now, let's get down to business. I encourage you to consider the following stocks for your investment portfolio:
NHC (National HealthCare Corporation): With a strong track record in the healthcare sector, NHC has shown remarkable resilience and steady growth. Investing in this gem could be a healthy addition to your portfolio.
CSCO (Cisco Systems Inc.): As a leading technology company, CSCO has consistently proven its ability to adapt and innovate. Don't miss out on the opportunity to ride the wave of their success.
IBKR (Interactive Brokers Group, Inc.): With its cutting-edge trading platform and extensive global reach, IBKR offers a world of possibilities for traders seeking reliable investments.
PSH (Pershing Square Holdings, Ltd.): Managed by renowned investor Bill Ackman, PSH has been a consistent performer and could be a valuable addition to your investment strategy.
These stocks have demonstrated resilience, stability, and the potential for significant returns. While past performance is not indicative of future results, it's always wise to consider these gems when making investment decisions.
Now, I urge you to take action and seize this opportunity to enhance your portfolio. Conduct your own research, review the financials, and evaluate the potential risks and rewards. Remember, investing is about finding the right balance between risk and reward, and these stocks might just be the perfect fit for your goals.
Don't let this chance slip away! Take the necessary steps to explore these stocks further, and who knows, they might become the shining stars of your investment journey.
If you have any questions or need further assistance, please do not hesitate to reach out by sending posting a comment. We are here to support you and help you make informed investment decisions.
$IBKR forms weekly shark pattern NASDAQ:IBKR may be one of the leaders of this sector.
Back in February of 2022, the relative strength ration with AMEX:XLF showed a bullish divergence against the stock's price; soon after, the stock bottomed and since has rallied +50%.
The $80 level is key and the price has formed a shark pattern near it.
As the stock is in an uptrend, I'll wait for the breakout above $83.20.
For a daily analysis, please refer to the link I left of one of the analysts that I follow closely.
IBKR share reversal pattren spotted.Hello dear fellow traders !
Today i spotted a reversal bearish engulfing pattren in interactive broker stock, as we can see in chart that after a minor uptrend prices has reversed and form a candle which looks like sellers are totally in control and share can continue towards down trend and we can get 3% to 4% in profit's.
Thank you.....
Current setup on IBKR | Full explanation Let's take a look at IBKR and the current setup I'm waiting for.
As you can see on the chart, I have defined all those situations with one thing in common, massive drawdown in terms of time and decline and the subsequent resolution after we have a new all-time-high (ATH).
First Scenario: 65% decline and 2660 days until a new ATH / Followed by a 27% bullish movement from the previous high.
Second Scenario: 35% decline and 826 days until a new ATH / Followed by a 75% bullish movement from the previous high.
Third Scenario (current situation): 57% decline and 1316 until a new ATH / Followed by ????
The idea I have right now is that I'm expecting a similar resolution of the previous 2 scenarios based on past behavior. Am I saying this will happen? Of course not; my win rate is 50%; however, the risk to reward ratio I'm looking at on this setup is 2.5. In other words: for every dollar I'm risking, I'm aiming to make 2.5 dollars.
Alright, let's speak about the trading template: The pattern I observed in all the previous bull runs goes like this:
a) The price makes a new ATH
b) The price makes a 7 days consolidation
c) Entry above the consolidation, stop below, target at 255% movement from the previous high (i want to be conservative)
d) IF everything goes as expected, the expected time for this resolution is between 50 to 100 days.
To be clear, these are the levels I'm using:
ENTRY: 81.30
STOP: 73.85
TAKE PROFIT: 99.99
BREAK-EVEN: 89.00 (I will move my stop loss to the entry-level)
Thanks for reading! Feel free to add your charts or view in the comments.
Compression on IBKR. What to expect in both directionsToday, we will take a look at Interactive Brokers Group.
a) The main thing we can see on the chart is that the price is getting compressed between an ascending and a descending trendline.
b) Let's take a look at the Weekly Context
c) When a situation like this is happening, it is not a good idea to develop setups if we are inside this compression, at least for traders that look for trends to profit.
d) So, the main idea here is to wait for either a bearish or a bullish breakout before taking action.
e) For both scenarios, the idea is waiting for an ABC pattern or similar structure
f) If that happens, we will confirm both views with the price reaching the green or red horizontal line. above/below "B"
g) Targets are defined on the chart.
The main conclusion here is: Avoid compressions. Wait for the breakout first and for the consecutive correction before developing setups. Thanks for reading!
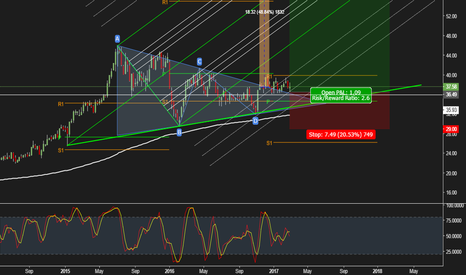
IBKR. Long Interactive BrokersHaven´t checked a single line of company´s reports or any related news. I´m just trying to find a new broker and checking the charts one by one to see if the market will or not dump the shares.
I found IBKR may be a good buy as it bounced of the Hagopian Line and has been flat for several weeks now, underperforming the market. Notice also the price broke former, 2008, All-Time-High at 35.93 and has been consolidating above it since November 2016.
Will long on opening, targeting 56 per share. Another possible long entries are: 35 which is a weekly pivot and a strong support level or 40, on a confirmed range breakout. My SL will be set below last year minimum at 29.50


