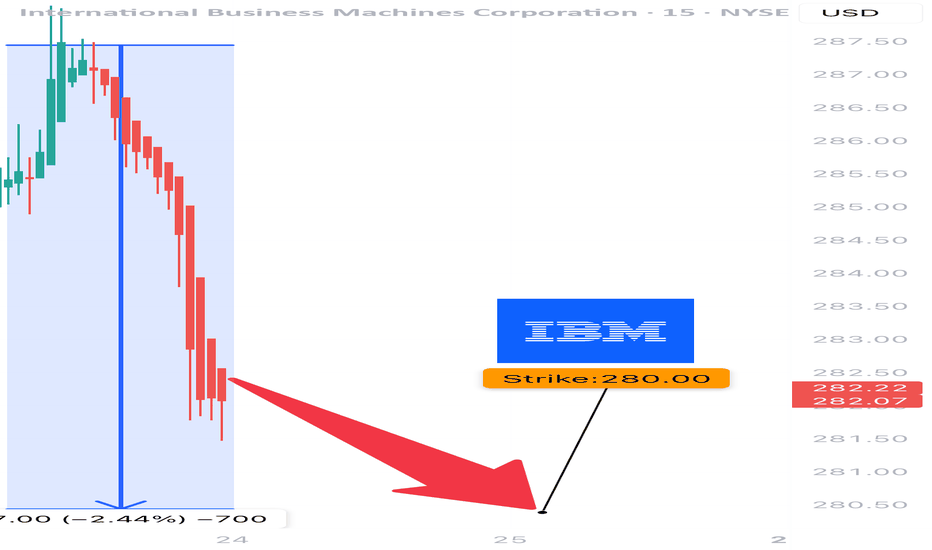
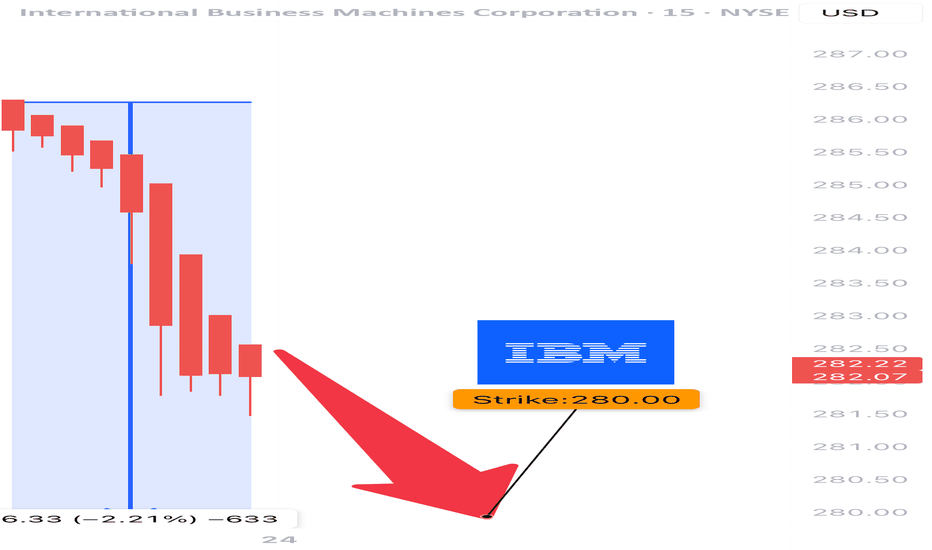
IBM Earnings Analysis Summary (2025-07-23)
🧨 IBM Earnings Trade Idea 🧨
Earnings Date: July 24, 2025 (AMC)
🧠 Confidence: 70% Bearish | 🎯 Expected Move: ~5%
⸻
🔍 Snapshot Summary:
• 🐢 Revenue Growth: Flat at +0.5% YoY
• ⚠️ High Debt: D/E ratio at 247.98 — compression risk
• ✅ Beat History: 100% past 8 quarters, but…
• 🤔 Forward EPS Projections: +81.7% looks too ambitious
• 🔻 Analyst Target Below Market Price: $273.36 avg (vs. $281.96 now)
• 📉 Pre-Earnings Drift: Trading below 20-day MA
• 🛡️ Options Flow: Bearish bias, heavy put flow at $275/$255 strikes
⸻
🧠 Strategy Rationale:
Despite a strong beat history, IBM’s fundamentals are weakening — growth is stagnant, debt is high, and guidance may disappoint. Institutions are hedging downside via puts, and recent technical action shows momentum fading.
⸻
📉 Earnings Trade Setup
{
"instrument": "IBM",
"direction": "put",
"strike": 280.00,
"expiry": "2025-07-25",
"entry_price": 6.30,
"confidence": 70,
"profit_target": 12.00,
"stop_loss": 3.15,
"size": 2,
"entry_timing": "pre_earnings_close",
"earnings_date": "2025-07-24",
"expected_move": 5.0,
"iv_rank": 0.60
}
⸻
💼 Trade Details (Simplified)
🔧 Parameter 🧾 Value
🎯 Strike $280 Put
📅 Expiry 2025-07-25
💵 Entry Price $6.30
🚀 Profit Target $12.00 (200% gain)
🛑 Stop Loss $3.15 (50% loss)
⚖️ Position Size 2 contracts
⏰ Entry Timing Before close 7/24
📈 IV Rank 60%
⸻
🎯 Exit Plan:
• 💰 Profit Exit: Close if premium hits $12+
• ⚠️ Stop Loss: Trigger at $3.15
• ⏱️ Time Exit: Auto-close within 2 hours post-earnings to avoid IV crush
⸻
🧠 Final Thoughts:
“IBM’s history says beat — but the setup says trap.”
If guidance stumbles, this low-beta name could slide, and bearish put flow is already sniffing it out.
📊 Are you riding the puts with this one, or fading the crowd? Let me know👇
Ibmbuy
IBM EARNINGS TRADE IDEA — BEARISH SETUP INTO EARNINGS
⚠️ IBM EARNINGS TRADE IDEA — BEARISH SETUP INTO EARNINGS ⚠️
📅 Report Date: July 25, 2025 (AMC)
🔎 Confidence Level: 70% Bearish Bias
🧠 Thesis: Fundamentals weak | Options market hedging | Price below key MA | Guidance risk elevated
⸻
🔍 Quick Breakdown:
• IBM is lagging in growth: TTM revenue up just 0.5%, margins OK but under pressure from high debt (D/E 248).
• 100% EPS beat history, BUT current price ($281.96) > analyst target ($273.36) → room for downside surprise.
• Heavy OTM Put flow ($275 & $255 strikes) + Put/Call skew suggests big-money hedging.
• Trading below 20DMA ($287.55) = bearish drift.
⸻
📉 OPTIONS TRADE IDEA (SHORT SETUP)
🛠 Play: Buy $280 Puts (Exp. July 25)
💵 Entry Price: ~$6.30
🎯 Profit Target: ~$12.00
🛑 Stop Loss: ~$3.15
⚖️ Risk/Reward: ~1:2.5
📦 Size: 2 contracts
📊 Expected Move: ±$5
📉 Support to Watch: $270 (Break = flush potential)
📈 IV Rank: 60 — juicy enough, but not extreme.
⸻
📍 Exit Plan:
• 🟢 Sell if premium hits $12+
• 🔴 Cut loss at 50% drawdown ($3.15)
• ⏱ Auto-exit 2 hours post ER if theta crush hits
⸻
📊 TL;DR (FOR THE CHART GANG):
{
"ticker": "IBM",
"direction": "PUT",
"strike": 280,
"expiry": "2025-07-25",
"entry": 6.30,
"target": 12.00,
"stop": 3.15,
"confidence": 70,
"iv_rank": 0.60,
"expected_move": 5,
"earnings_time": "AMC"
}
⸻
💬 Drop your thoughts — are you playing NYSE:IBM into earnings?
📉 Tag someone who loves short setups.
🔁 Repost if you like clean risk/reward with macro + tech + options alignment.
IBM Chart Forcast -- Bull From current Chan chart of IBM, we can tell, there is possible uptrend spike towards $145 -- previous high. Do leave comment if you have any idea about it's earning or financial information update. I am just reading from chart structure at this time. Overall, IBM is in a bull trend (short-mid-long term ) . If this time, it stand above $145, expecting next (2nd) price level @ 175 and 3rd price target @ $200.
IBM earnings todayIBM expected to report its Q4 earnings of $3.39 per share, a 60% YoY growth, from $2.07 per share seen in the same period a year ago.
Taking into consideration also the 14K Calls and less than 1K Puts from last Friday, i think that $136 should be the price target.
looking forward to read your opinion about it.
IBM: Inverse Head and Shoulders Opportunity?IBM - Intraday - We look to Buy at 125.98 (stop at 122.20)
A bullish reverse Head and Shoulders has formed. The formation has a measured move target of 134.63. Closed above the 50-day MA. The stock is currently outperforming in its sector. Further upside is expected and we look to set longs in early trade.
Our profit targets will be 134.53 and 138.15
Resistance: 130.00 / 138.00 / 145.00
Support: 125.00 / 120.00 / 115.00
Disclaimer – Saxo Bank Group. Please be reminded – you alone are responsible for your trading – both gains and losses. There is a very high degree of risk involved in trading. The technical analysis, like any and all indicators, strategies, columns, articles and other features accessible on/though this site (including those from Signal Centre) are for informational purposes only and should not be construed as investment advice by you. Such technical analysis are believed to be obtained from sources believed to be reliable, but not warrant their respective completeness or accuracy, or warrant any results from the use of the information. Your use of the technical analysis, as would also your use of any and all mentioned indicators, strategies, columns, articles and all other features, is entirely at your own risk and it is your sole responsibility to evaluate the accuracy, completeness and usefulness (including suitability) of the information. You should assess the risk of any trade with your financial adviser and make your own independent decision(s) regarding any tradable products which may be the subject matter of the technical analysis or any of the said indicators, strategies, columns, articles and all other features.
Please also be reminded that if despite the above, any of the said technical analysis (or any of the said indicators, strategies, columns, articles and other features accessible on/through this site) is found to be advisory or a recommendation; and not merely informational in nature, the same is in any event provided with the intention of being for general circulation and availability only. As such it is not intended to and does not form part of any offer or recommendation directed at you specifically, or have any regard to the investment objectives, financial situation or needs of yourself or any other specific person. Before committing to a trade or investment therefore, please seek advice from a financial or other professional adviser regarding the suitability of the product for you and (where available) read the relevant product offer/description documents, including the risk disclosures. If you do not wish to seek such financial advice, please still exercise your mind and consider carefully whether the product is suitable for you because you alone remain responsible for your trading – both gains and losses.
IBM Idea - Restoring TrendlineCurrently price is sitting just under a major trendline that can be drawn
Similarities can be drawn between a dip in the early movement of IBM and one that has occurred recently
Post this dip, the price rose and retook the trendline
I expect this to be the case again
Weekly Chart
IBM 1M The history of the corporation is worthy of respectInternational Business Machines Corporation is an American electronic corporation, one of the world's largest manufacturers of all types of computers and software, one of the largest providers of global information networks.
IBM owns more patents than any other technology company.
The story begins in the 19th century.
If you have been following us for a long time, you should notice that we decided to make a portfolio of ideas from assets in the stock market for the long term.
And of course, it would have been blasphemy if we hadn't written a review of such a powerful company as IBM.
The corporation has been actively developing for more than a century, making our life easier and better by introducing new technologies into it.
Looking at the chart, you can name one dark period in their history - this is the beginning of the 90s, when the price of IBM shares fell to a critical $10.
In the early 1990s, the mainframe market crisis began, which peaked in 1993. And you guessed it - the main developer of mainframes was the IBM corporation. In 1993 Many analysts talking about the complete extinction of mainframes just now, and about the transition from centralized information processing to distributed (although the last mainframe was turned off in 2013).
In 1993, IBM posted a $8bn loss - the largest in American corporate history at the time - and it was time for drastic action.
New gene. director Luis Gerstner decides to cut 20% of its employees, which is 60,000 people. It was the largest cut in American history, but helped the IBM corporation survive from 1993-1994. From 1993 to 2002, when Gerstner left the Big Blue, the company's market capitalization rose from $29 billion to $168 billion . This man is considered the savior of IBM.
The next interesting period is the beginning of 2013 , then a protracted correction in the value of IBM shares began, with which the price is now trying to start going up.
An interesting coincidence is that the price of Gold went into its 6-year correction also at the beginning of 2013.
Such a correlation might suggest that long-term investors have so much faith in IBM that they can view their stock as a defensive asset on par with Gold?)
By the way, below is our global thought in relation to Gold.
So, now let's talk about the prospects that we assume looking at the chart.
The maximum correction that we are now admitting is a fall to $110.50-112.50 , from which we expect a solid rise in the value of IBM shares.
We consider the critical level - $180
Fixing the price above this level will open the way for a long-term growth perspective to $500-530
If the market will be negative, and the price cannot break through above $180, then unfortunately, then it will already be necessary to look towards $70 per IBM share
What do you say, about such material, comes in?
Share your thoughts and expectations in the comments on IBM stock
IBM LONG SET UP (SIGNAL)TITLE : IBM BUY LIMIT ORDER
ASSETS : STOCK
SYMBOL : IBM
ORDER TYPE : (EP1) MARKET ORDER (1/2) position size (partial low lot entry)
(EP2) BUY LIMIT ORDER (2/2) (Now enter rest of position)
TF : Daily
ENTRY PRICE 1: $125.30
ENTRY PRICE 2: $122.30
STOP LOSS : $118.30 (70 PIPS)
TAKE PROFIT 1- $132.30 (70 PIPs)
TAKE PROFIT 2- $139.30 (140 PIPs)
TAKE PROFIT 3-$146.30 (210 PIPs)
STATUS : active


