Trend Exhaustion Detected – Bearish Structure AheadUS100 (NASDAQ) 30-minute chart as of July 26, 2025, with technical insights based on the visible elements.
🔍 1. Trend Analysis
Primary Trend: Uptrend (bullish structure)
The price has been respecting a rising parallel channel, marked by:
Ascending support (lower boundary)
Ascending resistance (upper boundary)
Market structure shows:
Higher Highs (HH)
Higher Lows (HL)
✅ This indicates continuation of bullish momentum until structure breaks.
📐 2. Market Structure Elements
Structure Type Label on Chart Price Zone (approx.)
Break of Structure (BOS) BOS (center-left) ~22,950
Higher Low (HL) HL (2x) ~22,700 (1st), ~23,050 (2nd)
Higher High (HH) HH (2x) ~23,150 and ~23,300
Resistance Labelled ~23,300–23,320
Demand Zones Labelled ~22,450–22,700
🔁 Break of Structure (BOS)
The BOS occurred after a prior swing low was broken, followed by a new higher high, confirming a bullish shift.
🧱 3. Support / Resistance Analysis
🔼 Resistance Zone
The price is testing strong resistance around 23,300–23,320
Multiple rejections in this area
Trendline resistance also aligns here
A rejection arrow is drawn, indicating potential bearish reaction
🔽 Support Zone (Immediate)
23,180–23,220: highlighted green box is a local support block
If broken, likely to revisit 23,000–23,050, or even down to 22,900 range
🟩 4. Demand Zones
Zone 1:
22,450–22,600: Strong bullish reaction historically — likely to act as a key demand if a deeper pullback occurs
Zone 2:
22,850–22,950: Validated with prior accumulation & BOS event
🧠 5. Key Observations
Price is at a critical inflection zone:
Testing a resistance zone
At the upper trendline of an ascending channel
A bearish reaction is projected (black arrow)
Possibly targeting the green support zone around 23,180–23,220
If that fails, demand at ~23,000 will likely be tested
Ichimoku Cloud:
Currently price is above the cloud → still bullish
Cloud is thin → potential weakness or upcoming consolidation
⚠️ 6. Trading Bias & Setup Ideas
✅ Bullish Bias (if price holds above ~23,180)
Long entries can be considered on bullish reaction from support
Target: retest of 23,300–23,350 or even breakout continuation
❌ Bearish Bias (if breakdown below support)
Short entry valid below 23,180 with:
TP1: 23,050
TP2: 22,900
A breakdown from the ascending channel would signal trend exhaustion
🔚 Conclusion
Current Price: 23,298.4
Trend: Bullish, but at resistance
Next move: Watch for reaction at resistance and support box below
Bias: Neutral-to-bullish unless the structure breaks below ~23,180
Ichimoku_trader

Fart Ichimoku Breakout Test📈 Checking bullish signals on the chart
✅ Positive signs:
- The price is stable above the cloud and the candles show the strength of buyers.
- Indicators such as RSI and trading volume are in a good position.
- The cloud broke with the body
First profit limit 1/451
Second profit limit 1/551
Limit of loss 1/320

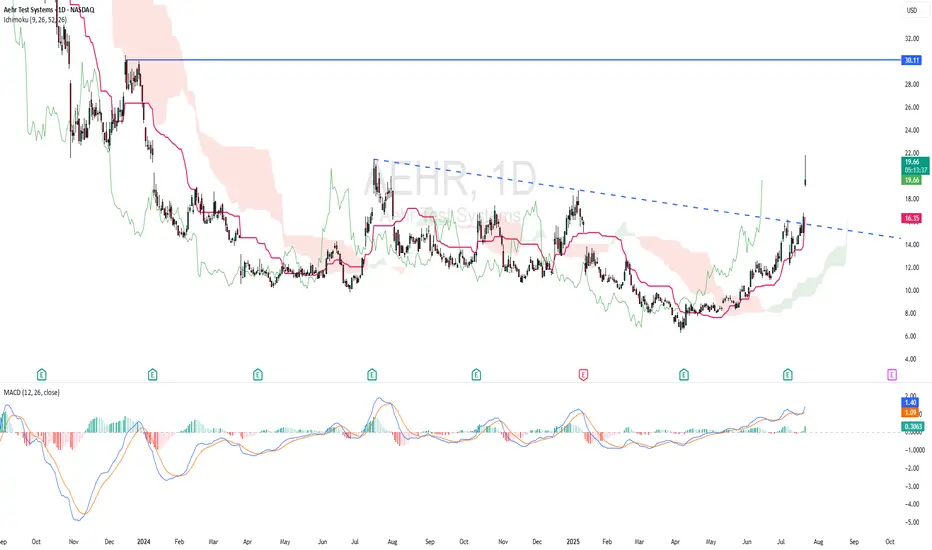
AEHR - RISING WINDOWTechnically AEHR is bullish as the stock made a strong rising window. Based on ICHIMOKU CLOUD, price is above cloud and chikou span is above candlestick - indicating bullish scenario. Kijun Sen is rising. MACD indicator showing bullish momentum.
ENTRY PRICE : 19.30 - 19.70
TARGET : 30.00 (potential almost 50% roi)
SUPPORT : 14.72
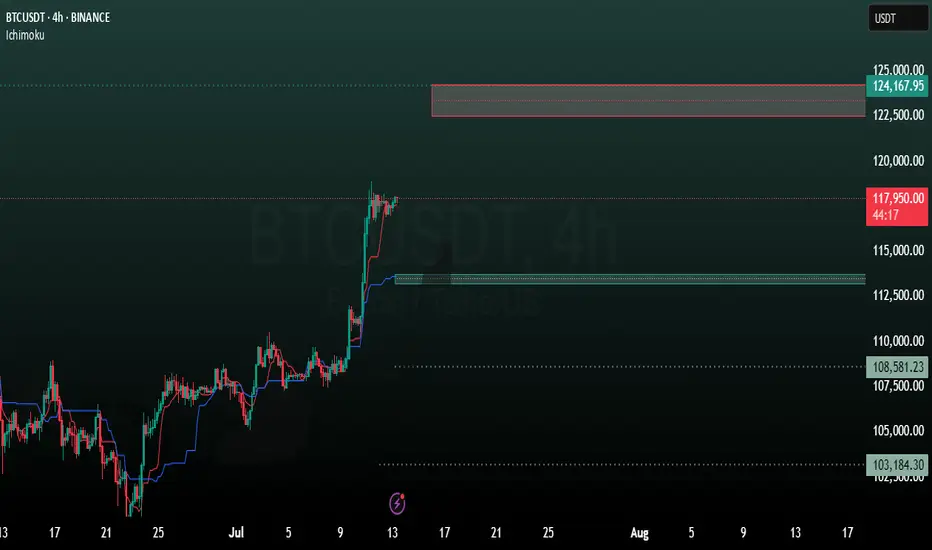
BTC 4H analysisBased on our previous analysis, BTC trend is still bullish. It reacts to our mentioned support level (98699) and moving to new resistance levels.
ICHIMOKU shows these levels as resistance:
122500
124000
137000
And these as support:
113788
113181
108581
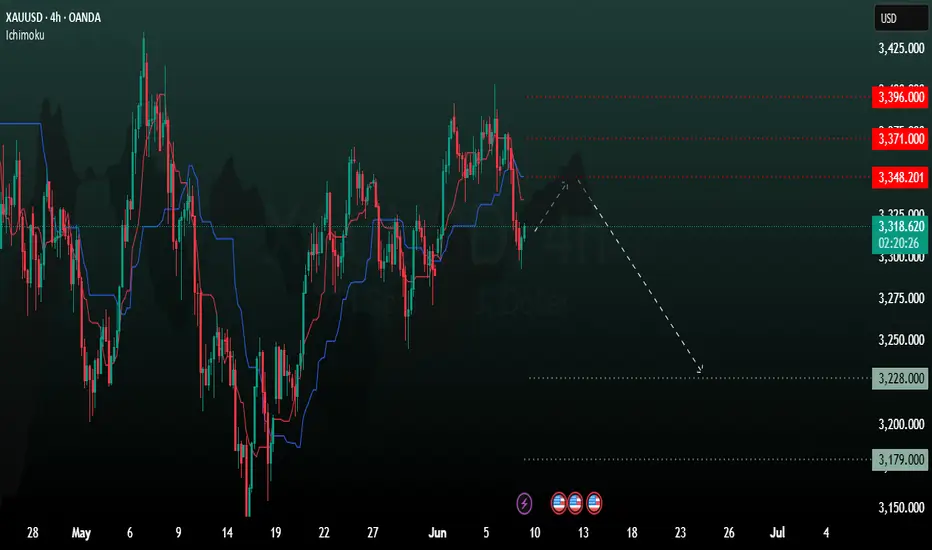
XAUUSD 4H AnalysisBased on Ichimoku, we expect short-term uptrend toward 3348 and after that we expect rejection from these levels and starting downward movement to support levels (3228-3179).
we consider all these levels as valuable zones for our trading so be cautious about the reaction of XAUUSD.
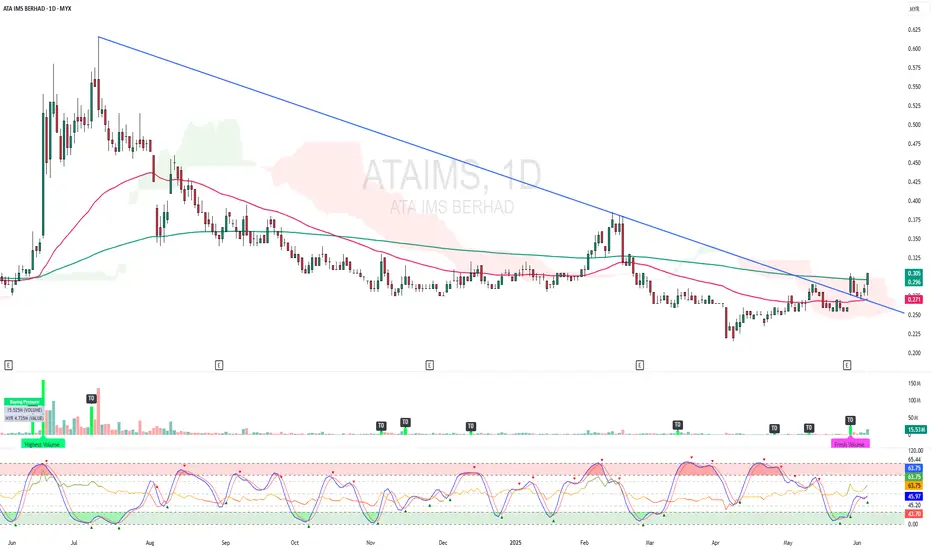
ATAIMS - BREAKOUT EMA 200 and CLOUD !ATAIMS - CURRENT PRICE : RM0.305
ATAIMS is bullish as the price is above EMA 50 and 200. The stock broke above EMA 200 and ICHIMOKU CLOUD on last FRIDAY (06 JUNE 2025) with high volume. Supported by technical reading in RSI heading upward, the stock may continue to move higher in the upcoming session.
ENTRY PRICE : RM0.300 - RM0.305
TARGET PRICE : RM0.340 and RM0.370
SUPPORT : RM0.270
MRDIY - Low RISK ?MRDIY - CURRENT PRICE : RM1.62
MRDIY is BULLISH because :
1. Price is above EMA 50
2. Price is above ICHIMOKU CLOUD
3. RSI is above 50
4. The high is getting higher and the low also getting higher
ENTRY PRICE : RM1.60 - RM1.62
TARGET PRICE : RM1.72 , RM1.80 , RM1.90
SUPPORT : RM1.51 (The low of bullish HAMMER candle)

XAUUSD 4H AnalysisGold is in its own correction wave.
The important resistance levels for gold is 3272-3353.
Based on ichimoku , we expect it to touch the support levels 3002-2977

ACHR - KUMO BREAKOUTACHR broke nearest resistance. There is a bullish divergence in MACD. Based on ICHIMOKU CHART, the stock is BULLISH because :
i) Price breakout cloud
ii) Tenkan sen already cross above Kijun sen recently
iii) Chikou Span is above candlestick
ENTRY PRICE : 9.33 - 9.40
TARGET : 10.37 and 12.75
STOP LOSS : 8.16

BTC 4H analysisIn the previous analysis, the zone of 70 was determining level for us, whether it was a correction or a downward trend.
BTC continued it's upward movement from near that area.
Now Bitcoin is near it's historical resistance area, this time the zone of 110 to 114 plays this role for us.
According to ICHIMOKU and according to previous analysis, Bitcoin tends to move to higher levels marked on the chart.

XAUUSDThe long-term trend of gold is completely bullish according to previous analyses, which still shows a strong bullish trend on monthly time frames.
We expect a correction in the chart during next week , but The long term trend of Gold is still bullish and we couldn't see any ICHIMOKU based divergence.
important support and resistance levels on the chart is highlighted.

Price drop warning based on historical patternsSo we had a lot of similarities in the CRYPTOCAP:BTC bullish cycle with the previous cycles. I believe it is logical that we will have some similarities in the correction. So I checked based on the Ichimoku indicator and I imagine such a pattern for the future trend of Bitcoin. But this is just one of the possible scenarios. Don't always be bullish. The market has two sides. So always have short trades in your plan. Be with the trend. Be safe.
happy Eid Al-Fitr

XAUUSD Daily AnalysisXauusd Analysis Based on Ichimoku
Gold maintains its bullish trend on higher time frames and has the potential to go to higher levels.
According to Ichimoku data, there is a possibility of a price correction on the chart this week.
The overt trend will remain bullish until the price goes below the $2,894 level.
Key Levels:
All important levels for probable trades have been identified. Monitor the price reaction to these levels.

BTC Explanationexplanation of previous BTC analysis.
our perspective is based on ichimoku and you see all we said about BTC is completely done!

XAUUSD 4H ANALYSISGold is still in its important resistance zone (2947) and try to break this level.
It tries to reach 3000 levels.
Gold overall trend is still bullish based on our previous analysis.
Consider all levels as a valuable SnR.
As usual we trade on all these levels.

BTC AnalysisAccording to past analyses, Bitcoin is in a range zone and should break this range along with the Ichimoku lines. We expect correction on this chart.
This support zone (70) is very important, it determines that we are in a downtrend or just a correction.

Gold Daily AnalysisGold trend is still bullish(based on Ichimoku) but we expect retracement during this week.
As long as gold does not break its important support at 2660, it will not be bearish.
Pay attention to the resistance and support levels marked on the chart.

GADANG - Turning BULLISH based on ICHIMOKU CLOUD ?GADANG - CURRENT PRICE : RM0.355
GADANG is changing trend from sideways to UPTREND. Take note that the high is getting higher and the low is getting higher.
The stock is BULLISH based on ICHIMOKU CLOUD because :
i) CHIKOU SPAN is above candlestick
ii) Price is above CLOUD
iii) CHIKOU SPAN is above CLOUD
iv) There is a bullish crossover (TENKAN SEN crosses up KIJUN SEN) - Personally i don't use TENKAN SEN and KIJUN SEN to trading or analysing.
ENTRY PRICE : RM0.355
TARGET : RM0.385 , RM0.410 , RM0.440
STOP LOSS : RM0.320
Notes : GADANG is a construction company. According to TA Research, the group's construction order book stood at RM1bil as of end-November 2024. The company is syariah compliant.

NATGATE - 11 RECORD SESSION LOWS ?NATGATE - CURRENT PRICE : RM1.79
On 02 August 2024, the stock made a FALLING WINDOW . The selling pressure continues until price starts to stabilize and create a double bottom support level near RM1.65 - 1.68.
On 29 October 2024, the share price closes above the top of FALLING WINDOW resistance level indicates strong bullish momentum. At the same time, the share price also successfully closed above ICHIMOKU CLOUD (after trading below KUMO almost 3 months). This two scenario gives strong bullish outlook for NATGATE. From here, the stock continue moving upside until RM3.03 (ALL TIME HIGH) - upside movement of 40% from the breakout point on 29 OCTOBER 2024.
After reach ALL TIME HIGH, the stock made an EVENING STAR pattern. From there, the stock starts declining and makes 11 RECORD SESSION LOWS.
Here is the important points to have a look. We can expect a rebound from current price as there are some hints given by chart :
1) 11 RECORD SESSION LOWS creates an OVERSOLD situation (The record session topic is discussed by STEVE NISON in his book - BEYOND CANDLESTICK , PAGE 121 - 127)
2) The last two session was bullish HAMMER - the long lower shadows give hint that potential bottom had reached and the bears are getting tired.
3) Price bounce from the previous DOUBLE BOTTOM support level area near RM1.65 - RM1.68 indicates that the BULLS are aggresively buying the shares near the support level.
In conclusion, as a aggresive trader, this is an oppurtunity for me to buy the stock at price RM1.79 - RM1.81. If as expected the share price starts rebound higher, i would take my profit at RM1.95 (+8%) and RM2.05 (+14%). My support level will be RM1.68 (the low of bullish hammer). My time frame for trading this stock is only one month.
ENTRY PRICE : RM1.79 - RM1.81
TARGET PRICE : RM1.95 , RM2.05
STOP LOSS : RM1.68
TIME FRAME - Not more than ONE MONTH
TAYOR !

AUMAS - Positive corelation with GOLD price movement ?AUMAS - Current price : RM0.890
AUMAS is bullish as the share price is above 50-day EMA. Note that the price breakout ICHIMOKU CLOUD on 31 JANUARY 2025 with high trading volume.
Gold future price surge to new high due to uncertainty and weak global sentiment. AUMAS is engages in gold mining business in Malaysia. The share price have a positive corelation with gold price movement. As such, i expect the share price may move higher in the upcoming session.
ENTRY PRICE : RM0.890
TARGET : RM0.980 (+10%)
STOP LOSS : RM0.820 (-7%)
Notes : The company was formerly known as Bahvest Resources Berhad and changed its name to AuMas Resources Berhad in December 2024. AuMas Resources Berhad was incorporated in 2004 and is headquartered in Tawau, Malaysia.

XAUUSD Daily AnalysisGold continues to its predicted bullish movement.
In annual analysis at the beginning of the year, I emphasized that gold will set new ATH.
Last week, gold prices hit our analytical target and the upward movement will be continued.
I will identify new key support and resistance levels for coming weeks.

XAUUSD Daily Analysis
According to our previous analysis the gold is still in its up trend.
Price is near to important resistance levels.
Until it goes below the support level
(2655), it cannot be said that a downtrend has begun.

XRP/USDT Daily Chart Summary (Ichimoku Cloud)Strong Uptrend: XRP is trading above the Ichimoku cloud, confirming a strong bullish trend with reliable support.
Breakout Momentum: A breakout from a triangle pattern, supported by high trading volume, signals the potential for further upward movement.
Key Levels: Resistance at $3.00 is approaching, with $1.00 remaining a critical historical support level.
RSI Insights: The RSI above 70 indicates strong momentum but suggests potential short-term pullbacks due to overbought conditions.
Volume Surge: Increased volume reinforces bullish confidence, supporting a possible continuation of the rally.
Historical Context: External factors like political events are overlaid on the chart, adding an interesting dimension to market sentiment.
Outlook: XRP could test $3.00 in the short term, with the potential for new highs if it breaks resistance. A healthy correction may occur due to overbought RSI before targeting $3.50-$4.00.
KRAKEN:XRPUSDT
