Ichimoku long setup: EURUSDPrice is trading inside a mother bar. Future kumo is thick with 2 flat spans. Entry was made based on CD. Trade is monitored once every 4H based on ADX.
Ichimokuchart

Ichimoku short setup: CADCHF On the H1 TF, all the Ichimoku signs are bearish. This is a kumo breakout trade with confirmation from secret indicator.

Looking to short GOLD according to Elliot waveSince october 2018, OANDA:XAUUSD have been moving upward, now testing $1300 level.
In a weekly analysis point of view, we can smell a reversal signal (maybe short). This week just closed with an inverted hammer candlestick wich indicate more selling pressure.
On the weekly time frame, I'm looking for an Elliot wave 3rd impulse. I have combine Elliot waves theories and Ichimoku indicator for analysis. We can see 2 waves have already been formed. The price rejection (inverted hammer) at the Senkou span B level also votes for a bearish signal. The 3rd impulse (red line) is forecast if the Elliot waves theory is validated. Meanwhile, we might get a light pullback before going long (green line).
We will have a clearer mind next week at the close of the next candle to this inverted hammer.


Ichimoku short setup: USDCADOn the daily TF, we have a bearish tenkan-kijun cross, chikou span is below price and a bearish kumo twist. Price is basing along the kumo edge and is a little far away from kijun. Give this pair some time and we should begin to see the start of a new bearish trend.

Ichimoku short setup: NZDCADThe daily TF is giving hints that a new bearish trend is about to kick in. A bearish kumo twist is to be expected within the next few days.

Ichimoku short setup: EURSGDOn the daily TF, all the Ichimoku signs are bearish. Price is basing at a 52 week low. Traders may place a sell limit order on this pair to get a better entry price.

Ichimoku long setup: AUDUSDPrice is basing under the kumo. There is bullish tenkan-kijun cross and the future is bright. Similar to AUDNZD pair, the main concern is that the price is a little too far from the kijun.

Ichimoku long setup: AUDNZDPrice is basing under the kumo. We have a bullish tenkan-kijun cross and a bright future. %R confirms the strong bullish momentum. The only concern is price is a little too far from the kijun.

Ichimoku long setup: NZDJPYOn the daily TF, price is basing off the kijun. We are witnessing the making of a roll-over. Tenkan is pointing upward while the kijun is flat. I am expecting price to reach the kumo bottom, at the very least.

Ichimoku short setup: EURGBPOn the daily TF, we just had our bearish tenkan-kijun cross. We have a very thick future kumo but span A is pointing downward, signaling a potential bearish kumo twist in the near future. The last daily candle was a bearish candle with a long upper wick. Strong bearish momentum is confirmed by the %R. Price is currently at a strong support, but my bias for this pair is still bearish.

Ichimoku short setup: GBPNZDPrice is moving along the kumo edge aka kumo bounce. I am expecting the price to make a minor correction before hitting a bull run.

Ichimoku short setup: CADCHFOn the daily TF, price is rejecting off the kijun with a bearish spinning top. All the Ichimoku signs are bearish with confirmation from %R. Price has pulled back to the previous support turned resistance. Entry was taken based on H4 FFB.

Ichimoku short setup: USDCHFA few days ago, I stated that we are expecting a bearish kumo breakout within the next few days and so it did. Check out the link below:
On the daily TF, all the Ichimoku signs are bearish. Span A and B are both angling downward at 45 degree. Chikou span has broken free from the kumo. I am expecting a home run for this pair.

Potential Short Trade On GBPCHF Hourly ChartWe Can notice Here some useful info, which can help us Make the Right Decision
Here's What We See:-
-In the last Move ,Price Broke Kumo Cloud ,Then Retest it & reverse making LH & LL.
-Tenken & Kijunsen Now Out Of Th Kumo Cloud and Move Donwside Acting as a Dynamic Resistance to Price
-Chikouspan Also Broke Price & Kumo Cloud, it has a strong resistance which is "Price" itself
-We also can't forget our Future kumo bearish Overview to gave as an extra confirmation
-price Re-test the last Broken Support Structure,With Kijunsen Which is acting as a Resistance Level
-If Price Close below The Broken Structure and Tenkensen , We may have a trigger to Our New Short position
-Be Sure To Be ready
-Thanks a lot

Potential Short Trade on GBPCHF Hourly ChartWe Can notice Here some useful info, which can help us Make the Right Decision
Here's What We See:-
-In the last Move ,Price Broke Kumo Cloud ,Then Retest it & reverse making LH & LL.
-Tenken & Kijunsen Now Out Of Th Kumo Cloud and Move Downside Acting as a Dynamic Resistance to Price
-Chikouspan Also Broke Price & Kumo Cloud, it has a strong resistance which is "Price" itself
-We also can't forget our Future kumo bearish Overview to gave as an extra confirmation
-price Re-test the last Broken Support Structure,With Kijunsen Which is acting as a Resistance Level
-If Price Close below The Broken Structure and Tenkensen , We may have a trigger to Our New Short position
-Be Sure To Be ready
-Thanks a lot

Potential Buying Opportunity On EurJpy on Hourly ChartWe Can notice Here some useful info, which can help us to make a nice Long Trade
Here's What We See:-
-In the last Move ,Price Slightly Close below kijun sen, but Moved Higher Quickly and Closed above it
-Tenken & Kijun sen Support Price Nicely to move upward
-Chikouspan Test Tenken-sen and bounce from it
-Chikouspan Also Have a Nice Strong Support, which is "Price" Itself
-Kumo Cloud is Bullish and Supported Price nicely to Continue to Move upward
-After Price Close above tenken-sen , We Can make a Decisioned to get Long with a nice RR
-Be Sure To Be ready
-Thanks alot

XHVBTCScalping Alts right now... This is just an example how great the Richimoku + Kumo Waves work together. Will take profit soon :)
Used indicators: Richimoku + Kumo Waves
P.s. hit me up if you want to test my high profit indicators.

Bullish engulfing in up trendThere has been a bullish engulfing candlestick pattern on top of a strong support level in an uptrend after a retrace.
Also the price has broken above the kumo as well as the chikou signaling high probability of continuing uptrend.

EUR/AUD - Ichimoku Short Sell SetupThis pair has stalled out a little bit here and started to move sideways. I am waiting on a move higher to test resistance before looking for a sell to the down side. If we can get a rise to kijun sen and a good rejection candle form I will look to enter this sell. If we break through that resistance or fail to raise that high, this setup may become invalidated.

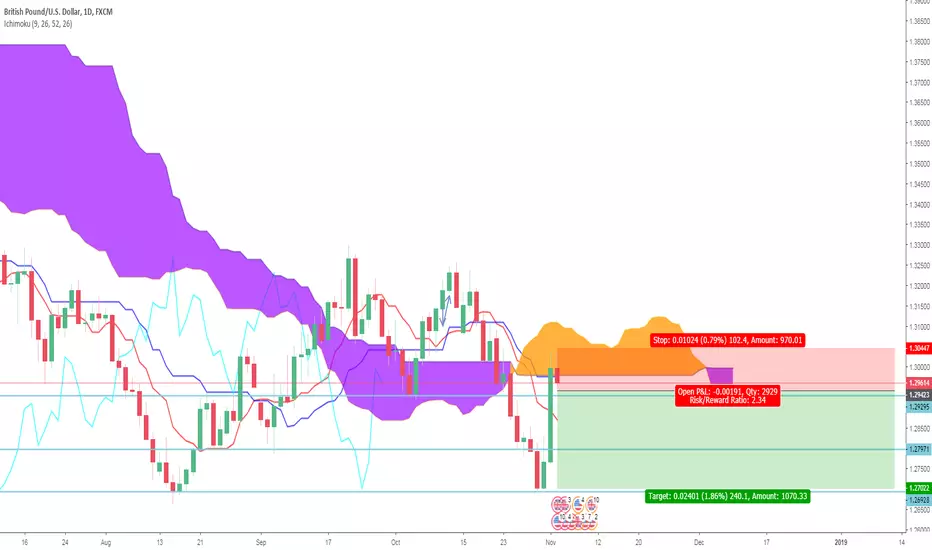
GBP/USD - Ichimoku Short Trade SetupI'm moving to the daily chart for this analysis, so this will be a swing trade instead of our typical short term trade. We rose up at the end of last week and met the kumo cloud and kijun sen acting as resistance. If this resistance holds we can look for a sell. I am setting a sell entry below our current candle, but as an alternative I may take a sell at the kumo cloud if we have a good rejection candle. I'm setting a TP level at our previous structure low. If we fail to get a good rejection candle or break lower, this setup may become invalidated.
BTCUSD BOTTOM! LONG till NOV 5th!So we finally hit the 62XX and only for less than 1 hour! chart really says it all! THE BULLS ARE READY TO RALLY! NO SHORTS till 69XX

Ichimoku Weekly Analysis Possible targets for the coming week using Ichimoku theory (daily time frame).
