Ichimoku Cloud


If it gets above its cloud then 6.76 is possible.That is a SSB line that could be reached.
The chikou span would be free to go up.
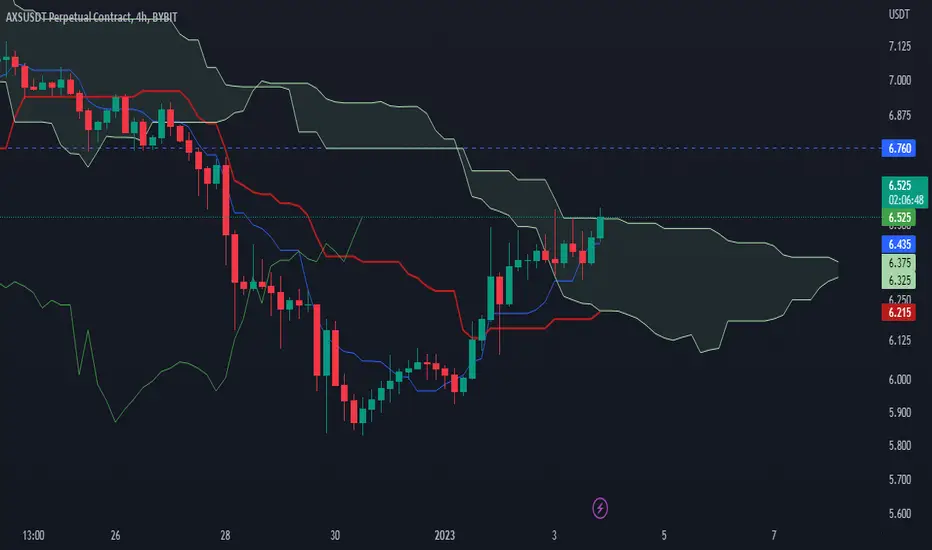
Could go up to its daily Kijun SenCould go up to its daily Kijun Sen.
The chikou span should get above its cloud.

Could go up to its daily Kijun SenIn H4 it is uptrend.
In daily it's not but it could get up to its daily KS.
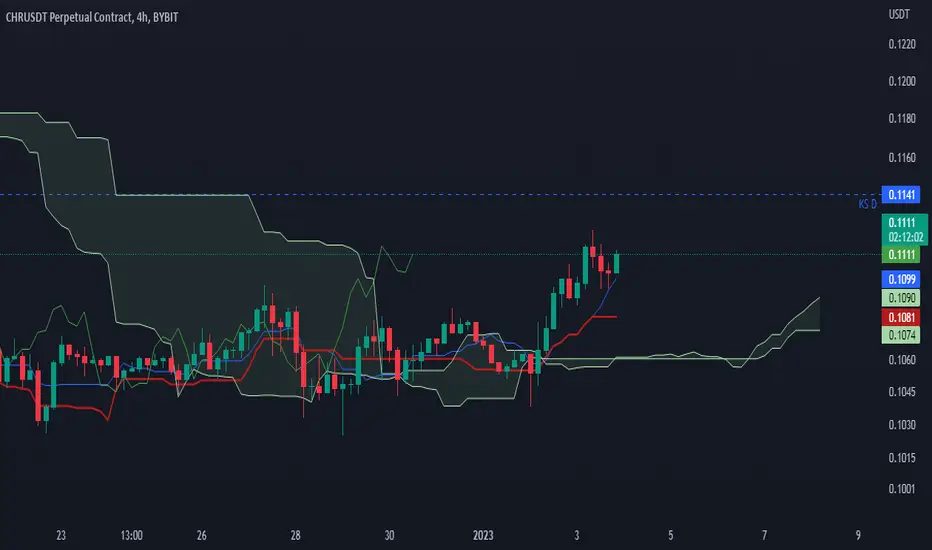
Getting above its daily cloudGetting above its daily cloud.
We have to wait to see if the price closes above it.

The price might go back to 16203The price has got below its daily Ichimoku forecast line.
The chikou span has got below its daily Ichimoku forecast line.
BUT : the chikou span is above its Kijun sen line.
The price might go back to 16203 = The low of the japanese candlestick from which the Daily IFL was drawn.
Possible resistance before going to 16203 is 16432.8 = the kijun sen level below the chikou span.
Current price = 16668.

Might be interesting to shortThis asset might be intersting to short.
Ideally one should wait for the Chikou Span to get below its cloud.

An interesting zone that could be tradedHere is an interesting zone that could be traded.
The Chikou Span in still in the cloud.
The better would be to wait for the CS to get below its cloud.
But there might be a shorting opportunity here.


Next possible trading zoneIf the price keeps on going up then this zone could be a good one for trading.

Setups for MondayOrange pairs: AUDNZD, AUDCHF, NZDCHF, GBPCAD, EURAUD, GBPNZD, NZDCAD, EURNZD, EURCAD
Green pairs: USDCHF and GBPCHF
Purple pairs: AUDCAD and EURGBP
*
Orange = Moving away or getting slowly to our trade, not suitable for a trade yet unless it's giving a little bit more in our direction
Green = Close to a trade, needs a break for anything serious
Purple = Very close to a trade! Needs a retest or a break of exhaustion point for an entry.
Have a great week all! :)

Next key levels Next key levels if the price keeps on going up.
In paralell the Bitcoin is trying to get above its H1 Ichimoku cloud.

H1 Ichimoku Forecast Lines.Here are the latest H1 IFL.
If the price gets below its IFL and if the Chikou Span gets below its one then a return to 16728 could occur.


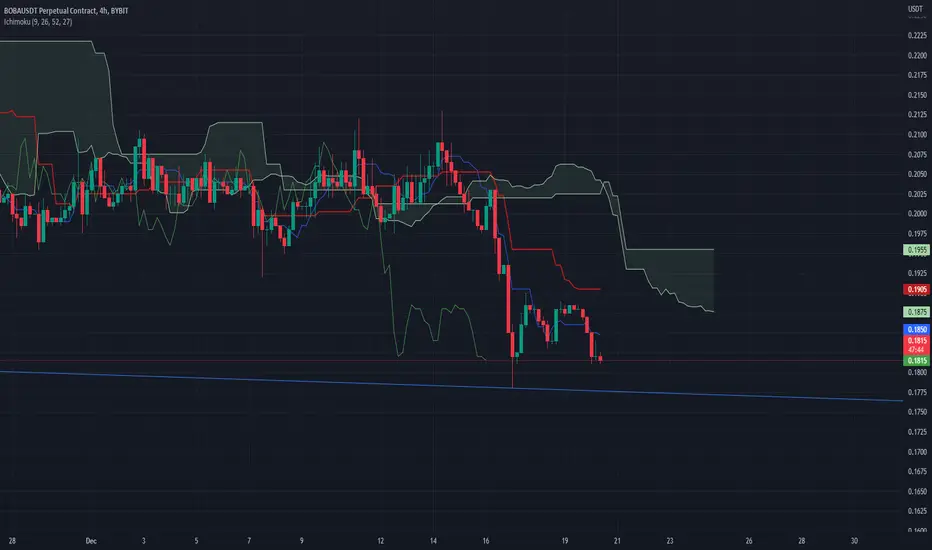
The Chikou Span has got below a trendline.If it keeps being under this trendline then the price could go down to 0.9


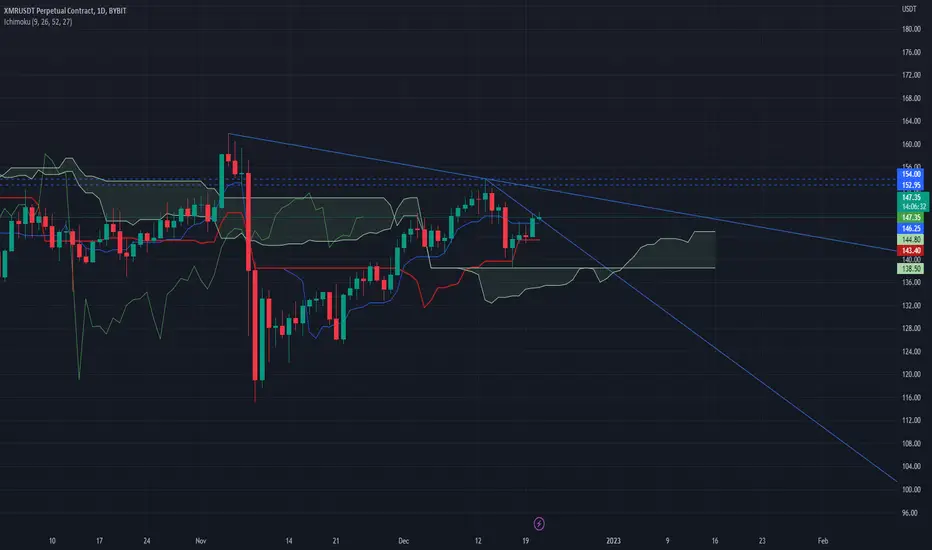
Daily trendline viewed in H4.Will the price go downward to the trendline ?
If yes then will it get below it to dump ?

H4 trendline viewed in H1Will the Chikou Span get above the trendline ?
If yes, will the price pump ?

H1 trendline viewed in M15Will the price go up to the trendline ?
If yes, will it get above it and pump ?

H4 trendline viewed in M15Will the price go down to the trendline ?
If yes, will it get below it to dump ?
The Chikou Span is trying to get below its Kijun Sen.

Daily trendline viewed in H4.Will the price go down to the trendline ?
If yes, will it get below it and dump ?