A Golden Opportunity - XAU/USD Ichimoku Long TradeGold hit an all time high before falling down and testing support.
It's been moving sideways a while now an is finally starting to show some more bullish signs.
We've risen up and above the kumo, we're close to a kumo twist, and chikou span has started to rise.
These are all beginning signs that we may try to establish another bullish trend.
As the second wave of Covid starts to hit accross Europe we may see gold start to push upward again.
I'm looking to enter on a break above recent resistance.
I've drawn out an overall target of recent price structure highs as well as some partial take profit levels along the way.
If we fail to break resistance or if our bullish confirmations change, this setup may become invalidated.
Ichimoku Cloud

GBP/USD Rebound - Ichimoku Long SetupThis pair finally broke up and beyond the resistance it's been stuck at.
We're in a nice bullish trend and I'm looking for a good entry to try and get long.
I've drawn out this setup expecting a drawback to test our previous resistance level which could now act as support.
When you trade ichimoku the concept is pretty simple, wait for a trend to establish, then look for a good place to get into.
From a high level that's all I'm looking to do in all trades, including this one.
I've drawn out some partial profit levels to look for if we can indeed get a drawback and good entry.
If support fails to hold, or if our bullish confirmations change, this setup may become invalidated.

Potential NZD/USD buy signal Here's another free signal for y'all
Entry point:0.66433
SL:0.65996
TP:0.67580
R/R:3/1
As you can see a bullish flag pattern has formed on the 4 hourly and has broken the support after the 3rd touch so we will be looking to go long.Also, the uptrend can be confirmed by the twist of the ichimoku kumo cloud which has twisted from bearish to bullish on the 4 hourly.
Taking this trade in my sleep and hoping to see profit when i wake up , wish me luck lol!
I'll keepy you updated when I wake
Feel free to like , comment , share and follow my page.

GBP/JPY time to go long When I trade I tend to use the higher time frames as I believe they are more accurate. The time frame I will be using in this trade is the 4 HR and the daily.
As you can see it is above the ichimoku cloud which is showing bullish on the daily time frame and it has also crossed the monthly resistance level and is signalling an uptrend , and has formed a flag pattern on the 4 hourly after the third touch I will be looking to go in for a buy trade.
Please feel free to like comment and follow will be much appreciated. Thanks :D
R/R:3:1
SL:139.385
TP:141.065

Short (1H, Timeframe)The next candle is important
if it stay below the Kumo, we can open sell position
Ichimoku Sell signal will be really strong then

EUR/JPY Long Term Ichimoku Short TradeThe Euro has been on a tear fora while now and it may finally be losing some steam here.
This pair broke out bearish last week and now I am looking to hop into the bearish trend for as long as it will hold.
I've set my entry at what should be close to tenkan sen as I'll be looking for a rejection there to enter the sell.
I've drawn out several targets to take partial profit at on the way to my overall target.
If we fail to reject at tenkan sen or if our bearish confirmations change, this setup may become invalidated.

Swiss Fade? USD/CHF Ichimoku Long TradeThis pair has been ranging for a while now and I'm watching to see if we have some upside potential.
I want to see price break recent price structure resistant as my trigger to buy as you can see from my entry line in yellow.
Overall we have a good risk to reward here but it is a longer term play if it does activate.
I've drawn out several partial take profit levels on the way to what would be my overall target.
We're close a bullish kumo twist which may help confirm that we are about to try and head higher.
If we fail to break the price structure resistance at my entry or if our bullish confirmations change, this setup may become invalidated.

EUR/USD Ichimoku Long Term ShortThis pair formed a lower high last week before finally crashing through the kumo and closing below it.
We are on the verge of a bearish kumo twist, and chikou span is below price with plenty of room down below.
I am watching for a break of this recent price structure at the bearish breakout we had to enter my short position.
We're at an interesting place here considering how long of a bullish run this pair has been on.
It's left plenty of room to the downside should the dollar decide to fight back a little.
I've drawn this out as a very long term trade with multiple partial take profit levels to aim for along the way.
If we fail to break below price structure support or if our bearish confirmations change, this setup may become invalidated.

Ichimoku Cloud bullish breakout 1D TFI wish i had time Friday to scan for this. This is a classic ichimoku bullish breakout.
If you dont know much about Ichimoko I highly suggest you learn it as it will increase your trading consistency.
Note that I am using Heikin Ashi candles to eliminate noise during the breakout. Very important!!!
Here is the breakdown of what is needed for a Kumo cloud breakout.
1) Lagging span crosses cloud
2) Conversion line (blue) crosses base line (red) previous to price breaking the cloud
3) price CLOSES above the cloud
4) span A (green line) crosses above span B (red line)
this stock meets all criteria.
I will be buying heavily on short term call options on this on Monday and a light position on longer term call options (sept expire)
My predictions:
1) Most likely: Continued above average volume. prices increases greater than the ATR.
2) What may happen: price may pull back a little but see resistance of the on the blue conversion line at lower time
frames (ie 4H)
3) Worst case: Price closes below the 13 SMA on the 1 day chart. SELL.
you will notice that the stock has been consolidating since about 6/23 and has broken the upper resistance and trended higher. So what not buy on the break of resistance???? Simple, False breakouts. Ichimoku is the near fail safe to save you from buying into a false breakout and losing money and i only buy breakouts upon confirmation.... 100% confirmation of the 4 principles above for buying a break out.
Sure you dont catch all of the run, but the odds are very high in your favor for a nice return.
So when will i sell the options??
1) If the price rises like mad and pulls drastically away and above the 1D 13 SMA. (~10% above 13 SMA)
2) when price closes below the 13 SMA on the 1d Chart. I'm out

Test Trade 8/100Long ichimoku trade, first trade of this week.
Lost this one last week, 4H still not perfect. let's test ;-)

GBP/CHF Major Ichimoku Short Opportunity We've been playing around this price awhile now and seem to be pushing back down to test this level one more.
If we can break and hold below this price structure level we should get a much further push down.
This may happen pretty quick after market open so we'll need to watch it closely.
I've drawn out multiple targets on the way to my overall target at a previous kumo twist.
If we fail to break lower or if our bearish confirmations change, this setup may become invalidated.

NZD/USD Kiwi Shorts - Ichimoku Price Structure SellThe Kiwi has been pushing lower pretty easily since our initial kumo breakout.
We are in the middle of a bearish engulfing candle and approaching previous price structure support.
If we can break that support then it will confirm our short bias.
I've drawn out a couple targets I'll be aiming for.
I don't always make this clear, but I wanted to make sure everyone following my analysis knows that I leave some of my position running even past my targets until I see my confirmations change.
This is one simple tip you can use to give yourself a slight edge over time if you're a trend trader.
If we fail to break and hold below support at the entry I've drawn, then this setup may become invalidated.


NZD/USD: Selling NOW @ market priceNZD/USD is priting new lows. The pair is also below the pivot level.
The Lagging Span on the 15-min timeframe just broke the current support.
I am targeting 2 fib levels lower, as shown.
***Trade at your own risk***

how to use ichimoku clouds indicator for better trading how to use ichimoku clouds indicator for better trading
ichimoku clouds or named also ichimoku kinko hyo all in one indicator

JPY Index - Short JPY Bias Persists for the MomentI am maintaining a short JPY bias based on the Heiken-Ashi down candle on the 4hr chart.

USDollar Index - Holding Long for NowHolding a long index bias based on persistent Heiken-Ashi up candles on the 4-hr chart.

Test Trade 5/100First trade of this week, adjusted the SL level a bit to get a better r:r on our trades.
Let's see how it works out.
After 4 trades: +2,77%
2 W
1 B/E
1 L

USD/JPY Price Structure Breakout SetupThis pair is attempting to start a bullish trend but has been struggling to break through the price structure we can see just left of where price is currently at.
It failed to break through the kumo there in the past so I really want to see that level broken to consider a long.
Typically when we do break through a level like that we will see a push up and through, then come back down to test it as support.
We can look for entries based on which style traders are more comfortable with.
I've drawn out some partial take profit levels on the way to my overall target. If we fail to break and hold above the entry line I've drawn, then this setup may become invalidated.

GBP/CHF Bearish BreakoutThis pair shot up a bit last week but since then has been forming lower highs.
I am looking for a bearish kumo breakout to coincide with a bearish kumo twist to confirm that it is time to try and push back lower as people rush back to safe havens like the Swiss Frank.
I've drawn out some partial take profit levels on the way to my overall target.
If we fail to maintain bearish confirmations, or if we fail to break down and hold below the kumo, this setup may become invalidated.

EUR/USD Long Term Swing TradeThis is a bit of a preemptive look at EUR/USD ahead of a potential bearish move.
We are close to a bearish Kumo Twist and chikou span is trying to get below price.
I am looking for a bearish kumo breakout as my last confirmation to get short.
We have a very long term target I'm looking at but I've drawn out several levels to take partial profit or look to add to the position.
It will be interesting to see how this progresses with the effect from Covid-19 and the hits taken by the economy around the world.
When considering most of the worlds currency is pegged to the dollar it would make sense that despite the loss of jobs in the US from business closures during this time, it makes sense that the dollar will eventually strengthen again.
If we fail to get our bearish breakout, or if our bearish confirmations change, this setup may become invalidated.

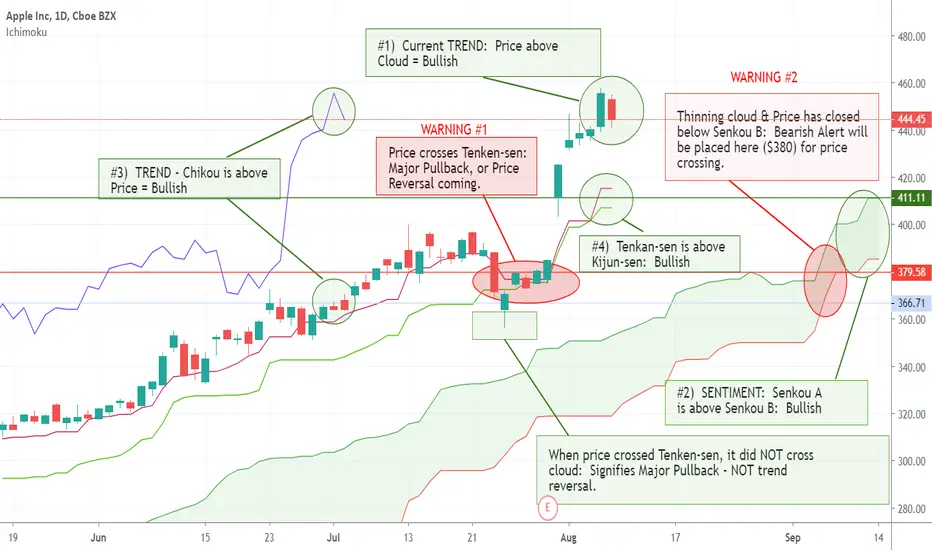
What does Ichimoku tell us about AAPL right now?If we look at AAPL a different way, again - looking at only the technicals - we see the 4 rules of Ichimoku are telling us that this stock is currently: Bullish.
That being said, there are some red flags popping up that I have also labeled. We could nit pick a couple more, but I ran out of room and wanted to keep this as simple as possible.
4 Rules:
1) Price in relation to Cloud: Price is Above Cloud = Bullish
2) Tenkan-sen in relation to Kijun-sen: Tenkan-sen above Kijun-sen = Bullish
3) Relationship of Chikou to Price: Chikou is Well Above Price = Bullish
4) Senkou A in relation to Senkou B: Senkou A is over Senkou B = Bullish
Warnings:
1) Price has crossed paths with Tenkan-sen - Signifying either a Major Pullback, or a Trend Reversal: The price has crossed over the Tenkan-sen line - this is a major red flag! We look closer, and find the price never surpassed down to, or through the Cloud. So this means this is a Major Pullback, but not a Trend Reversal.
Looking to the futhure, we see the price that has crossed this line, has also crossed below Senkou B - Signifying an entry point we want to stay AWAY from. So we draw a line at this spot, count the number of bars that consolidated at this point, and we will set an alert here.
2) The Cloud itself is thinning. A thinning cloud leads to a higher probability of a Trend Reversal. As we just had price hitting Tenkan-sen, we will start watching Candlestick patterns for signs of Reversals.
In one of my other posts, we already identified the 2 Candlestick pattern from Today and Yesterday, as a Bearish Harami. This is significant, and normally a sign of a reversal. We must look for 1 more Candlestick to confirm!
Thanks!
EURUSD Update (1hr)Got stopped out at break even on my previous entry.
Re entered around the 1.18400 levels. 48 pips secured.
Not a bad trade, a lot of consolidation so I took profits early.
Sitting on the sidelines for now, will be looking to re-enter.
Onto the next, there is risk in trading.
