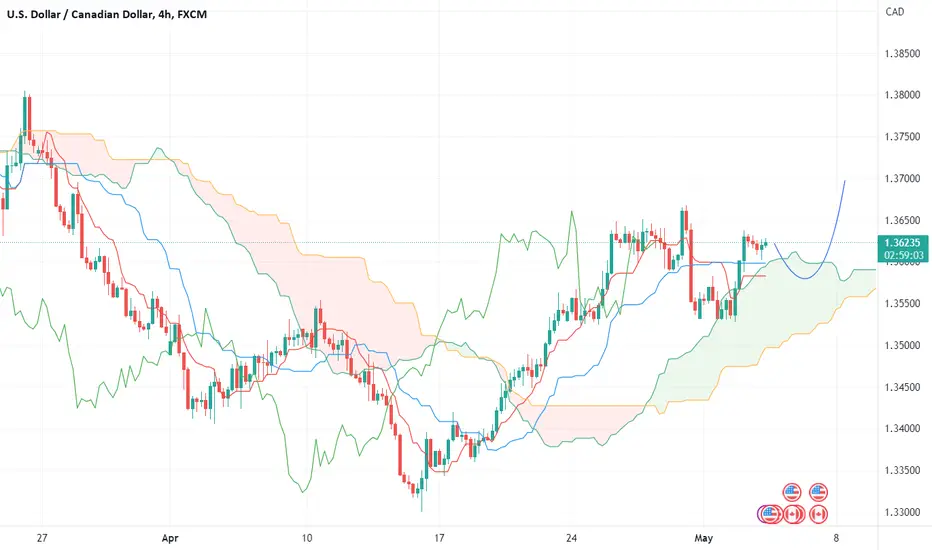
USDCAD retests the cloud and goes UPIt's out of the cloud and hasn't tested the cloud yet.
1:00 a.m. May 4 with FOMC news will be a time of high volatility.
If the cloud refuses it will bounce sharply.
If you like what I share, please support me by clicking Like or leaving a Comment. I will use it as an encouragement and indicator to give you even more analytical ideas. Thank you.
Ichimoku Cloud
AUDUSD buyers are dominatingI see buyers winning. The price is above the H4 cloud and the Chinkou line is above the price. On the daily time frame, the price has already entered the cloud.
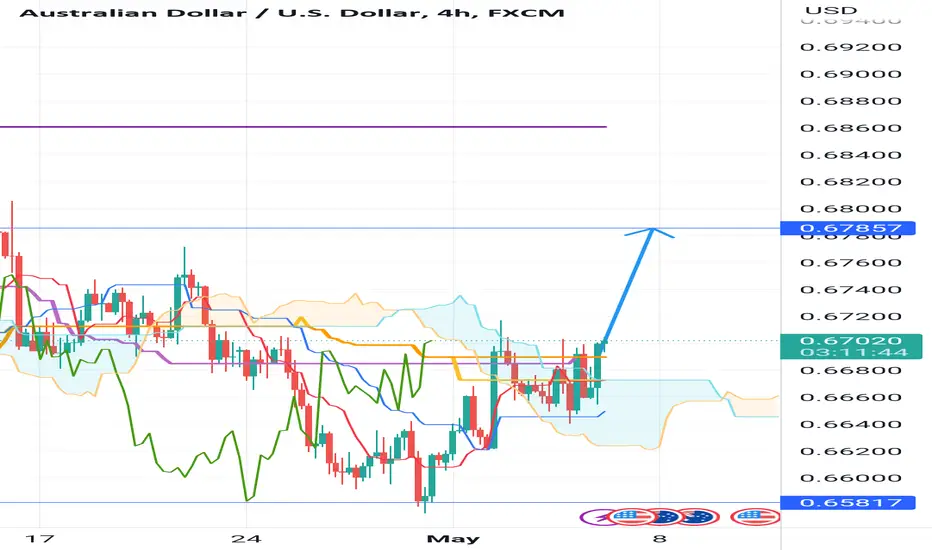
AUDUSD is undecidedAUDUSD is moving sideways for 2 days now.
On the H4 time frame it is stuck in the cloud.
I will wait for it to break out to find entry points.

Weekly Analysis BTC via Ichimoku Good start to the week,
Let us analyze at a glance the daily chart of BINANCE:BTCUSDT with Ichimoku Kinko Hyo. We use the traditional settings. There are other indicators in the analysis. We have developed and released them Open Source.
Trend:
The Kumo has been green for 41 days and is about 13% wide and is starting to tighten, especially the Senkou Span B is getting lower. The various lines indicate a downtrend situation with a sideways bias. Price has broken the Kijun and is approaching the Kumo and Tenkan Weekly, Tenkan and Kijun have crossed to the downtrend.
The Kijun Trend indicator now indicates looking for short positions.
Heikin-Ashi:
The Heikin-Ashi confirm a downtrend memento, also there Kijun and Tenkan are crossing downward.
Supports and resistances:
- 32150.00 Fibonacci
- 30350.00 Chikou cusps and flat areas of Kijun and Tenkan
- 30000.00 Psychological threshold
- 29800.00 Chikou cusps and flat zones of Kijun and Tenkan
- 27950.00 Fibonacci
- 25000.00 Fibonacci
- 24800.00 Chikou cusps and flat zones of Kijun and Tenkan
For static price levels, the lower right chart plots the flat zones of Tenkan, Kijun, Senkou Span A and Senkou Span B on different timeframes, and the Chikou for the daily time frame.
For dynamic price levels, the Ichimoku lines can be observed: the Tenkan Sen (short term), the Kijun Sen (medium term) as well as the Senkou Span A and Senkou Span B (long term).
Conclusions:
The situation has changed a lot since the last analysis, where the Heikin Ashi presents a series of red candles and the next support is the Kumo itself.
It is possible to find a sideways ABC pattern indicating the following levels: V 23400, E 25215, N 29015, NT 32815.
It is important to evaluate the price close during the week on the following price structures:
- Bullish: 28700.00
- Bearish/Lateral: 26500.00
Altcoin Cycle:
For Bitcoin Dominance and Altcoin Cycle we can consider the weekly variation:
- Total cryptocurrency market capital: Decreased.
- Dominance of BTC: Decreased.
- Price of BTC: Decreased.
- Alt cycle expectation: Stable.
Thanks for your attention, happy to support the TradingView community.
Indicators used:
Analysis Tool
Kijun Trend Indicator
Ichimoku Support and Resistance
Chikou Support and Resistance

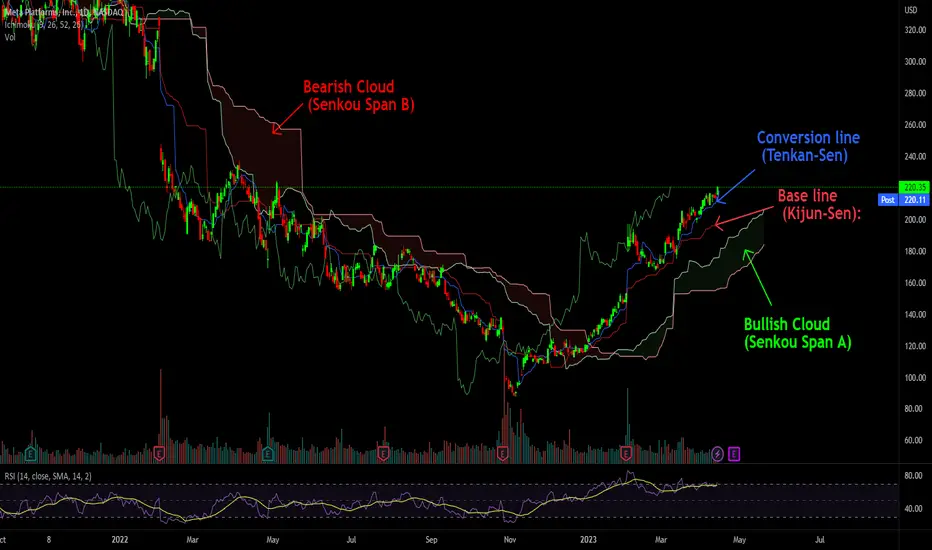
Ichimoku explained in one post Conversion line (Tenkan-Sen): This is a short-term moving average that measures the average of the highest high and lowest low over the past nine periods. It is used to identify short-term trends in the market. (9-day)
Base line (Kijun-Sen): This is a longer-term moving average that measures the average of the highest high and lowest low over the past 26 periods. It is used to identify longer-term trends in the market. (26-day)
Lagging span (Chikou Span): This is the current closing price, plotted 26 periods behind. It is used to confirm signals given by the conversion line and base line.
Bullish Cloud (Senkou Span A): This is the area between the conversion line and the base line, shaded green on the chart. It represents support and indicates a bullish trend.
Bearish Cloud (Senkou Span B): This is the area between two longer-term moving averages, shaded red on the chart. It represents resistance and indicates a bearish trend.
Amazon's Downward Spiral: Is the E-commerce Giant in Trouble?Amazon's stock has been running into the thick cloud of the Ichimoku on the monthly chart, indicating a significant resistance level that may lead to further declines. The Ichimoku is a technical analysis indicator that uses a range of moving averages to identify potential support and resistance levels. In this case, the thick cloud represents a significant resistance level that Amazon's stock has been struggling to break through. This suggests that there may be more pain ahead for the stock, as it continues to face downward pressure.
The first resistance price for Amazon's stock is around HKEX:107 , which is a critical level to watch. If the stock manages to break through this level, it may be able to gain some upward momentum. However, if it fails to break through this resistance, we could see further declines in the stock price. Given the current market conditions and the challenges that Amazon is facing, it seems likely that the stock will face more downward pressure in the coming months. As a result, investors should remain cautious and closely monitor the stock's performance in the coming weeks and months.

Weekly Analysis BTC via Ichimoku Good start to the week,
Let us analyze at a glance the daily chart of BINANCE:BTCUSDT with Ichimoku Kinko Hyo. We use the traditional settings. There are other indicators in the analysis. We have developed and released them Open Source.
Trend:
Kumo has been green for 28 days and is about 10.8% wide. It has widened and is looking upward. The various lines indicate a general uptrend situation.
The Kijun Trend indicator indicates looking for long positions.
Heikin-Ashi:
The Heikin-Ashi confirms the bullish momentum with no shadows below. This points us to some market strength.
Supports and resistances:
- 32150.00 Fibonacci
- 30350.00 Chikou cusps and flat zones of Kijun and Tenkan
- 30000.00 Psychological threshold
- 29800.00 Chikou cusps and flat zones of Kijun and Tenkan
- 27950.00 Fibonacci
- 25000.00 Fibonacci
- 24800.00 Chikou cusps and flat zones of Kijun and Tenkan
For static price levels, the lower right chart plots the flat zones of Tenkan, Kijun, Senkou Span A and Senkou Span B on different timeframes, and the Chikou for the daily time frame.
For dynamic price levels, the Ichimoku lines can be observed: the Tenkan Sen (short term), the Kijun Sen (medium term) as well as the Senkou Span A and Senkou Span B (long term).
Conclusions:
The situation is bullish after crossing the psychological threshold of 30000.00.
It is possible to find a bullish ABC pattern indicating the following levels: NT 27892.34, N 29876.78, V 31169.78 and E 31867.22.
It is important to assess the price close during the week on the following price structures:
- Bullish: 30387.00
- Bearish/Lateral: 29300
Altcoin Cycle:
For Bitcoin Dominance and Altcoin Cycle we can consider the weekly variation:
- Total cryptocurrency market capital: Increased.
- Dominance of BTC: Increased.
- Price of BTC: Increased.
- Alt Cycle Expectation: Decreased.
Thanks for your attention, happy to support the TradingView community.
Indicators used:
Analysis Tool
Kijun Trend Indicator
Ichimoku Support and Resistance
Chikou Support and Resistance


GBP/CHF: Buying it! Hey guys,
I haven't posted anything here for a while and I must say I missed it!
I hope that you are well and that you are going through this particular situation in the best possible conditions.
Here is an interesting trade on the GBP/CHF pair.
We can see that the pair is very bullish whether it's in Daily, H4, H1 or M15 from an Ichimoku point of view (prices are above the cloud, the lagging span has no obstacle, etc.).
Today it broke an important resistance that I have been following for a a few days now.
If we use the "modified Schiff Pitchfork" tool we can see that the pair still has a few pips to go before it reaches a first dynamic resistance.
The idea is simple: we wait for a bounce towards the broken resistance to enter at lower levels. My target will be the blue line at the top of the pitchfork around 1.14570.
I will mention if I take a position and at what level.
If the pair continues its upward path the trade is cancelled.
Good luck to you
Jesse

Weekly Analysis BTC via Ichimoku Good start to the week,
Let us analyze at a glance the daily chart of BINANCE:BTCUSDT with Ichimoku Kinko Hyo. We use the traditional settings. There are other indicators in the analysis. We have developed and released them Open Source.
Trend:
Kumo has been green for 20 days and is about 6.3% wide. It has widened and is stable. The various lines indicate sideways/downtrend on the short term, uptrend/lateral on the medium and long term.
The Kijun Trend indicator now indicates looking for long positions.
Heikin-Ashi:
The Heikin-Ashi confirm bullish momentum but we observe wide shadows on the Tenkan and just above, still indicating a sideways momentum.
Supports and resistances:
- 29800.00 Chikou cusps and flat areas of Kijun and Tenkan
- 27950.00 Fibonacci
- 25000.00 Fibonacci
- 24800.00 Chikou cusps and flat zones of Kijun and Tenkan
For static price levels, the lower right chart plots the flat zones of Tenkan, Kijun, Senkou Span A and Senkou Span B on different timeframes, and the Chikou for the daily time frame.
For dynamic price levels, the Ichimoku lines can be observed: the Tenkan Sen (short term), the Kijun Sen (medium term) as well as the Senkou Span A and Senkou Span B (long term).
Conclusions:
The situation is bullish/lateral, given also the proximity of the psychological threshold of 30000.00.
Hosoda's N wave of the ABC pattern identified several analyses ago has been centered and is acting as the resistance. It is possible to find a bullish ABC pattern indicating a first V level at 31227.96, NT level at 33467.19, and N level at 35827.10. On the other hand, a lateral/ribassist one indicating NT at 29501.31, and N at 26824.77.
It is interesting to see how BTC is recovering having closed a good quarter in conjunction with the problems in the traditional banking system.
It is important to evaluate the price close during the week on the following price structures:
- Bullish: 29500.00-29800.00
- Bearish/Lateral: 25000-26800.00
Altcoin Cycle:
For Bitcoin Dominance and Altcoin Cycle we can consider the weekly variation:
- Total cryptocurrency market capital: Increased.
- BTC Dominance: Decreased.
- Price of BTC: Increased.
- Expectation of Alt Cycle: Increased.
Thanks for your attention, happy to support the TradingView community.
Indicators used:
Analysis Tool
Kijun Trend Indicator
Ichimoku Support and Resistance
Chikou Support and Resistance

Weekly Analysis BTC via Ichimoku Good start to the week,
Let us analyse at a glance the daily chart of BINANCE:BTCUSDT with Ichimoku Kinko Hyo. We use the traditional settings. There are other indicators in the analysis. We have developed and released them Open Source.
Trend:
The Kumo has been green for 13 days and is about 6.40% wide. It has widened and is stable. The various lines indicate an uptrend momentum with a sideways bias in the long term and medium term. In the short term, however, the price is on the Tenkan, indicating a potential bounce or downtrend.
The Kijun Trend indicator now indicates looking for long positions.
Heikin-Ashi:
The Heikin-Ashi confirm bullish momentum and net of one red candle, the rest are green and away from the Tenkan.
Supports and resistances:
- 29800.00 Chikou cusps and flat areas of Kijun and Tenkan
- 25000.00 Fibonacci
- 24800.00 Chikou cusps and flat zones of Kijun and Tenkan
- 24400.00 Chikou cusps and flat zones of Kijun and Tenkan
- 24200.00 Chikou cusps and flat areas of Kijun and Tenkan
- 23300.00 Chikou cusps and flat areas of Kijun and Tenkan
- 21200.00 Chikou cusps and flat areas of Kijun and Tenkan
- 20200.00 Chikou cusps and flat zones of Kijun and Tenkan
- 19100.00 Fibonacci
For static price levels, the lower right chart plots the Tenkan, Kijun, Senkou Span A and Senkou Span B flat zones on different timeframes, and the Chikou for the daily time frame.
For dynamic price levels, the Ichimoku lines can be observed: the Tenkan Sen (short term), the Kijun Sen (medium term) as well as the Senkou Span A and Senkou Span B (long term).
Conclusions:
The situation is bullish/lateral, given also the proximity of the psychological threshold of 30000.00.
Hosoda's N wave of the ABC pattern identified several analyses ago has been centred and is acting as the resistance. It is possible to find two other ABC patterns: one bullish indicating a first level at 31134.30, another indicating a sideways movement where the N wave is at 24417.14 and the NT wave at 33736.10.
From a fundamental point of view, it continues to be interesting to see more distressed banks and instead the strength of Cryptos, born precisely out of distrust in the traditional market. In general however, the FED continues to raise rates while the market is responding with a rebound in the stock market.
It is important to assess the price close during the week on the following price structures:
- Bullish: 28700
- Bearish/Lateral: 25000
Altcoin Cycle:
For Bitcoin Dominance and Altcoin Cycle we can consider the weekly variation:
- Total cryptocurrency market capital: Increased.
- Dominance of BTC: Increased.
- Price of BTC: Increased.
- Alt Cycle Expectation: Decreased.
Thanks for your attention, happy to support the TradingView community.
Indicators used:
Analysis Tool
Kijun Trend Indicator
Ichimoku Support and Resistance
Chikou Support and Resistance

Bitcoin Upcoming Levels of ResistanceThis is a followup to my Bullish trades on Bitcoin since 2023 (see links below). I highly suggest you check them out to see how to find opportunity before it late into the move.
So now it is time to start marking off Resistance Levels as this bullish move matures. The reasons:
This is still a crypto winter and this is a bear market rally.
Crypto trading platforms are starting to send unsolicited push notifications to remind people that Bitcoin is going up!
Crypto social medias are busy intensifying Ron Paul "It's Happening" memes regarding the failure of 2 banks = collapse of US Dollar.
There are three major levels where I will look for this rally to stall and possibly reverse.
32k : This is the closest and most probable level. It is respect of the lows of summer 2021 and importantly the 50% Retracement Resistance of the March 2022 high to the current Low of this Bear market.
36.5k : This is the inflection point where Bitcoin tried to hold the bullish trend in January 2022 and the 50% Retracement of the entire March 2020 - All Time High move.
42k : This is the 50% Retracement Resistance of the whole bear market move.
Using Ichimoku theory:
This is still a bear market pullback because price is well below the Ichimoku cloud signifying a bear trend. Price does not become bullish until it has cleared the entire Weekly cloud. What this move has done though is get Bitcoin into the Weekly cloud which is the first step from going to full on Bearish, as it has been since May 2022, to bullish which would not happen until time and the highest Resistance (42k) has been passed.

Weekly Analysis BTC via Ichimoku Good start to the week,
Let us analyze at a glance the daily chart of BINANCE:BTCUSDT with Ichimoku Kinko Hyo. We use the traditional settings. There are other indicators in the analysis. We have developed and released them Open Source.
Trend:
Kumo has been green for 6 days and is about 0.7% wide. It changes abruptly but is currently widening. After the bounce on the Kumo and the Kijun Weekly now the situation is generally bullish and the Kijun Daily is on the Tenkan Weekyl level.
The Kijun Trend indicator now indicates looking for long positions, as anticipated the change was very likely and now the price is very far from the Kinun.
Heikin-Ashi:
The Heikin-Ashi confirms the rebound and strong bullish momentum.
Supports and resistances:
- 29800.00 Chikou cusps and flat areas of Kijun and Tenkan.
- 25000.00 Fibonacci
- 24800.00 Chikou cusps and flat zones of Kijun and Tenkan
- 24400.00 Chikou cusps and flat zones of Kijun and Tenkan
- 24200.00 Chikou cusps and flat areas of Kijun and Tenkan
- 23300.00 Chikou cusps and flat areas of Kijun and Tenkan
- 21200.00 Chikou cusps and flat areas of Kijun and Tenkan
- 20200.00 Chikou cusps and flat zones of Kijun and Tenkan
- 19100.00 Fibonacci
For static price levels, the lower right chart plots the Tenkan, Kijun, Senkou Span A and Senkou Span B flat zones on different timeframes, and the Chikou for the daily time frame.
For dynamic price levels, the Ichimoku lines can be observed: the Tenkan Sen (short term), the Kijun Sen (medium term) as well as the Senkou Span A and Senkou Span B (long term).
Conclusions:
The situation is bullish.
Considering the current pattern with point B at March 10 and calculated with point C at March 14, we have 28773 (NT) as an interesting level.
From a fundamental point of view, it's interesting to see several banks fail and respective central bank bailouts. In general BTC was born as a response-in the times to-similar issues, this could be the motivation for the price increase.
It is important to evaluate the price close during the week on the following price structures:
- Bullish: 28700
- Bearish/Lateral: 25000
Altcoin Cycle:
For Bitcoin Dominance and Altcoin Cycle, we can consider the weekly variation:
- Total cryptocurrency market capital: Increased.
- Dominance of BTC: Increased.
- Price of BTC: Increased.
- Alt Cycle Expectation: Decreased.
Thanks for your attention, happy to support the TradingView community.
Indicators used:
Analysis Tool
Kijun Trend Indicator
Ichimoku Support and Resistance
Chikou Support and Resistance

BTC - Where we've been, and where we're likely headed.What an exciting ride it's been in Macro Markets lately! If you're into S&M; that is. I've long said, thanks to Luke Gromen, BTC is our best Liquidity Gauge in markets. And BTC hasn't failed us this time either. It sniffed out a change in tides, well before any other asset in markets.
Where we've been....
1) BTC on the Weekly chart puts in a beautiful, textbook "Bullish Divergence".
2) BTC closes on the Weekly, above the Kijun, and with High Volume (Green candle, not color, the 'g' below it; indicating high volume and high price movement : Bill Williams theory)
3)BTC breaks above the Descending Forecast Line (Orange Dotted) from our 69k ATH! This is HUGE. I took profits on Longs here, as generally speaking, the first touch of a Forecast Line rejects. We proceeded to grind down the Forecast Line (on the upside of it), and this week have broken back out to the Upside, consequently also breaking through the new Forecast Line made by our original piercing/pullback of the 69k Line.
This is all beautifully Bullish, and as I said...was indicative of BTC sniffing out a Pause/Pivot/Trouble in the FED's "tightening" scheme. It will definitely be interesting to see what Powell does re: Rate Hikes in a few days.
So here we are, breaking through many "resistance" areas, and now sitting just below this very thick Cloud. A pullback to the Ascending Forecast Line (from the 15,xxx Lows) would not surprise me, and would likely represent a perfect Buying Opportunity (currently 19,2xx and rising).
Where we're likely headed....
4) The 32-33k region has a very flat Kijun and SSB, a likely candidate for a Target on running Liquidity/Pausing/Resistance.
5) The current Monthly Kijun as well as ~~Weekly SSB around 42,2xx would be the next higher target.
6) Followed by the 69k ATH Monthly Forecast Line (Red Dotted Descending) currently > 50k and descending.
Unless Global Macro forces change suddenly, and the FED decides to ramp rates much higher ( I don't see this happening ), I see Medium to Long Term upside for BTC, and Dips are for buying.
As always, good luck, have fun, and practice solid risk management.

Bearish on GBPUSDPossible short position here. I've identified a few resistance lines for some targets and confirmed the trend reversual using the Ichimoku cloud. Interested for everyone's thoughts!

Bitcoin at Critical Retracement SupportBitcoin BITSTAMP:BTCUSD has pulled back to the Major 50% Retracement of the January rally at 20360. This is a key Support level that must hold to continue the bullish trend. Watch how price behaves at this level. If price holds the level (closes today above) and remains above then the bull case remains intact. If price closes below the level for 2 or more days the rally is over.
Using Ichomoku analysis the bullish trend is not yet broken as price has pulled back to the bottom of the cloud but not yet broken through.
This is a followup to the trend breakout that began January 12th as per my last post using Ichimoku to define the breakout.

Gbpchf bullish hello trders gbpchf is supported by a trend line and its hoding right now above the SMA 200 and above the kumo on h4 wich is a signal to go bullish

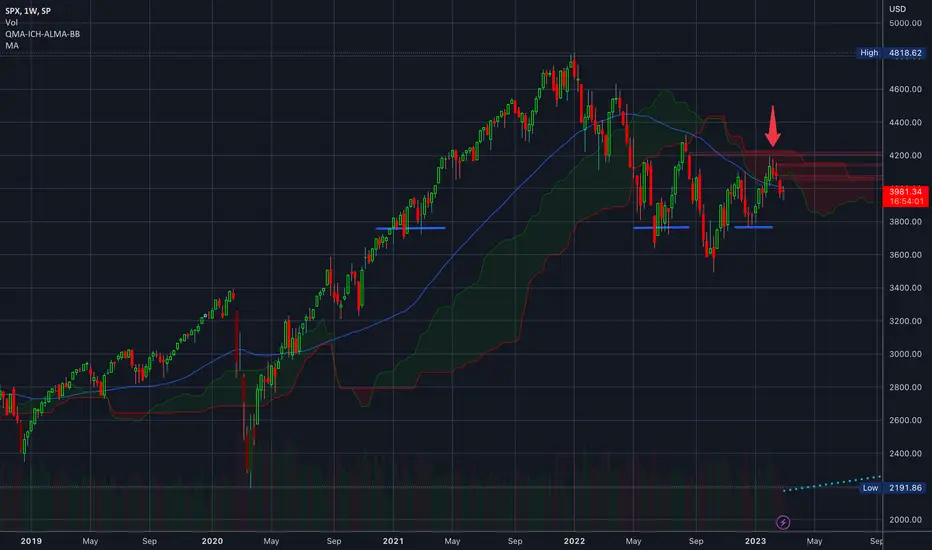
$SPX $SPY Analysis, Key levels, and Targets $SPX $SPY Analysis, Key levels, and Targets
So on the weekly timeframe…. SPX got slapped back under the ichimoku cloud… and the 50MA is holding it down…
In my opinion today was just a dead cat bounce off of the 200MA on the daily chart.
Next support level around 3760
Not a big update today, just some observations on the bigger timeframes…
Have fun trading tomorrow…. It has been a fun week so far… let’s see how the week closes…
Weekly Analysis BTC via Ichimoku
Good start to the week,
Let us analyse at a glance the daily chart of BINANCE:BTCUSDT with Ichimoku Kinko Hyo. We use the traditional settings. There are other indicators in the analysis. We have developed and released them Open Source.
Trend:
Kumo has been green for 58 days and is about 11% wide. It has risen since the last analysis and is looking slightly upward. The situation is still uncertain: on the short term there is downtrend, on the medium term there is laterality, and on the long term there is laterality/uptrend.
The Kijun Trend indicator now indicates looking for long positions, although price is at Kijun levels and yesterday could have signalled short positions.
Heikin-Ashi:
The Heikin-Ashi confirms the bearish movement last week and the touch of the Kijun, which instead with regular candles was overcome.
Supports and resistances:
- 29800.00 Chikou cusps and flat areas of Kijun and Tenkan
- 25000.00 Fibonacci
- 24800.00 Chikou cusps and flat zones of Kijun and Tenkan
- 24400.00 Chikou cusps and flat zones of Kijun and Tenkan
- 24200.00 Chikou cusps and flat areas of Kijun and Tenkan
- 23300.00 Chikou cusps and flat areas of Kijun and Tenkan
- 21200.00 Chikou cusps and flat areas of Kijun and Tenkan
- 20200.00 Chikou cusps and flat zones of Kijun and Tenkan
- 19100.00 Fibonacci
For static price levels, the lower right chart plots the Tenkan, Kijun, Senkou Span A and Senkou Span B flat zones on different timeframes, and the Chikou for the daily time frame.
For dynamic price levels, the Ichimoku lines can be observed: the Tenkan Sen (short term), the Kijun Sen (medium term) as well as the Senkou Span A and Senkou Span B (long term).
Conclusions:
The situation is bullish/lateral.
Hosoda waves calculated on an ABC pattern representing sideways momentum shows the following price levels on the waves: 26245 (NT), 22346 (N), 18447 (E), 17452 (V).
From a fundamental point of view, the week generally closed with a sign of weakness in the markets despite the fact that equities closed slightly higher, while BTC closed a down week in anticipation of a potential recovery. In general, U.S. employment data are positive but U.S. GDP is not.
It is important to assess the price close during the week on the following price structures:
- Bullish: 24400.00-24800.00
- Bearish/Sideways: 23300.00
Altcoin Cycle:
For Bitcoin Dominance and Altcoin Cycle, we can consider the weekly variation:
- Total cryptocurrency market capital: Decreased.
- Dominance of BTC: Decreased.
- Price of BTC: Decreased.
- Alt cycle expectation: Stable.
Thanks for your attention, happy to support the TradingView community.
Indicators used:
Analysis Tool
Kijun Trend Indicator
Ichimoku Support and Resistance
Chikou Support and Resistance


Ichimoku Analysis for BTCWith Tenkan finally pointing upwards we have a bullish scenario however it is very weak for now as Lagging is getting closer towards the price.
Will look for short or long entry based on price breaking supp & resis.

Red lake Jump BTC graph.It is jumping !
Look any ichimoku cloud.
**
so cagooon so cago bitcoi so cagooo
so cagooo so cagoo so cagoo so cagoo bitcoi so cagoo

Weekly Analysis BTC via IchimokuGood start to the week,
Let us analyze at a glance the daily chart of BINANCE:BTCUSDT with Ichimoku Kinko Hyo. We use the traditional settings. There are other indicators in the analysis. We have developed and released them Open Source.
Trend:
Kumo has been green for 51 days and is about 9.9% wide. It has been up since the last analysis and always flat. In the short/medium term, the situation is now bullish/lateral: price is above Tenkan and Kijun. Tenkan and Kijun are flat on the same level.
The Kijun Trend indicator now indicates looking for long positions, which changed from last week.
Heikin-Ashi:
The Heikin-Ashi confirms the bullish movement of the past week.
Supports and resistances:
- 29800.00 Chikou cusps and flat areas of Kijun and Tenkan.
- 25000.00 Fibonacci
- 24400.00 Chikou cusps and flat zones of Kijun and Tenkan
- 23700.00 Chikou cusps and flat zones of Kijun and Tenkan
- 21200.00 Chikou cusps and flat zones of Kijun and Tenkan
- 20200.00 Chikou cusps and flat zones of Kijun and Tenkan
- 19100.00 Fibonacci
For static price levels, the lower right chart plots the flat zones of Tenkan, Kijun, Senkou Span A and Senkou Span B on different timeframes, and the Chikou for the daily time frame.
For dynamic price levels, the Ichimoku lines can be observed: the Tenkan Sen (short term), the Kijun Sen (medium term) as well as the Senkou Span A and Senkou Span B (long term).
Conclusions:
The situation is bullish/lateral.
Hosoda waves calculated on a new ABC pattern representing the sideways momentum shows the following price levels on the waves: 24160 (N), 20202 (NT), 26010 (E) and 27158 (V).
From a fundamental point of view, the challenge between FED and Markets continues, where despite the promise to raise interest rates, the stock market is still up. This week also includes the FOMC meeting and MoM data.
It is important to assess the price close during the week on the following price structures:
- Rizalist: 25000.00-26101.00
- Bearish/Lateralist: 23100.00-22440.00
Altcoin Cycle:
For Bitcoin Dominance and Altcoin Cycle we can consider the weekly variation:
- Total cryptocurrency market capital: Increased.
- Dominance of BTC: Increased.
- Price of BTC: Increased.
- Alt Cycle Expectation: Decreased.
Thanks for your attention, happy to support the TradingView community.
Indicators used:
Analysis Tool
Kijun Trend Indicator
Ichimoku Support and Resistance
Chikou Support and Resistance
