XAUUSD Daily AnalysisGold continues to its predicted bullish movement.
In annual analysis at the beginning of the year, I emphasized that gold will set new ATH.
Last week, gold prices hit our analytical target and the upward movement will be continued.
I will identify new key support and resistance levels for coming weeks.
Ichimokukinkohyo

ARUSDTThis is a long-term analysis.
To buy spot and medium term..
We may experience strong negative fluctuations, but it is worth the risk.
The numbers 11.5 to 12.5 dollars and 8.5 to 10 dollars are attractive prices to buy..
It is better to look at this purchase as a short-term investment.
Important trading times and nodes for the end of wave B and the beginning of wave C were determined..

XAUUSD Daily Analysis
According to our previous analysis the gold is still in its up trend.
Price is near to important resistance levels.
Until it goes below the support level
(2655), it cannot be said that a downtrend has begun.

BONKUSDT It seems that this currency is in a strong upward structure.
With the completion of the J wave, which is the last rally of the diametric pattern, it has the chance of a very strong rise.
Just a technical analysis.

Market Outlook for 2025: SPY Price TargetsMarket Outlook for 2025: SPY Price Targets
As we navigate through 2025, investors and traders are closely monitoring the S&P 500 ETF (SPY) for signs of where the market might head. Here’s a detailed monthly breakdown of expected price movements:
January:
Downside Target: $574.15
Upside Target: $593.15
Outlook: The new year begins with a cautious note, with a narrow trading range expected. The market might see early profit-taking or a response to late-year 2024 policy news.
February:
Downside Target: $563.75
Upside Target: $589.13
Outlook: February might continue the cautious trend from January, with potential for a slight recovery if early-year economic indicators are positive.
March:
Downside Target: $561.78
Upside Target: $601.45
Outlook: Spring might bring some optimism, with the upside target suggesting a possible rally, perhaps due to seasonal adjustments in investment strategies.
April:
Downside Target: $538.23
Upside Target: $567.03
Outlook: This month could see a dip, reflecting concerns over quarterly earnings or macroeconomic data. However, the upside potential indicates a possible quick recovery or stabilization.
May:
Downside Target: $549.27
Upside Target: $592.61
Outlook: Traditionally, May can be volatile, but the significant upside target suggests optimism, possibly fueled by positive corporate guidance or sector performance.
June:
Downside Target: $572.31
Upside Target: $614.92
Outlook: Summer starts with promise, with a wide range between targets, indicating potential for significant market movements based on mid-year reviews or policy changes.
July:
Upside Target: $618.20
Downside Target: $597.21
Outlook: July might see continued growth from June, with the upside target slightly higher, suggesting sustained investor confidence.
August:
Upside Target: $623.45
Downside Target: $593.93
Outlook: The summer could end on a high note, but with a notable downside risk, reflecting market reactions to economic reports or geopolitical events.
September:
Downside Target: $598.52
Upside Target: $615.57
Outlook: Historically, September is a turbulent month for markets. The narrow range suggests cautious trading with a slight bias towards an upward trend.
October:
Upside Target: $629.96
Downside Target: $597.17
Outlook: October might see a recovery or continuation of September's trends, with a significant upside potential if the market absorbs positive economic news.
November:
Upside: $631.56
Downside Target: $618.20
Outlook: Late-year optimism could drive prices up, with the downside target still above previous months' peaks, indicating a bullish sentiment.
December:
Upside Target: $645.83
Downside Target: $632.32
Outlook: The year might end on a high, with both targets suggesting a market that's resilient or buoyed by end-of-year adjustments and holiday spending.
Conclusion:
This outlook for 2025 suggests a year of volatility with significant potential for both gains and corrections. Investors should remain vigilant, adapting to both the micro and macroeconomic environments, and be ready to capitalize on or hedge against these projected movements in SPY. Remember, these targets are speculative and should be used in conjunction with broader market analysis and individual investment goals.

USDCAD Sell positionusdcad ( 4H / 1D )
Market Price: 1.44055
Sell now : 1.44055
Tp1 : 1.42310
Tp2 : 1.41290
TP3: 1.40000
Sl : 1.44740
Traders, if you liked this idea or if you have your own opinion about it, write in the comments. I will be glad ❤️
Remember this is a position that was found by me and it is a personal idea not a financial advice, you are responsible for your loss and gain.

CADJPY BUY Position BUY Position Triangle log size
EN: 109.610
TP1: 109.900
TP2: 110.70
SL: 109.369
The analysis is on a 15-minute time frame.
This is a personal opinion and you are responsible for your own profits and losses.

EURNZD signal: 4H / 1D Beautiful SellEURNZD ( 4H / 1D )
Market price : 1.84475
Sell now : 1.84475
Tp1 : 1.83687
Tp2 : 1.82485
Sl : 1.85480 ( 70 pip )
Traders, if you liked this idea or if you have your own opinion about it, write in the comments. I will be glad ❤️
Remember this is a position that was found by me and it is a personal idea not a financial advice, you are responsible for your loss and gain.

DXY Daily AnalysisDxy Trend is upward. we expcet it to reach higher levels.
consider all Support and resistance levels on the chart.

ARBUSDTHi guys
The main trend is downward. We have not yet received confirmation of a trend change and the bullish outlook is very weak for now.
But on the daily and four-hour time frames, we have a positive RSI divergence.
And provided that the downward trend line is broken and the resistance range of $0.893 is consumed, the possibility of the continuation of the upward trend is strengthened.
What do you think?

XAUUSD Daily AnalysisTrend is bullish ( based on ichimoku)
We expect upward movement till 2753 level.
Resistance levels which are important for us (2664, 2633 & 2572)
as usaual we trade on these level!

All things looking bullish for XRP Trump+Alt Season+Gary ResignsPattern Recognition:
The chart identifies a "Flag" pattern, which is a continuation pattern indicating a pause in the uptrend before resuming. The flagpole represents the initial strong upward move, followed by consolidation within the flag pattern, and then a breakout.
Ichimoku Cloud:
Kijun-sen (Blue Line): This line represents the baseline and is calculated as the average of the highest high and lowest low over the past 26 periods.
Tenkan-sen (Red Line) : This line is the conversion line, calculated as the average of the highest high and lowest low over the past 9 periods.
Senkou Span A (Green Line) : Part of the future cloud, calculated as the average of the Tenkan-sen and Kijun-sen, plotted 26 periods ahead.
Senkou Span B (Orange Line) : The other part of the future cloud, calculated as the average of the highest high and lowest low over the past 52 periods, plotted 26 periods ahead.
Chikou Span (Purple Line) : The lagging line, which is the current closing price plotted 26 periods back.
Cloud Interpretation:
The price breaking above the cloud (Kumo) is generally a bullish signal. The cloud represents support and resistance levels.
If the price is above the cloud, it indicates a bullish trend. If it's within the cloud, it's a consolidation phase, and if below, it's bearish.
Breakout:
The price has broken out of the flag pattern upwards, which is confirmed by the breakout label. This breakout should be viewed in the context of the Ichimoku cloud.
Volume Analysis:
Volume spikes during the breakout phase can confirm the strength of the move. High volume on the breakout specifically on the Daily chart suggests strong buying interest.
Tenkan-sen and Kijun-sen:
When Tenkan-sen crosses above Kijun-sen, it's a bullish signal (golden cross). Conversely, a cross below is bearish (death cross).
Technical Analysis Summary:
Trend: The overall trend appears bullish, with the price breaking out of a flag pattern and moving above the Ichimoku cloud. This suggests strong momentum.
Ichimoku Signals:
Bullish Signals: The price above the cloud, Tenkan-sen above Kijun-sen, and Chikou Span above past price action suggest bullish momentum.
Resistance and Support: The cloud now acts as a dynamic support level. If the price dips into the cloud, it might find support there.
Potential Targets:
Using the flag pattern's flagpole length for projection, the price could aim for higher levels. However, the Ichimoku system doesn't provide exact price targets but guides on trend direction and momentum.
Risks:
A failure to sustain above the cloud could lead to a pullback into the cloud or even below, indicating a potential trend reversal or correction.
Strategy:
Entry: For traders using Ichimoku, entering on a bullish breakout above the cloud with additional confirmation from other indicators (like volume) could be considered. Alternatively, waiting for a pullback to the cloud or Kijun-sen for a safer entry might be prudent.
Stop Loss: Placing a stop loss below the cloud or significant support levels within the flag pattern can manage risk.
Take Profit:
This could be based on the projected move from the flagpole or where the price encounters next resistance, possibly where the future cloud might be. More or less it depends very much on ones own strategy.
Conclusion:
The chart with the Ichimoku indicator suggests a strong bullish outlook for XRP/USD, with the price currently above the cloud and a breakout from a flag pattern. However, traders should watch for potential pullbacks to key Ichimoku levels for optimal entry points and risk management. Always consider broader market conditions and any news or events that might impact cryptocurrency prices.

How to use Ichimoku cloud?The Ichimoku Cloud, also known as Ichimoku Kinko Hyo, is a versatile and comprehensive technical analysis tool that provides insights into trend direction, support and resistance levels, and momentum. Developed by Japanese journalist Goichi Hosoda in the late 1930s, it combines multiple indicators into a single chart, making it a favorite among traders worldwide.
What is the Ichimoku Cloud?
The Ichimoku Cloud consists of five lines that provide a detailed view of price action:
1. Tenkan-sen (Conversion Line):
- Represents short-term momentum and trend direction.
2. Kijun-sen (Base Line):
- Acts as a medium-term trend indicator and a potential support or resistance level.
3. Senkou Span A (Leading Span A):
- Forms one edge of the Ichimoku Cloud and provides dynamic support and resistance levels.
4. Senkou Span B (Leading Span B):
- Forms the other edge of the Cloud, offering additional support and resistance insights.
5. Chikou Span (Lagging Span):
- Formula: Current closing price plotted 26 periods back.
- Helps confirm trends by comparing current price levels with past movements.
The area between Senkou Span A and Senkou Span B is shaded to create the "Cloud" (Kumo), which plays a central role in analysis.
How to Use the Ichimoku Cloud
1. Trend Identification:
- Price Above the Cloud:Indicates an uptrend.
- Price Below the Cloud:Indicates a downtrend.
- Price Within the Cloud: Suggests a range-bound or uncertain market.
2. Support and Resistance:
- The Cloud acts as dynamic support in uptrends and resistance in downtrends. The thicker the Cloud, the stronger the level.
3. Crossovers:
- Bullish Crossover: Tenkan-sen crossing above Kijun-sen signals a potential uptrend.
- Bearish Crossover: Tenkan-sen crossing below Kijun-sen signals a potential downtrend.
4. Future Cloud Projection:
- A bullish Cloud (Senkou Span A above Senkou Span B) suggests continued upward momentum.
- A bearish Cloud (Senkou Span A below Senkou Span B) signals potential downward momentum.
5. Chikou Span Confirmation:
- If the Chikou Span is above the price from 26 periods ago, it confirms bullish momentum.
- If it’s below, it confirms bearish momentum.
Strengths of the Ichimoku Cloud
-All-in-One Indicator: Combines trend, momentum, and support/resistance in a single tool.
- Dynamic: Adapts to changing market conditions.
- Forward-Looking: Projects future levels through the Cloud.
Limitations of the Ichimoku Cloud
- Complexity: Can be intimidating for beginners due to the multiple components.
- Lagging Nature: Some elements, like the Kijun-sen and Chikou Span, rely on historical data.
- Less Effective in Choppy Markets: May produce false signals in sideways markets.
Best Practices for Using the Ichimoku Cloud
1. Combine with Other Indicators:
- Pair with RSI, MACD, or volume indicators for better confirmation.
2.Adapt Settings:
- The default settings (9, 26, 52) work well for many markets but can be adjusted to suit specific trading styles or timeframes.
3. Analyze Multiple Timeframes:
- Use higher timeframes for trend confirmation and lower timeframes for precise entries.
Example of the Ichimoku Cloud in Action
Imagine Ethereum (ETH) is trading at $3600 The price breaks above the Cloud, and Tenkan-sen crosses above Kijun-sen, signaling a bullish trend. The Chikou Span is above the price from 26 periods ago, confirming upward momentum. As ETH continues to rise, the Cloud projects higher support levels, guiding traders to hold their positions until bearish signals emerge.
Conclusion
The Ichimoku Cloud is a powerful tool that provides a holistic view of market trends, momentum, and key price levels. While it may seem complex initially, its comprehensive nature makes it invaluable for traders who invest time in mastering it. Practice using the Ichimoku Cloud on historical data and integrate it into your trading strategy for optimal results.
⚠️ Disclaimer:
This is not financial advice. Always manage your risks and trade responsibly.
👉 Follow me for daily updates,
💬 Comment and like to share your thoughts,
📌 And check the link in my bio for even more resources!
Let’s navigate the markets together—join the journey today! 💹✨

SANDUSDTBased on the labeling and analysis, it seems that we have exited a large structure in the form of wave B, and probably the recent growth of wave 1 of the impulse series, which completes the big wave C for us. Spot buying around $0.36 can be done. be low risk..

BTC Needs to Test $80kThe key levels are marked on the chart to identify potential support and resistance zones. The price seems to be hovering around the 0.382 retracement level (~92,695), with a potential move downward. The price has broken below the cloud, which could be interpreted as bearish.
The downward trend is targeting the region around the 0.786 retracement level. This area could act as a potential support zone.

BTC Trend in 2025: (Based on Ichimoku)Based on my previous analysis from march 22, 2024 , the BTC trend is still bullish.
According to our medium-term analysis , it has hit our TPs and we see retracement nowadays.
Bitcoin will record new ATH(s):
113866
122524
137082.5
And important support levels:
87800
69000

BTC/USD - daily chart divergence showed the wayThe divergence was strong with this one.
Both the RSI and MACD showed huge Divergence from the Price.
Divergence is a very good way to try and prevent your buy trade from being someone else’s exit liquidity at the top.
It'll be interesting to see if those Liquidity Voids below get filled up.
Divergence:
Liquidity Voids:

GBPUSD sell DAILY TIMEFRAMEGBPUSD just cross the tenkan sen, idea is sell, also it got nice pullback from kijunsen

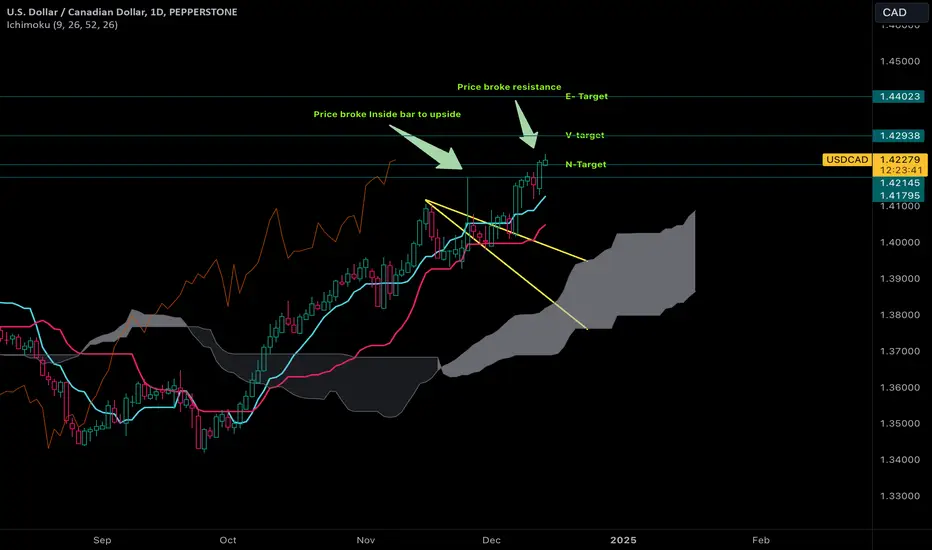
How High Can USD-CAD Go? USD - CAD has been going up and is in a strong bullish trend according to Ichimoku signals.
Ichimoku:
-Tenkan Sen is avove Kijun Sen and pointing up
-Kumo is up, thick and Senkou Span A and B are pointing up
-Chikou Span is above the candles and has no resistance in the future
-Price broke Yellow focus lines to the upside
Price action:
-broke big inside bar to upside
-broke couple doj at resistance level
-broke resistance level
Price Target:
-Price reached n-target but could get tot V and E, because there are no signals of slowing down.
Weekly is also strong bullish.
*im a beginner trader and learning. I make these analyses for myself. Please comment on my analysis because i want to learn.
www.tradingview.com
XAUUSD 4h AnalysisAccording to my previous analysis, based on Ichimoku, the gold trend is still bullish.
I see the possibility of a return to higher levels and a retest of the 2760 zone. If this level is broken, it can also reach the 2790 level.
If the price doesn't break through the resistance, we expect it to reach
2611-2640 price range.
We will check the ichimoku and data at these levels.
As usual we trade at all important levels. And you can follow the free signals in TG.

XAUUSD Daily AnalysisFor the up coming weeks, the Gold trend is generally bullish.
Ichimoku shows that the support level (2500) is very important and if gold breaks through the 2663 level, there is a possibility of growth towards 2753.
Our perspective toward gold is positive, unless there are major changes in the global economic situation

XAU/USD: Strong Bearish Momentum with Limited Upside🐻 XAU/USD Analysis: Bearish Momentum Dominates Across Timeframes with Limited Upside Potential 🐻
Idea:
In this multi-timeframe analysis of XAU/USD, we explore a solid bearish setup that persists across daily, 4-hour, 1-hour, and 15-minute charts. This alignment creates a clear, layered downtrend. Here’s a breakdown of each timeframe, highlighting support and resistance levels, ideal trade setups, and short entry points, while remaining cautious of minor corrective bounces.
🕰️ Daily Chart (1D): Long-Term View
From a wide perspective, the daily chart signals a strong bearish outlook:
• Momentum: Clearly bearish, with RSI at an oversold level of 24.61. Despite the oversold status, the prevailing downtrend remains strong, with limited upward potential.
• Ichimoku Cloud: The price is far below the cloud, with the lagging span mirroring the bearish structure. Sellers are in control, and there are no reversal signs.
• ADX & DI: A high ADX and dominance of the DI- line emphasize strong selling pressure.
• Key Support Zone: The zone between 2,575 and 2,580 acts as critical support. If price dips into this zone, we may see a corrective bounce before a potential further decline.
The daily chart maintains a bearish sentiment, where any temporary rallies are likely to be capped.
🕰️ 4-Hour Chart (4H): Medium-Term Insights
The 4-hour chart provides a closer look at possible short-term corrections within the broader downtrend:
• Trend: Bearish momentum continues, with a slight bullish divergence hinting at a minor pullback. This divergence suggests that sellers may temporarily lose momentum.
• RSI: With an RSI of 27.77, slightly above oversold territory, the 4-hour chart hints at a possible minor correction.
• Ichimoku Cloud: Both price and the lagging span remain below the cloud, reinforcing the downward trend. However, the proximity to a key support zone may prompt buyers to test the strength of the bearish hold.
• Resistance: Watch for a potential rejection at 2,590 - 2,595, likely strengthening short setups if price attempts to rally and fails at this level.
The 4-hour chart presents a potential for small corrections, though bearish conditions remain the primary theme.
🕰️ 1-Hour Chart (1H): Short-Term Perspective
The 1-hour chart captures immediate price dynamics, suggesting the possibility of a minor bounce:
• Trend: RSI sits at 20.91, in oversold territory, suggesting a short-lived bounce may occur.
• Ichimoku Cloud: Price remains below the cloud, with exhaustion signs as it nears support. This setup underscores bearish pressure but hints at a possible minor pullback.
• Moving Averages: The strong detachment from MAs suggests the bearish trend will continue, but a mean reversion play is possible, where price might retrace toward the MAs before resuming its downtrend.
• Immediate Support Zone: The 2,580 - 2,583 zone could serve as a temporary lifeline for buyers, though any bounce here is likely to be brief.
This chart provides a snapshot of a potential pullback, with the downtrend still prevailing.
🕰️ 15-Minute Chart (15M): Intra-Day Snapshot
For intra-day traders, the 15-minute chart highlights immediate levels:
• Moving Averages: The 10 MA at 2,587 and the 50 MA at 2,592 act as intra-day ceilings, likely capping any upward movement.
• Short-Term Resistance: The 10 MA at 2,587 serves as the first barrier, with the 50 MA at 2,592 reinforcing resistance.
This chart is ideal for quick, short-term trades, confirming limited room for upside, setting the stage for possible scalps within a narrow range.
📝 Trade Setups
Primary Short Setup
• Entry: Sell limit at 2,590 - 2,593; secondary entry at 2,595 if price retraces to resistance.
• Stop Loss: 2,598
• Take Profits:
• TP1: 2,583
• TP2: 2,580
• TP3: 2,575
Secondary Bounce Setup (Countertrend)
• Entry: Buy at 2,575 - 2,578 if reversal signals appear.
• Stop Loss: 2,573
• Take Profits:
• TP1: 2,585
• TP2: 2,590
🔄 Moving Average Detachment & Reversion Play
Across all timeframes, the price’s separation from moving averages suggests a possible mean reversion:
• Short-Term Reversion: Monitor for rejections near 2,590 to enter short positions if bearish momentum resumes.
• Long-Term Reversion: Daily chart support at 2,575 is critical; a break lower would confirm continued downtrend.
Summary
1. Bearish Continuation: The downtrend dominates, favoring short entries at resistance levels.
2. Corrective Bounce: Exercise caution on countertrend plays.
3. Mean Reversion: Moving average detachment suggests a potential short-term correction; watch for resistance rejection to confirm further short setups.
Trading Implications
• For Sellers: This setup favors short positions across timeframes, using resistance levels to enter or add to positions.
• For Buyers: Proceed with caution; the limited upside and strong resistance make long positions challenging unless a breakout occurs.
Conclusion: The strong bearish alignment across timeframes supports short setups with precise entries, while moving averages act as resistance across all timeframes, reinforcing the downtrend and creating opportunities to capitalize on minor pullbacks within a well-defined bearish environment.

BTC Daily AnalysisAccording to our previous analysis (22,march), Bitcoin is still bullish. Our target at that time was 83680 which is touched.
Currently, based on Ichimoku, Bitcoin is still trending upwards.
We expect a reaction from the following resistance levels:
👉92000
👉102100
👉123000
and supporting zones below:
👉78453
👉 73853
👉70374
👉61680
As long as the price does not break this zone (73853), we consider the Bitcoin trend to be bullish.
