A Comprehensive Guide to the Ichimoku CloudHello traders, in this post, we will be talking about how to trade using the Ichimoku Cloud. This is one of the most common, yet very effective and unique indicators to date and is prized by many traders as it foreshadows possible support and resistance levels.
------
What is the Ichimoku Cloud Indicator?
The Ichimoku Cloud indicator is an extremely versatile indicator that can help define possible support and resistance levels. It helps identify not only the support and resistance, but also provides data to help identify the overall direction of price, give a good idea on the momentum of price action, and can be used strictly alone as a trading signal - if used properly. Even though the Ichimoku may seem complicated, it is actually rather a very straightforward indicator. The concepts are easy to understand and the signals are well defined.
The Ichimoku indicator takes multiple averages and plots them on the chart that uses the figures to compute a 'cloud' which attempts to forecast where the price may find support or resistance in the FUTURE. The keyword here is future. This is one of the few indicators that can actually give you possible support in the future and present time.
The Ichimoku has 5 simple components:
1) Conversion Line
2) Base Line
3) Lagging Span
4) Leading Span A (this is what creates the cloud)
5) Leading Span B (this is what creates the cloud)
Conversion Line:
- On it's own, the conversion line shows the short-term price momentum
- The mid-point price over the last 9 periods (which is also the default value)
- An area of minor support or resistance
The market price above the conversion line shows the possible short-term upward momentum, allowing the trader to focus on buy signals. If the price is below the conversion line, it would signal short-term downward momentum, and just like when it trades above, you would want to find sell signals when it trades below the conversion line. The conversion line is not typically used on its own, but rather used in conjunction with the other components of the Ichimoku as listed above in the 5 components.
Base Line:
The Base Line shows the support and resistance levels on the medium timeframe. The midpoint of the high and low price is calculated over the last 26 periods within the chart. Just like the conversion line, on its own, can be used to find price momentum. If the price is above the base line, it means it is trading above the 26 period midpoint, and therefore has an upward bias. Vice versa when price is below the base line. Unless there is a very strong trend, the base line will often not be near the price. When the base line is often near or intersecting (crossing) with the price, it isn't helpful to determine the trend direction.
Lagging Span:
The Lagging Span is created by plotting closing prices 26 periods behind the latest closing price of an instrument. It is designed to allow traders to VISUALIZE the relationship between the current and prior trend, as well as to spot potential trend reversals. One of the key ways to use the Lagging Span is to view its relationship to the current price. When the price is below the lagging span, this is usually an indication that there is a trend within the price and can indicate that it will move higher. When the price is trading below the lagging span line, this is often an indication that there is WEAKNESS within the price. If the lagging span line is about to cross above the prior price line, this can be a confirmation of a bullish signal. If the lagging span line is crossing below the price, this can indicate the opposite, a bearish signal. Any interaction with the past price line is an indication of a choppy or sideways market and if a lagging is descending quickly into a past price line, it could be a sign of exhaustion for price.
Kumo Cloud (or Cloud for short):
The Kumo Cloud is formed via two lines, the Leading Span A, and the Leading Span B. The Kumo Cloud gives traders support and resistance levels that can be projected into the FUTURE. Not many indicators can give a price projection based on the future. It is very different from many other indicators because it provides support and resistance levels for the current data and time taken into account. Moving averages, for example, only give the present and past data as possible support and resistance, and doesn't give any indication of possible future support or resistances. The uptrend is indicated via a green cloud as shown in the chart above. The uptrend is strengthened when the leading Span A (green cloud line) is rising and is above the Leading Span B (red cloud line). Conversely, a downtrend is produced when the Leading Span A is BELOW the Leading Span B line - which creates the red cloud. As stated above, the Kumo cloud is shifted forward 26 periods that provides future support and/or resistance.
If the cloud is THICK = STRONG Support/Resistance
If the cloud is THIN = WEAK Support/Resistance
If the price is above the cloud, then there is enough of a trend to be in place that provides buying opportunities. If the price is below the cloud, then it's considered to be under selling pressure that can help provide sell signals. The longer the price action stays above or below the cloud, the stronger the trend and the more support/resistance the cloud offers.
The Kumo Cloud is suitable for long term traders as well as for trend/momentum traders. When combined with the MACD, for example, which is another momentum indicator, can provide high probability results.
The price relationship to the cloud can be defined as when the father the price action is from it, the stronger the trend and more volatile it can be. You want to avoid trading inside of the Kumo Cloud as it usually means that the market is indecisive.
Settings for the Ichimoku:
The Ichimoku relies on only three different time periods in the calculation:
9, 26, and 52.
The reason is because the Japanese markets used to be open for six days of the week, meaning that the number 9 represented a week and a half of trading. 26 equals the number of trading days in a typical month (30 minus four Sundays), and 52 equals two months of trading days. Japanese markets now only trade 5 periods per week - so some practitioners of the Ichimoku suggest revising the settings to:
7, 22, and 44.
In my personal experience, however, the traditional values of 9, 26, and 52, have performed far better.
Limitations:
The Ichimoku, of course, does have its limitations. The indicator can make the chart look incredibly busy with all of the lines. To help remedy this, depending on your trading needs, certain lines can be removed. It can actually be helpful to remove the lines, and keep only the cloud. In conclusion, just focus on which lines provide the most information for you as a trader, and then consider hiding the rest of the lines as they can be often distracting. The cloud limitations can also become irrelevant for long periods of time, as the price remains way above or below it, At times like these, the conversion line, base line and their crossovers, can then, also, become more of an importance as they generally stick closer to the price.
Here is an example of when we remove all of the lines, only keeping the cloud and the leading spans:
Ichomoku

BTCUSD TARGETSSome BTCUSD targets and a Pitchfork to asses overbought/Oversold ranges within the bulltrend.

USDCAD TO BUYThere is enough support for USDCAD to buy right now. Price has crossed the Ichimoku moving averages.
TP: 1.3275 or ABOVE

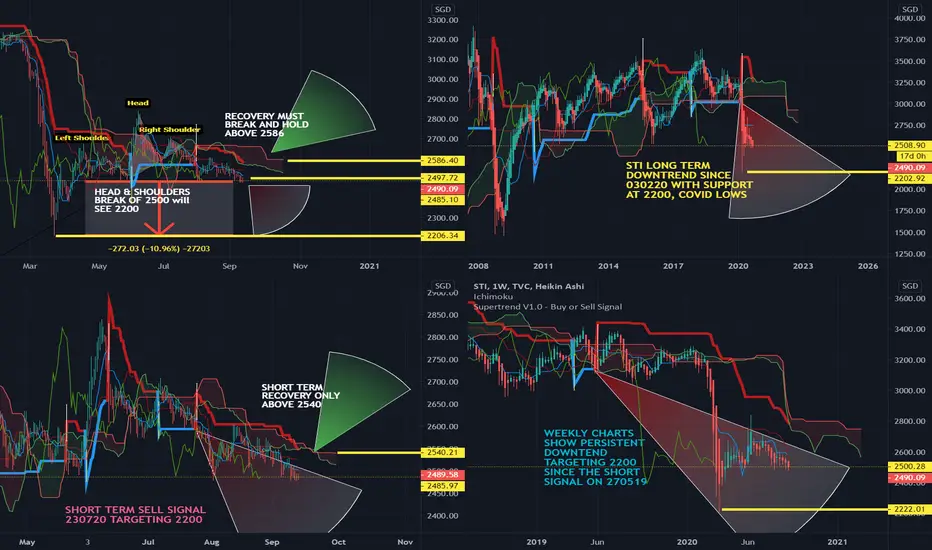
STI OUTLOOK 140920. weakness persistsThe STI is struggling to hold on to 2500. All indicators are on a downtrend.
To negate short term weakness, the STI must close back above 2540 - 2586 and hold.
The Medium and Long term prospects are weak and in a persistent downtrend.
2200 is the next target is weakness persists in the MT.
US30 16 July 2020 Daily Analysis BooBooDooDooDaDaI expect the price to correct to 26510 or 38.2% Fibonacci retracement.
The reason why it gets corrected because I notice in the Ichimoku indicator that the Tenkansen and Kijunsen are far separated. When that happened it will attempt to get closer for equilibrium.
On top of that, the price deviates too high from the Kijunsen which also indicates inequlibrium which eventually will get closer (correction) towards the Kijunsen.
If it goes below 38.2% and daily closes below 68.2% then the chance for a bearish reversal gets higher.
Speaking of the Eliot wave, I expect a 5th wave to the upside to be formed sometime today as seen in the chart.


GBPUSD TO BUY (GDP and FOMC STATEMENT NEWS)Based on how this trend is developing from the GDP and FOMC news statement, GBPUSD is looking like a buy right now. Please continue to pay close attention to this pair of the development of an uptrend for a buy.
TP: 1.247-1.25

Long SBM OffshoreLong SBM Offshore
- New uptrend started
- Close above 150EMA > rejected, but managed to close above again + break the swing high.
GBPUSD Will Continue To Rally Up!Since Monday, GBPUSD has been a long and still has the potential to rally up through the remaining of the week. For tomorrow, we can definitely experience more gains as a long.

USDCADThis swing trade setup has good Risk to Reward. Looking for price to continue up throughout the week, target set for 1.33500


SHORT EUR/USD Trading Strategy / TechnicalsThis is my trading strategy for EUR/USD Short for the next 4 - 6 weeks, I combine a Fibonacci Retracement, a Fibonacci Extension and the Ichimoku Cloud - For good measure I'll add an RSI and MACD indicator as well (to monitor movement of the market at that given time in that time frame)
Trading strategy for the next 4 - 6 weeks:
Based on a 4hr. time frame - We have a solid long red candle on March 07th - I expect some retracement to take place to the 50% fibbo extension @ 1.12049, I'm setting my stop loss 3 pips above the 38.20% fib extenion (1.12366) and my limit @ the 100.00% Fib extension to the 1.10835 price level. After this move I expect some retracement back to the 1.11756 price level (it may go a high as 1.12045 50% extension fibbo level ). I'll jump back in and set a trailing stop (@100 pips) and ride this puppy all the way down to the bottom 161.80 fibbo extension level; my limit will be 1.09303.


Hail EURO!EURCHF has broken out of cloud with Chikou span free with bullish TK Cross and Kijun is also not flat. It also aligns perfectly with zone to zone.

GBPAUD!We have a bullish TK Cross on 4Hour and it seems it's just struggling to break 1h previous support and should be on its way to the top here. I will be closing this if 4hour is back down to bearish and fails to break the cloud through-through.

GBPNZD IS A BIG SELLGBPNZD is a BIG sell due to news on the MPC Official Bank Rate Votes, Monetary Policy Summary, and Official Bank Rate today at 7AM EST.
Price and Lagging Line will soon pass beneath the cloud.
TP1: 1.9100
TP2: <1.9100


AUDJPY SellCloud is indicting a sell for AUDJPY. This could probably ride the entire day tomorrow as a sell.
TP 1: 83.5 TP 2: 83.3 TP 3: 83.1

BTC short term outlookBitcoin broke down from the short term bull channel that started on 1 May. As I am typing this we are testing the uptrend line of this channel.
Should a candle close above it we are back in full bull mode. My guess is it will probably be range bound between 9460 and 9680 for the next few days.
If the bears manage to break the weak support at 9450 the next test will be 9200. There is some support along the way but it is weak.
If support holds at 9200 we can expect it to rally to 9800 where it will face a little resistance. If that resistance folds we are breaking 10k.
If the bears break support at 9200, we might see 8800 which is the next major support. Or we can get stuck in the cloud and be range bound again.
I am currently long from 6900 and will exit if the bears take 9200 and wait for the next long. I am currently bullish but there are some key decision points ahead.
Happy Trading!!!

Cable might pull back before moving higherIt looks like the cable topped out last Friday. We might see a pullback past the 50% retracement of the last leg up.
I will enter at the 61,8% retrace as that's where the kijun sen will probably offer support.
My stop will be below the last swing low. Take profit target is set at an older resistance that is clear on the weekly chart.


QQQ rejected by KJ Line on 4hrQQQ is not a safe buy here. We have a bearish normal TK cross in the cloud and a clear rejection of the Kijun line on the 4 hour chart. Cloud is also twisting red which is another indication of a more downware movement ahead. A second item to note is the DMI. The (DMI-) is at 33 with the ADX at 43. Both are indications that the bears are still in control. We bounced today and will most likely fall tomorrow to create the 2 of a possible 123 rebound. I will not be stepping in here to buy until we get a bullish cross on the 4 hour TK. I am short until then.
