Review and plan for 22nd April 2025 Nifty future and banknifty future analysis and intraday plan in kannada.
This video is for information/education purpose only. you are 100% responsible for any actions you take by reading/viewing this post.
please consult your financial advisor before taking any action.
----Vinaykumar hiremath, CMT
ICICIBANK

Review and plan for 21st April 2025Nifty future and banknifty future analysis and intraday plan in kannada.
Quarterly results.
This video is for information/education purpose only. you are 100% responsible for any actions you take by reading/viewing this post.
please consult your financial advisor before taking any action.
----Vinaykumar hiremath, CMT

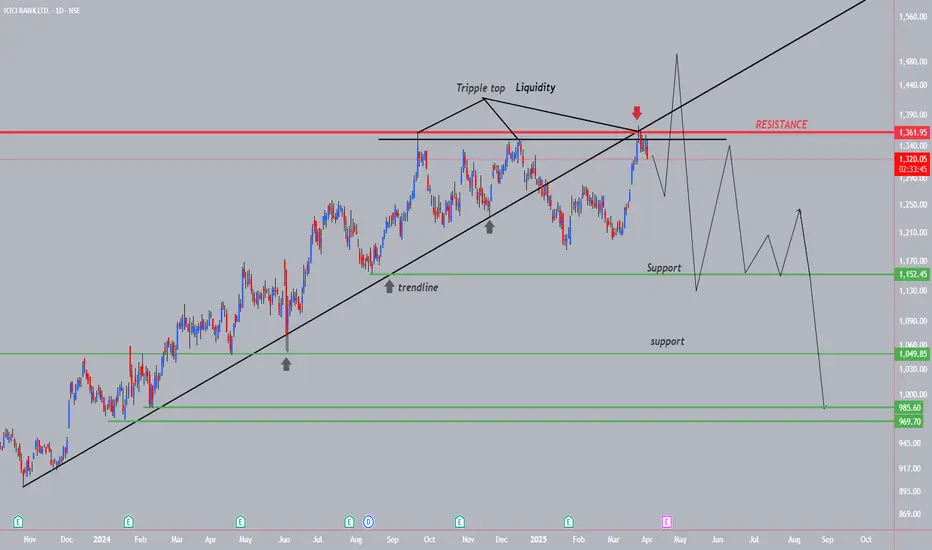
ICICIBANK--Tripple Top Liquidity+Down??This banking sector stock has broken the trendline strongly...
recently price taken the double top liquidity, creating an another liquidity....
do not make any attempt of short from this levels, still we don't have a sign of bearishness....
wait for one more liquidity on topside with strong upside move as exhaustion
then will observe a strong fall, after the liquidity...
then will go for short side...
on the bottom side we have a lot of trendline liquidity lies at support levels.
we have to look for buy at these levels for an investing point of view.
ICICI BANK LTD (IBN) WEAKNESS COULD DRAG PRICE TO ITS MEAN!The price of IBN is now showing weakness, all that is left is a pullback above 29 followed by rejection...
N.B!
- IBN price might not follow the drawn lines . Actual price movements may likely differ from the forecast.
- Let emotions and sentiments work for you
- ALWAYS Use Proper Risk Management In Your Trades
#IBN
#NASDAQ
#SP500
#NYSE

ICICIBANK Option Buy Trade (January 2025)I plan to buy the ICICIBANK 1290 Put Option (January Contract)
CMP: 25.90 | Best buy below 15.00
STOPLOSS: 7.50
TARGET: 1260 January future level.
Validity: Till 27th January 2025 Trading session.
Disclaimer: This is not a trade recommendation, for educational purposes only.

ICICIBANK !! Broke Trianlge Pattern on Monthly ChartICICIBANK !! Broke Trianlge Pattern on Monthly Chart
Along with that recently it made Bullish Engluf candle with good volume support. can be considered for swing trading with SL of 1200.

ICICIBANK 1D TFNSE:ICICIBANK has formed and is moving inside a triangular pattern. This can be traded on breakout
Disclaimer:- This analysis is only for educational purpose. Please always do your own analysis or consult with your financial advisor before taking any kind of trades

ICICI bank on angle 6 going up with selling in the short termWe have RED UMVD and RED TrapZone. With Red bar starting to form again. lets see if we gain selling momentum or not. Will post the daily after this.

icicibank for swing/poisitional
buy near 1210
avg at 1185-80
sl at 1160 sl 4% strictly follow sl
use capital 25k to 50 k
overall risk 1k to 2k only
tgt 4% 8%12%16%20%
hold 3-6 week

ICICI Bank in BreakoutICICI Bank NSE:ICICIBANK in Breakout. ICICI Bank in uptrend as we could see higher highs and lows in all timeframe. Buy above 1190 and Target would be 1350

ICICI Bank Showing Bullish Breakout!#ICICIBANK CMP: ₹1,318
➡️ Bullish breakout observed from an ascending channel
➡️ Volume rise supporting the breakout
➡️ Next targets: ₹1,380 on the upside

ICICI Bank Long Setup - Swing TradeICICI Bank has bullish engulfing setup and already 15m candle has sustained above the price - 1241.47 for more than 10 seconds.
Disclaimer: This is for educational purpose only and not any financial advice

ICICIBank Intraday Levels: 18-Sep-24Stock made high upto 1272, then sideways momentum in last trading session. Upside Breakout drag price for up, Trendline Breakout for down side momentum. Wait for prope Price Action on levels for Entry.
Bullish> 1273
Bearish < 1263

TIME TO BUY ICICI BANK ?ICICI BANK has recently surpassed the 1250 resistance level, which also marked an all-time high for the stock. It is currently trading above this level. You can consider entering now or wait for a pullback to 1250-1255 for a potentially better entry point.

ICICI Bank LtdImportant points marked.
*****Education purpose only*****
*****Investing in Equity is subjected to market risk do own research before investing*****

ICICI Bank next week target 1220, 1240, or 1260If you are looking for a good stock for the next week, ICICI Bank can be a best stock on our golden parameters. The stock has moved from downtrend to uptrend according to our parameters on the daily chart, of course the stock is still below the pivot point but the possibility of an uptrend in it cannot be ruled out. The stock closed at an upper level today after the consolidation of the last three weeks. Which can prove to be a better option for the next week.

ISEC - ICICI Securities - Uptrend - Long1. Head and Shoulder Pattern
2. BoS
3. ADX - started to show the trend strength

ICICI Bank Ltd: Ascending Trend Line and Potential Bullish BreakTechnical View
➡ Ascending trend line providing strong support
➡ Retrace from demand zone near 1150
➡ Next resistance at 1247
➡ Bullish breakout possible above 1192
➡ RSI at 52, indicating neutral momentum

#BEPL 104 TGT200 SL80 #NIFTY #BANKNIFTY #Stockstowatch #stocksBEPL 103.95
TGT 200
SL 80
TF < 8M
NSE:BEPL
RR > 4
If you like my work KINDLY LIKE SHARE & FOLLOW this page for free Stock Recommendations. With 💚 from Rachit Sethia

ICICI Bank's Global Ranking Ascends: A Bullish Trading SignalICICI Bank has climbed to become the 18th most valuable lender globally, signaling a bullish outlook for traders. The technical analysis of its stock reveals a recent breakout supported by an ascending trendline, indicative of strong buying momentum and potential for further gains. This key milestone underscores ICICI Bank's robust market presence and offers a promising trading opportunity in the financial sector.

icici Bank channel support Long entryNSE:ICICIBANK icici Bank channel support Long entry above 1135 target 1170

#DHANBANK 44.16 TGT 70+ #BankNifty #Stocks #Nifty #Watchlist #ITDHANBANK 44.16
TGT 71 // 78
SL 42
TF < 6M
RR > 4
Return >70%
If you like my work KINDLY LIKE SHARE & FOLLOW this page for free Stock Recommendations. With 💚 from Rachit Sethia

ICICIBANK Intraday Levels: 24-Jun-24Stock closed near at Resistance Zone & Trendline support
Bullish > 1170
Bearish < 1150
Wait for proper rejections at zones, for entry add your strategy or indicator combination.
