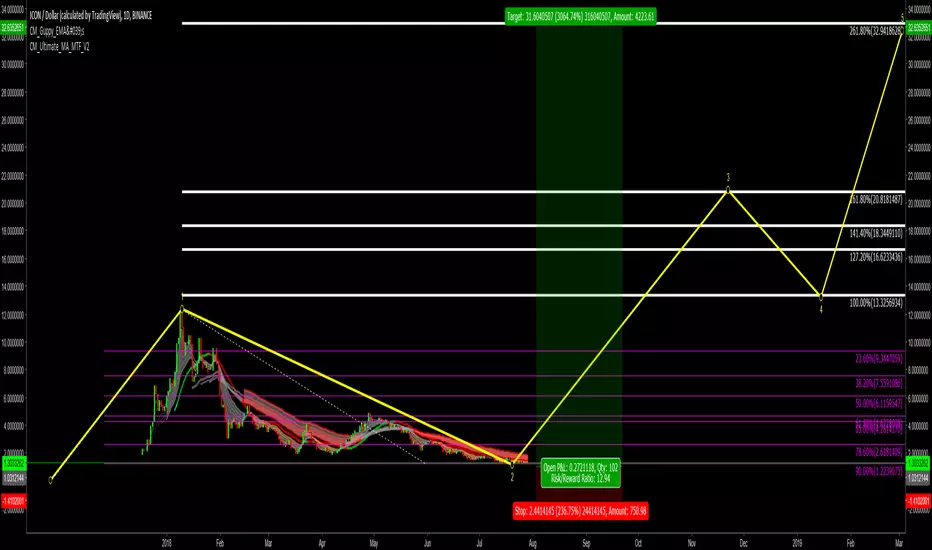
ICX BTC WAVECOUNTSHere is my attempt to count ICXBTC in detail. ICX is actually making weird moves since today, that lead me to believe that we may finised another big wave.
I cant tell how deep wave 4 is goint to retrace and if wave 5 is going to fail. Take BTC movements into account for further prognosis. What shows up here is that we seem to bottom with wave 3 @ 1.618 at the bottom of the green zone. and as we didnt retrace much in wave 2, wave 4 may retrace higher.
ICON

ICON 800 TargetI made a prediction a while ago found here:
Because it was a bearish prediction i got some critique, even showed in the comments bellow, but since then we have been following the path downwards and we're on course with the bearish trendline. Thoughts?

ICON (ICX) Bullish Divergence, possible long.ICX has been on a freefall for the past few weeks. However, each time the RSI reached oversold we have had a small bounce. This could be another one of the bounces.
Signals:
Bullish Divergence on 1 hour
A bounce from support
Buy in:
1472
Sell:
1500
Stop loss:
1454, where the previous support has been. If we bottom out here it could be anywhere from 1-6% over the next 2 days.

DIGITAL ALPHA UPDATE - ICX SpikesThere is not much to say here other than what the graph depicts. Also note the ICX/KRW pairing is paying a 30% premium right now.


ICON - Something is on the making Endless freefall for ICX, but we may be near the bottom. We are on the low side of the channel, and you can see that the volume is decreasing, I don't know if BTC is draining volume with ETF hype etc, but this could be a sign that something will happen very soon. I'm expecting up movements here.

$ICX Measured MovesBeen noticing a lot of measured moves in several alts lately. Bottom could be in, but if $BTC continues to move up I could see a retracement to the 1364-1464 happening. I absolutely do not see $ICX falling below these levels. I have been laddering slowly into a short/medium term swing position since around 1780 SATs -0.53% . A retracement to these levels would be around one of its 38% moves down as shown in the chart.

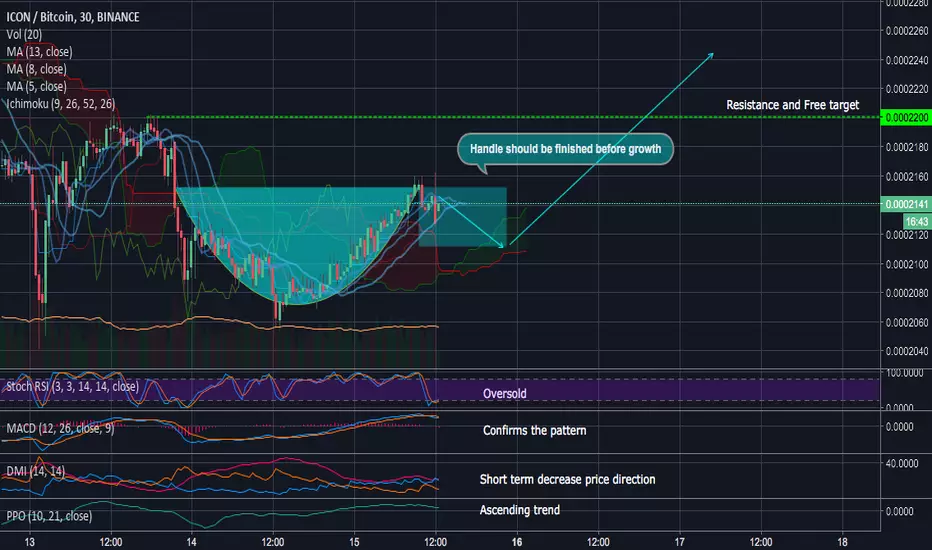
ICXBTC Cup&Handle and Descending wedge breakoutICX has been oversold for a long time, the indicators show a high rebound probability.
On a 30-minutes timeframe there is a bullish reverse indicators and cup&handle formation which is going to be finished soon.
On a 1-day scale, you can see the formation of a descending wedge, a pattern indicating the end of a downtrend and the possibility of breaking through resistance via a strong bounce which opens a way for further growth.
From current levels, we can jump to the resistance, which is marked on the chart. This will finish the pattern and will indicate a bullish breakout from the long term descending channel.
When this happens a regular correction will occur and we will start a swing trade strategy. Once the price consolidates around Fib 0.618 - Fib 0.5, it will be possible to open long position according to the rest targets which are in the Premium channel.
We remind you that under the current state of the global crypto market, each position carries a high level of risks. Although this trade recommendation has low risk according to our classification scheme, do not follow emotions and "animal spirit", open only the position you are able to manage and track, use a stop loss. If the market goes below support, then the correct decision will be selling on the rebound and then buy again at lower levels, this will provide an opportunity to sell at previous entry order with profit. Be careful and keep tracking BTC and your opened alt positions.
ICXBTC: What do you think all?Hi All,
Icon ICX Analysis: Using a Swing Trader Mentality.
Uptrend to 0.0002326 or Downtrend to 0.0001800...
60/40 split: Reversal to Target#1 0.0002336 & Target#2 0.0002790
ICXBTC has broken its Solid Support @ 0.0002056, Freefall to ICXBTC : DownTrend...
Traders are risk managers and should preserve our capital...
I'm a firm believer in the ICXBTC project and these are great entry prices...
This is not Financial advice...
Always have a checklist before entering any trade: Long or Short...
1. The Trade setup 2. The Entry 3. Initial Stop Loss
4. Exit and Trailing Stop 5. Capital size willing to risk
No Objectivity or Emotions when trading...
There are only three trend which could occur within any market...
Individual Traders focus too much on trend-line...
Instead of the overall trend in conjunction with the market sentiment...
What I look for before entering any trade:
Uptrend: Higher highs and Higher lows
Downtrend: Lower highs and lower lows
No Trend: Horizontal or sideway pattern
Keep in Mind when trading: Not to be greedy: Use Trailing Stop Loss...
3-5 Bar Declines: it's an indicator to - Buy
3-5 Bar Increase: it's an indicator to - Sell
Don't forget why you got into the crypto sphere...
Only Buy Pull Backs in projects you believe in for the next 5yrs: Long...
Majority of investors are going to sell when they break even: Short...
I firmly believe ICXBTC will make higher high on it's all time high...
Hope this chart was helpful to you all. If you all have questions feel free to ask or comment in the comment section below.
Be sure to Follow me and like this post if it was helpful, and thank you all...
Like the Phoenix we will rise from the ashes...
Happy trading People...

ICON vs Bitcoin Slowly Moving UpICON seem to have found the bottom at btc 0.0002 area. Since 14th of June price has been slowly but steadily moving upwards, producing higher highs and higher lows.
While rising, on a correctional wave down ICX/BTC rejected the 2/1 Gann Fan trendline along with the 50% Fibonacci retracement level at btc 0.000215.
Icon has approached the 200 Moving Average, but failed to reach it. It is highly likely that on the next wave up, the Moving Average will be reached, the question is whether it will be broken or rejected.
If broken ICX should continue going higher towards either 61.8% or 76.4% Fibonacci retracement level. But, if Moving Average will be rejected, Icon might correct down, perhaps to test the btc 0.000215 support yet again.


ICX/BTC : falling wedge is breaking up soon ...$ICX : falling wedge, ready to break ?
Context :
- Retracement since many weeks
- Accumulation in volume
- Falling wedge pattern
- Close to the old support
Hope :
- Korean Government should be in love with crypto
- Bittrex listing
Check the 4Hr Chart here :

ICON, an enormous growth potential!ICON looks more and more promising, in addition to its positive fundamentals in the weeks and months to come, ICON has a technical configuration that could allow for good growth.
Arrived on its support at 0.00023, ICON shows signs of accumulation and reinforcement. The bevels could be broken soon, leaving first of all a growth on the long-term resistance (+/- 0,00032), and in case of rupture, allowing to reach levels higher than 0,00038 and 0,0005
MACD confirms a buying situation, confirmed by a very nice WaveTrend signal. The bevel break could also start a Donchian signal.
ICX is clearly one of the values with potential on the market.

#ICON #BITCOIN #BITCOINPRICE #TRADING #BITDHARMATops and bottoms of the past are the perfect guide to set future targets, make sure to use them.
Targets:
- 3580 Sats
- 4460 Sats
- 4900 Sats
- 5700 Sats
- 6424 Sats

Have alerts set playing as C wave. Buying pullback of 1Have alerts set playing as C wave. Buying pullback of 1

ICXBTCHey All,
Hope you all are having a good trading day...
What do you all think ICXBTC, depening on BTC going and standing above $6800-6900?
I see change in trend with higher lowes coming this next couple of weeks.
Enjoy your trades
Don't forget to follow and like...


ICX - ICON looks weakHeard a lot of good things from trader community about fundamentals of ICX, however looking at the chart it looks bad. 2400 needs to hold in order to stage a pullback. On the upside 3100 needs to break for a larger upside

Scaling into IconI am starting to scale into some alts at these levels. BINANCE:ICXBTC being on of them

ICX Pull back continues!Hello Dear followers,
It seems like the pullback is still not over and we are heading for one more double bottom formation in icxbtc pricaction. We believe green box is a good entry point, and below that we do not have any support zones since the coin entrance in binance.
ICX - Upcoming Events
30 June 2018
ICX/ETH Decentralized exchange
Validation: 1085/1137
01 July 2018
Blockchain conference in Seoul, South Korea, on July 1st and 2nd.
Validation: 281/291
03 August 2018
"The inaugural edition on the 3rd and 4th of August will take place in Hyderabad, Telengana’s Thriving IT and Tech hub..."
Validation: 30/34
Cryptocholics out, peace out!

$ICX (ICON) LevelsImportant levels for $ICX.
also, pay attention to this low RSI.
let me know what do you think about it.
Thanks.

ICONic Divergence for ICX in RSI MACD StochIm playing an RSI divergence trade which has been working really well lately.
For more on this RSI strategy, please see the related link below... RSI and crypto trading.
Entry at 1.63
Stop at 1.41
Target at 2.16 OR
whichever happens first, the price when RSI reaches 60, OR the 100 MA.
If target approaches, and I can catch it, I will move stop trail it instead of exiting exactly at 2.16. While I know the risk, the target can fluctuate on these counter trend RSI trades.
This trade, if correct, will net about 2.4R
questions or comments, let me know. likes are appreciated.
Travis
JMJ - UIOGD
