ICP shortICP bounced off the resistance level. Asset broke trough off the ascending trendline. Bearish movement to support level at 7.5 is possible.
ICP

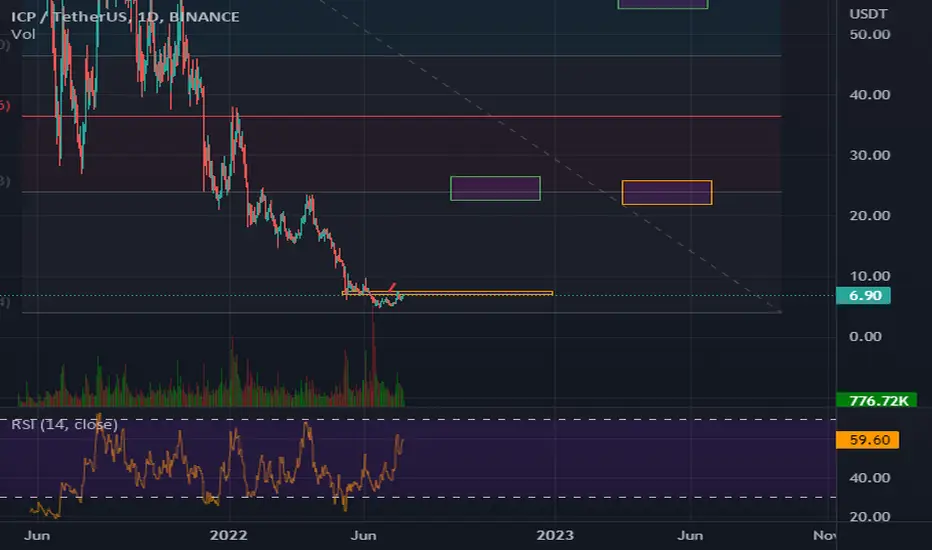
ICP DAILY PA LOGDoing two linked ideas for icp
One in linear and one in log
Let's see which works best
GRI 2022

ICP/USDT LONGhi friends.this is my idea for icp. icp is in 4rd wave. i think icp can go up to about 9dollors

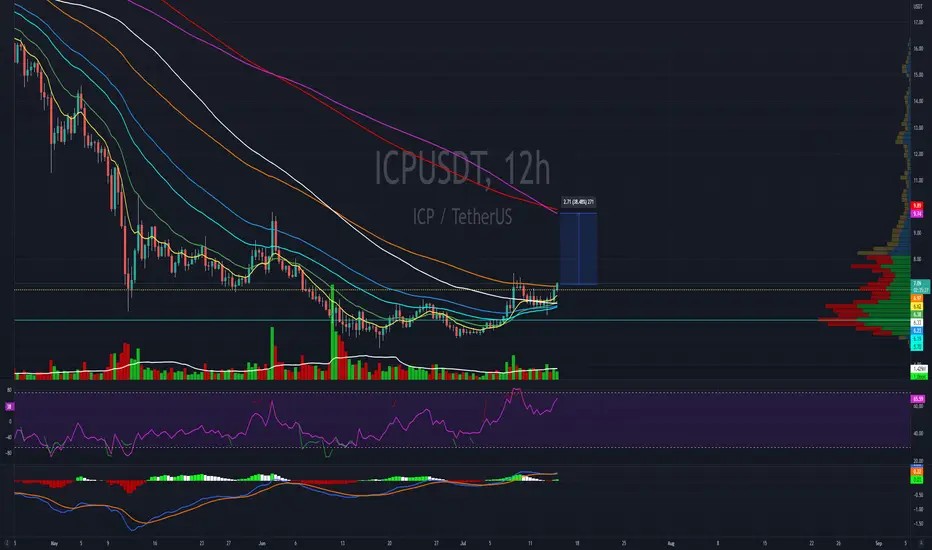
ICP is ready to go, accumulate 6,9-7,1 with tight SLOverall btc.d is bearish and new money is flowing in to markets - we are having a small green session here and ICP is bullish, target 9-11 usd. Manage your risk
Not a financial advice.
If you need help. leave comment here.
Have a great day :)
ICP shortICP broke trough the ascending trendline. Asset broke trough the support level. Bearish movement to support level at 6.2 is possible.

Nice Technical tradeLooks like this is being pulled along by bitcoins current rally and the momentum has cause the price to break up and out of the previous ascending range/channel, retested the break, now currently developing support on top of the previous resistance.
This is crypto, odds are longer, trades are more fragile because liquidity can trap you.... This is really just for fun and if anyone follows this trade, they should be prepared to lose all deployed capital and possibly even more through incidental costs and tax liabilities.
THIS IS NOT FINANCIAL ADVICE, THE ONLY ADVICE IS TO MAKE YOUR OWN TRADES

Insane Cloud PosseThis has printed a huge bullish reversal against btc on the monthly
The crypto bear will be in full swing by 2023
This coin could still do ok
The web 3 meme is real
GRI 2022

ICP impulse, and a potential Great Short!BINANCE:ICPUSDT
COINBASE:ICPUSD
BYBIT:ICPUSDT
Internet Computer (whatever that means) ICP had a massive move, 32%, on a tiny 3.4mil in Volume (not $, just tokens). This was a parabolic move, shorting ICP is high risk, as general stats are yet to show weakness.
General Stats:
Daily RSI: 63.35
Daily Volume % change: 150.20%
Setting up a Short trade , I'll see how it reacts to a recent Golden Pocket, 7.90 - 7.80
Price must break below the GP
Price retests GP and gets rejected
Short Entry around: 7.8
Short Target #1 : 7.40
Short Target #2 : 6.70
Short Target #3 : 6.27


In 4 day ICP will have 14 Monthly red candlesI dont know if this is the first coin EVER with 14 monthly straight red candles, but i expect a bull run atleast as long!!!
Name me 1 other coin with 14 monthly red candles without having 1 green one inbetween, absolutely insane...
Their for i expect a minimum of 14 monthly straight green candles in return.
ICP will go tru the roof very soon! Complete oversold in my opinion!

Internet Computer (ICP) forme bullish Cypher for upto 32% pumpHi dear friends, hope you are well and welcome to the new trade setup of Internet Computer ( ICP )
On a daily time frame, ICP has formed a bullish Cypher pattern.
Note: Above idea is for educational purpose only. It is advised to diversify and strictly follow the stop loss, and don't get stuck with trade.

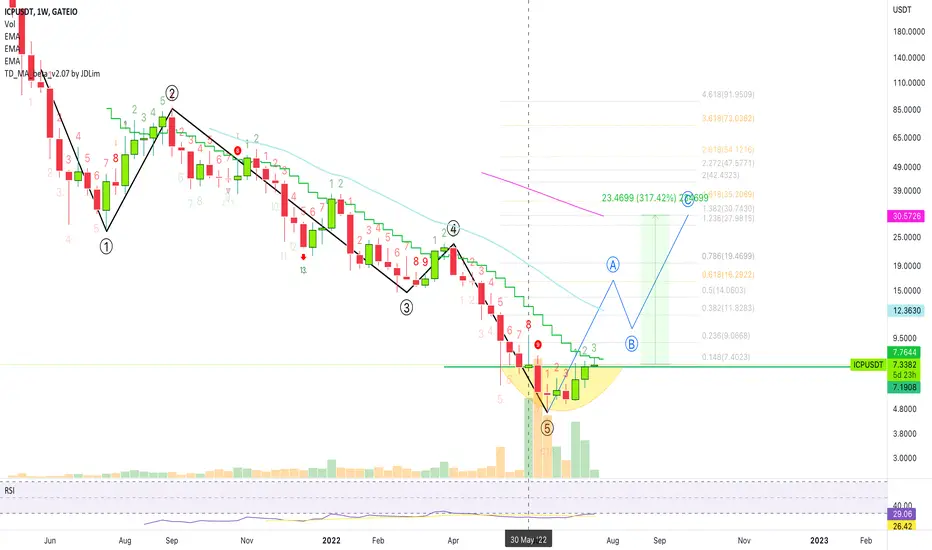
Internet Computer vs Tether (Huge 300%+ Potential)The Internet Computer (ICPUSDT) is still trading below EMA10 weekly, which signals short-term bearishness but we can expect things to change.
The huge increase in trading volume in late May is what gives it away.
And the potential is big here... Over 300%.
This pair remains oversold... Again, things will change.
Note: Remember to have a plan/strategy ready before you decide to trade.
There is always risks involved...
This is not financial advice.
Thanks for the support.
We'll see you tomorrow.
I am done. I have books to read.
Can't be here playing all day.
Namaste.
$ICP is Bullish AFInternet Protocol $ICP has printed a beautiful bullish Adam & Eve pattern, and confirmed it with a nice bullish falling wedge.
$8 and $8.5 can be the targets ahead.
Not financial advice. DYOR

Update on earlier Adam and Eve pattern idea.The CPI numbers adding a lot of pressure during the re-test.
If 6 USD holds the earlier idea is still valid.

Is #ICP ready to big movement ?Hello SorooshSchool guys ,
As you can see , #InternetComputer in it's USDT pair retested the base level at the area of 6.5 dollar and if total start continuation to the upward , #ICP can make good movement from current support area
Targets are marked on the chart
Do not forget Support us by Like and Commenting your recommendations and requests

ICPUSDT-long signalHi,
After a while I decided to publish a possible LONG POSITION on ICP.
In daily time frame it has a double bottom pattern and now its in a pullback.
In this picture you can see the last correction waves.
Now we are in 5-3 wave.
Entry: 6.8
SL: 6.25
TP1: 7.4
TP2: 8
Enjoy

LUNA2 Trend Entry shortThe simplest setups are the best, LUNA2 has broken its uptrend and entered a downtrend. The entry was based on the break of the uptrend support.
Entered short at 2.13, expecting to hold this one a while as LUNA2 slowly dies a death.
Poor fundamentals in a weak market.

ICP Long oppICP Tehcnical analysis basically on elliott waves Principles and Priceaction Strategy
ICP Can be 29$ and then 80$
Wait and watch

ICP / USDT 4H LONG IDEAICP / USDT 4H LONG IDEA
double bottom confirmed after break the 6.4 resistant zone and monthly pivot
now retest is going on and after a rejection on 1h with good momentum , it can continue his bull run
not financial advice

TRX Short in poor marketConsidering BTC position and this gentle climb on no fundamentals or volume builds a solid picture.
Reaching previous resistance.
Long term downtrend resistance approaching
Entered short long term, expecting 0.65
Eventually down to 0.5 with
bad market conditions.

ICP Simple short setup failing to break resistanceSimple short setup on ICP. It has been in a long downtrend for a considerably amount of time as it is a poor fundamental crypto. Combined with market conditions, the recent increase in price action is unsual, leading me to believe it is weak and will fall easily on the next BTC down day.
Setup presented as this looks to be reaching resistance, which was previous support. Entered short, will hold for a long time as this could be going way below 6 with prolonged bad market conditions.

ICPUSD No overexcitement about rise. Observe this potential top.The Internet Computer Protocol (ICPUSD) broke yesterday above its 1D MA50 (blue trend-line) for the first time since April 08 (completing 3 months below it, the most during this Bear Market). With the 1D RSI just below its 11 month Resistance Zone that has priced all Lower Highs within this Bearish Megaphone pattern that started in September 2021, we should be concerned of this 1 week trend and a potential continuation.
As you see on this chart, every time the price broke above the 1D MA50 since November 2021, it didn't stay there for long and resumed the long-term bearish trend. This time period is depicted by the blue circle. As a result, if the price exceeds this limit and hasn't made a Higher High, best to sell ICP back towards its 4.60 Support. If on the other hand it breaks above the circle, buy the break-out targeting the top (Lower Highs) trend-line of the Megaphone. On the long-term, only a break above the 1D MA200 (orange trend-line), is technically capable of reversing the sentiment to bullish.
--------------------------------------------------------------------------------------------------------
Please like, subscribe and share your ideas and charts with the community!
--------------------------------------------------------------------------------------------------------
